Retesting AMD Ryzen Threadripper’s Game Mode: Halving Cores for More Performance
by Ian Cutress on August 17, 2017 12:01 PM ESTCPU System Tests
Our first set of tests is our general system tests. These set of tests are meant to emulate more about what people usually do on a system, like opening large files or processing small stacks of data. This is a bit different to our office testing, which uses more industry standard benchmarks, and a few of the benchmarks here are relatively new and different.
All of our benchmark results can also be found in our benchmark engine, Bench.
PDF Opening
First up is a self-penned test using a monstrous PDF we once received in advance of attending an event. While the PDF was only a single page, it had so many high-quality layers embedded it was taking north of 15 seconds to open and to gain control on the mid-range notebook I was using at the time. This put it as a great candidate for our 'let's open an obnoxious PDF' test. Here we use Adobe Reader DC, and disable all the update functionality within. The benchmark sets the screen to 1080p, opens the PDF to in fit-to-screen mode, and measures the time from sending the command to open the PDF until it is fully displayed and the user can take control of the software again. The test is repeated ten times, and the average time taken. Results are in milliseconds.
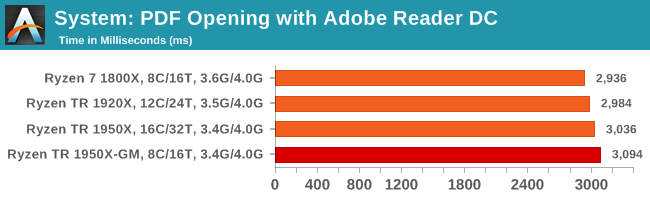
There's not much between the Threadripper CPUs here, but frequency wins the day.
FCAT Processing: link
One of the more interesting workloads that has crossed our desks in recent quarters is FCAT - the tool we use to measure and visually analyze stuttering in gaming due to dropped or runt frames. The FCAT process requires enabling a color-based overlay onto a game, recording the gameplay, and then parsing the video file through the analysis software. The software is mostly single-threaded, however because the video is basically in a raw format, the file size is large and requires moving a lot of data around. For our test, we take a 90-second clip of the Rise of the Tomb Raider benchmark running on a GTX 980 Ti at 1440p, which comes in around 21 GB, and measure the time it takes to process through the visual analysis tool.
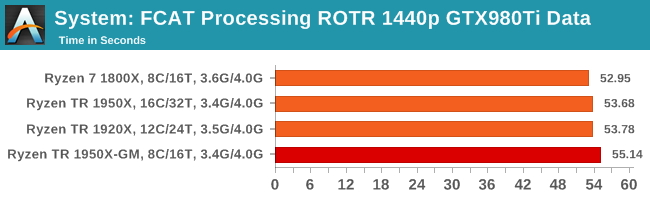
Similar to PDF opening, single threaded performance wins out.
Dolphin Benchmark: link
Many emulators are often bound by single thread CPU performance, and general reports tended to suggest that Haswell provided a significant boost to emulator performance. This benchmark runs a Wii program that ray traces a complex 3D scene inside the Dolphin Wii emulator. Performance on this benchmark is a good proxy of the speed of Dolphin CPU emulation, which is an intensive single core task using most aspects of a CPU. Results are given in minutes, where the Wii itself scores 17.53 minutes.
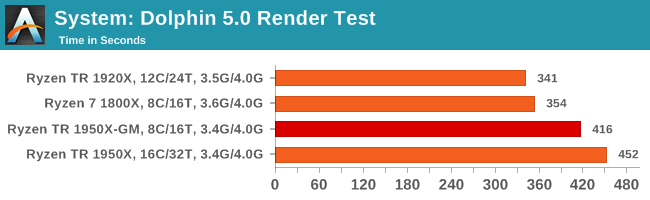
Dolphin likes single thread performance as well, although interpreting this graph is giving me somewhat of a headache. Game Mode seems to give a small improvement here.
3D Movement Algorithm Test v2.1: link
This is the latest version of the self-penned 3DPM benchmark. The goal of 3DPM is to simulate semi-optimized scientific algorithms taken directly from my doctorate thesis. Version 2.1 improves over 2.0 by passing the main particle structs by reference rather than by value, and decreasing the amount of double->float->double recasts the compiler was adding in. It affords a ~25% speed-up over v2.0, which means new data.
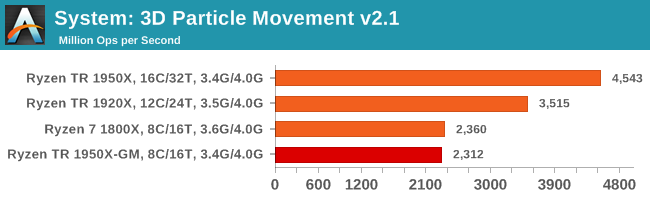
Our first pure multithreaded test, and the 1950X wins with 32 threads. The 1920X beats the 1950X in Game mode, due to 24 threads beating 16 cores. The 1800X edges out the 1950X-GM due to frequency.
DigiCortex v1.20: link
Despite being a couple of years old, the DigiCortex software is a pet project for the visualization of neuron and synapse activity in the brain. The software comes with a variety of benchmark modes, and we take the small benchmark which runs a 32k neuron/1.8B synapse simulation. The results on the output are given as a fraction of whether the system can simulate in real-time, so anything above a value of one is suitable for real-time work. The benchmark offers a 'no firing synapse' mode, which in essence detects DRAM and bus speed, however we take the firing mode which adds CPU work with every firing.
Unfortunately we had issues with the 1920X posting a result.
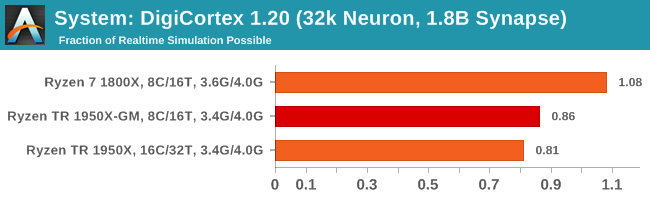
DigiCortex requires a mash of CPU frequency and DRAM performance to get a good result, although the 1950X in any mode regresses the result, even in Game Mode, suggesting it is more sensitive to overall DRAM latency.
Agisoft Photoscan 1.0: link
Photoscan stays in our benchmark suite from the previous version, however now we are running on Windows 10 so features such as Speed Shift on the latest processors come into play. The concept of Photoscan is translating many 2D images into a 3D model - so the more detailed the images, and the more you have, the better the model. The algorithm has four stages, some single threaded and some multi-threaded, along with some cache/memory dependency in there as well. For some of the more variable threaded workload, features such as Speed Shift and XFR will be able to take advantage of CPU stalls or downtime, giving sizeable speedups on newer microarchitectures.
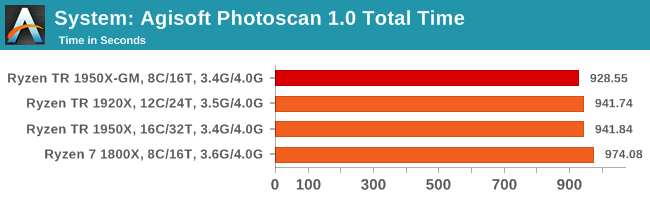
The variable threaded nature of Agisoft shows that in our workflow, it's a mix of cores, IPC and frequency required to win. The quad-channel memory and lower crosstalk of the 1950X in Game Mode seems to get a marginal improvement over the 1950X.


104 Comments
View All Comments
MrSpadge - Thursday, August 17, 2017 - link
It's definitely good that reviewers test the game mode and the others, so that we know what to expect from them. If they only tested creator mode the internets would be full of people shouting foul play to bash AMD.deathBOB - Thursday, August 17, 2017 - link
Ian - why not just enable NUMA and leave SMT on?Ian Cutress - Thursday, August 17, 2017 - link
The fourth corner of testing :)lelitu - Thursday, August 17, 2017 - link
Looking at setting up something for a home VM host, and linux development workstation makes NUMA with SMT the most useful set of benchmarks for my usecase.I'm particularly interested in TR, because it's brought the price of entry low enough that I can actually consider building such a system.
Ratman6161 - Friday, August 18, 2017 - link
ThreadRipper is big bucks for your purposes if I'm reading this correctly. For a home lab sort of environment a lot of cores helps as does a lot of RAM, but you don't necessarily need a boatload of CPU power. For example, in my home ESXi system I've got an FX8350 which VMWare sees as an 8 Core CPU. I've also given it 32 GB of DDR3 RAM (purchased when that was cheap). The 990FX motherboards work great for this since they have plenty of PCIe lanes available. In my case, those are used for an ancient ATI video card I happened to have in a drawer, an LSI x8 RAID card and an x4 Intel dual port gigabit NIC. The RAID card has 4 1 TB desktop drives hooked up to it in a RAID 5.All of the above can be had pretty cheap these days. I'm thinking of upgrading my storage to 4x2 TB SAS drives - available for $35 each on Amazon...brand new (but old models). The system is running 6 to 7 VM's (Windows Servers mostly) at any given time. But with only two users, I don't run into many cases where more than two VM's are actually doing anything at the same time. Example: Web server and SQL Server serving up a web app.
For this environment, having a storage setup where the VM's are not contending for the disks and also having plenty of RAM seems to make a lot more difference than the CPU.
Of course if you have the bucks and just want to, ThreadRipper would be terrific for this - just way to expensive and overkill for me.
lelitu - Monday, August 21, 2017 - link
That depends a lot on what you want the VMs for. Unfortunately for the sort of performance testing and development I do a VM toaster isn't actually good enough. Each VM needs at least 4 uncontended cores, and 10GB uncontended RAM. Two VMs is the absolute minimum, 3 would be better.That's not going to fit into anything less than a ryzen 7 minimum, and a Threadripper, *if* it performs as I expect in SMT + NUMA mode would be almost perfect. Unfortunately, you're right, it's a *lot* of coin to drop on something I don't know will actually do what I need well enough.
Thus, I wish there were SMT+NUMA workstation and VM benchmarks here.
JasonMZW20 - Thursday, August 17, 2017 - link
Seems like Game Mode should have bumped up the base clocks to 1800X levels, especially for Nvidia cards using a software scheduler that seems to scale with CPU frequency. AMD's hardware scheduler is apparent in overall FPS stability and being mostly CPU agnostic.Matching base clocks with 1800X or even 1900X (3.8GHz) might be better on TR for gaming in Game Mode.
lordken - Friday, August 18, 2017 - link
Also for some weird reason that 1800X is much faster with higher fps in civilization and tomb rider?peevee - Thursday, August 17, 2017 - link
"because the 1920X has fewer cores per CCX, it actually falls behind the 1950X in Game Mode and the 1800X despite having more cores. "Sorry, but when 12 cores with twice memory bandwidth are compiling slower than 8, you are doing something wrong. Yes, Anandtech, you. I'd seriously investigate. For example, the maximum number of threads were set at 24 or something.
Ian Cutress - Thursday, August 17, 2017 - link
When you have a bank of cores that communicate with each other, and replace it with more cores but uneven communication latencies, it is a difference and it can affect code paths.