The AMD Ryzen Threadripper 1950X and 1920X Review: CPUs on Steroids
by Ian Cutress on August 10, 2017 9:00 AM ESTGrand Theft Auto
The highly anticipated iteration of the Grand Theft Auto franchise hit the shelves on April 14th 2015, with both AMD and NVIDIA in tow to help optimize the title. GTA doesn’t provide graphical presets, but opens up the options to users and extends the boundaries by pushing even the hardest systems to the limit using Rockstar’s Advanced Game Engine under DirectX 11. Whether the user is flying high in the mountains with long draw distances or dealing with assorted trash in the city, when cranked up to maximum it creates stunning visuals but hard work for both the CPU and the GPU.

For our test we have scripted a version of the in-game benchmark. The in-game benchmark consists of five scenarios: four short panning shots with varying lighting and weather effects, and a fifth action sequence that lasts around 90 seconds. We use only the final part of the benchmark, which combines a flight scene in a jet followed by an inner city drive-by through several intersections followed by ramming a tanker that explodes, causing other cars to explode as well. This is a mix of distance rendering followed by a detailed near-rendering action sequence, and the title thankfully spits out frame time data.
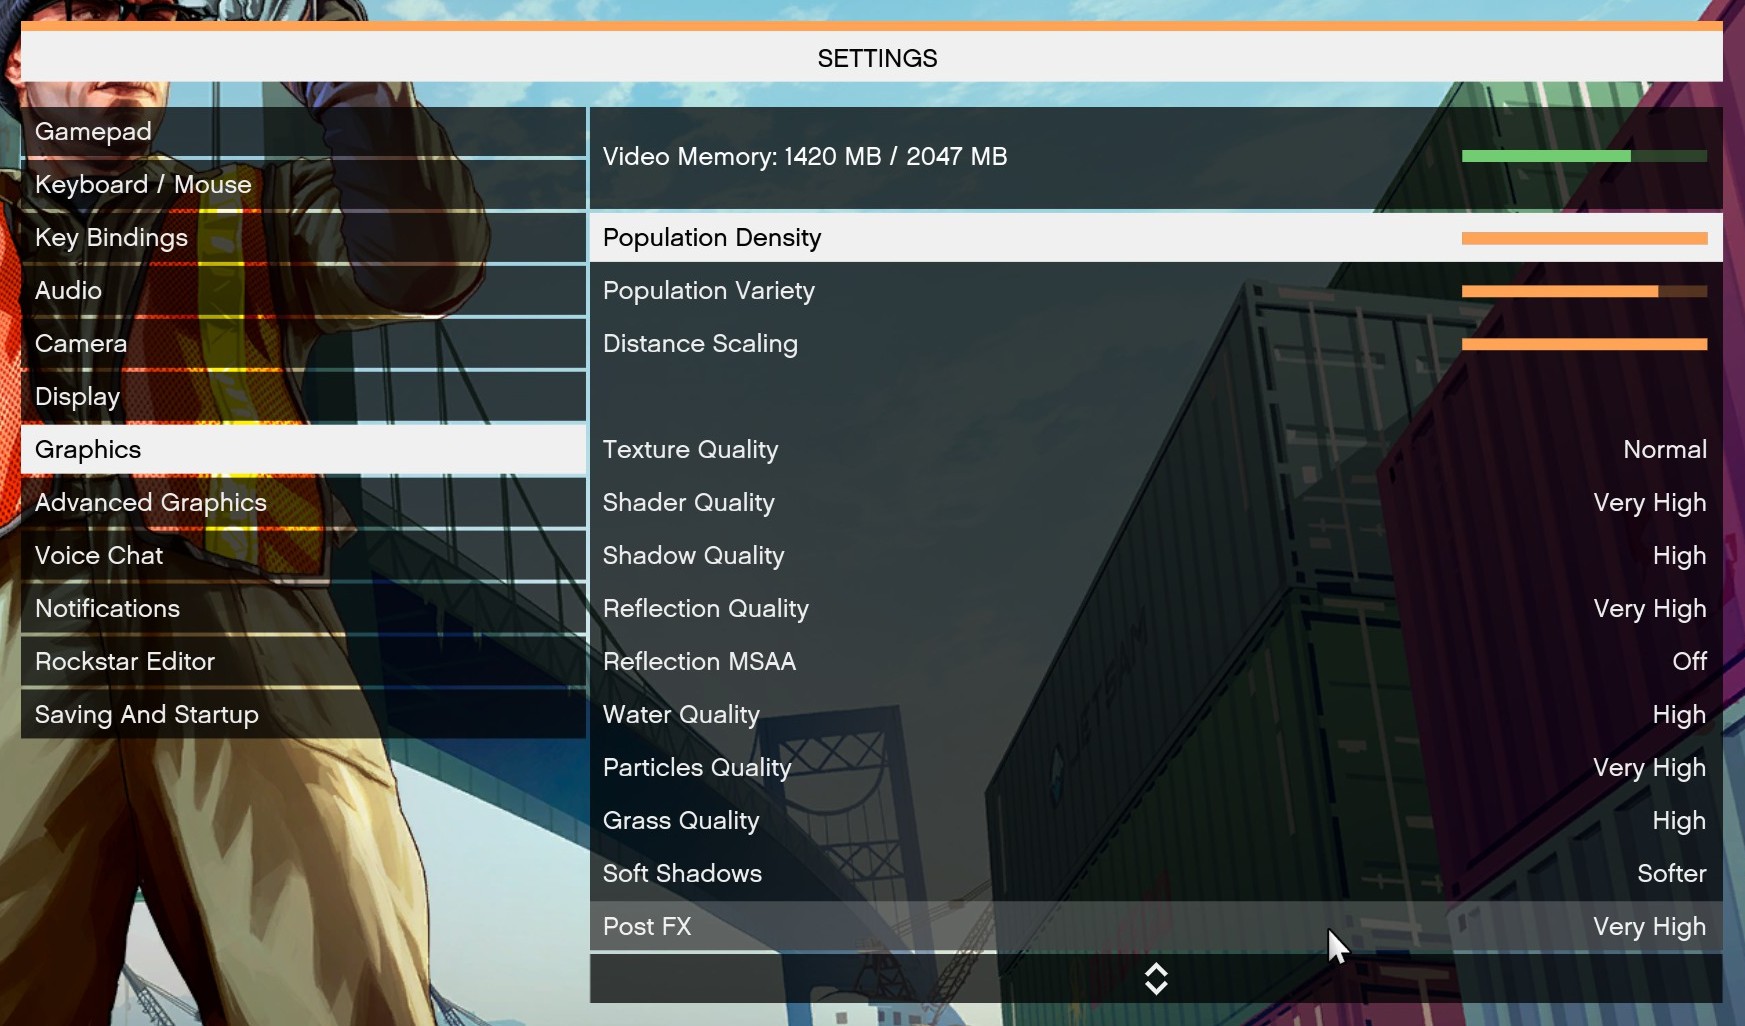
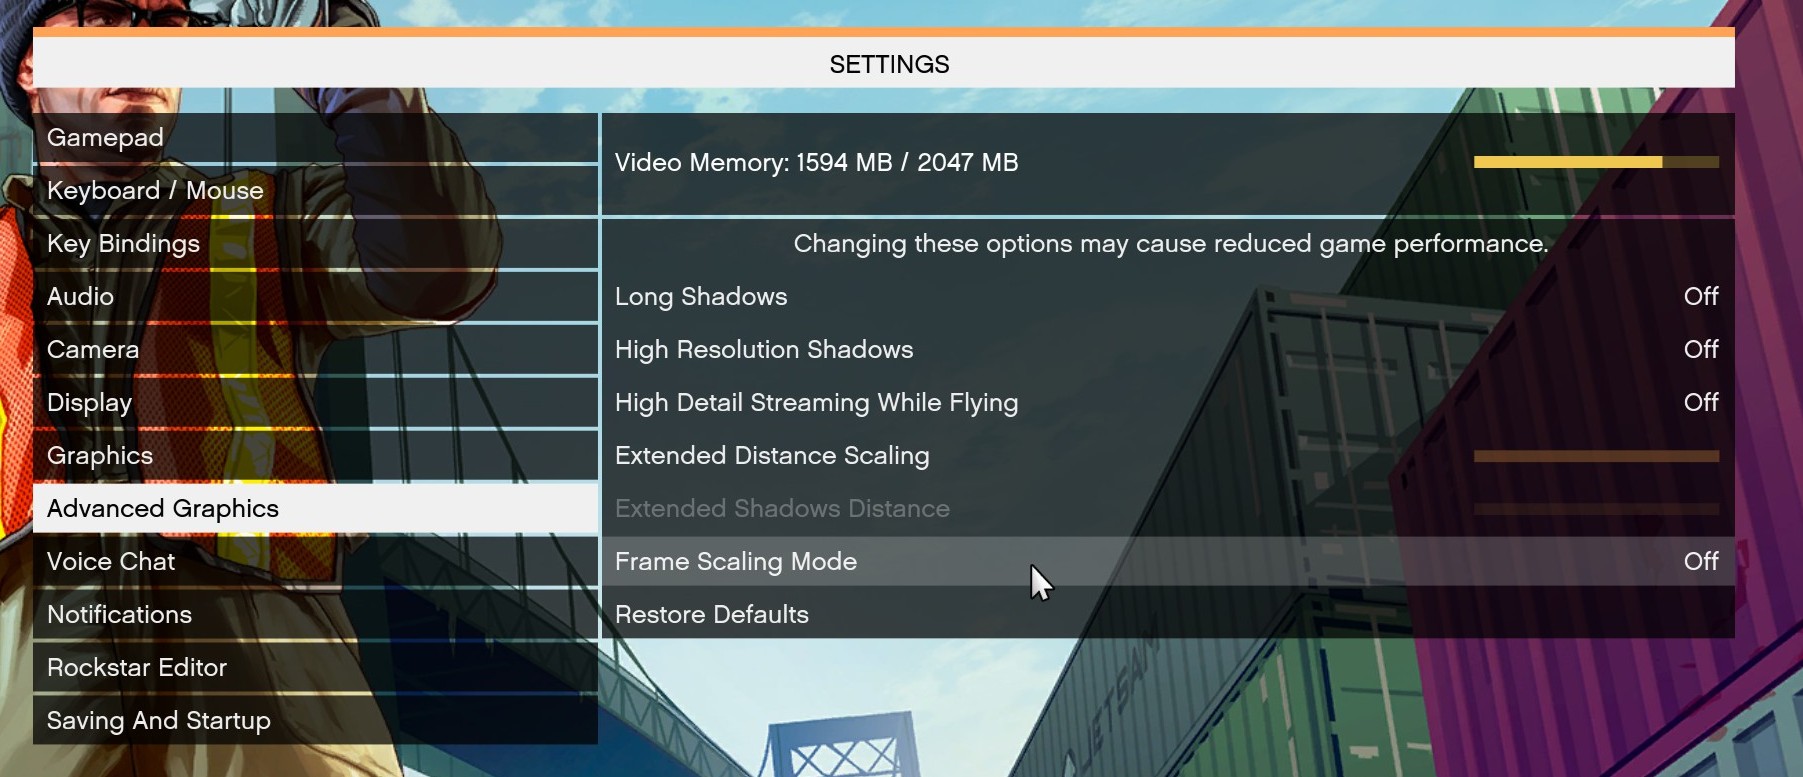
There are no presets for the graphics options on GTA, allowing the user to adjust options such as population density and distance scaling on sliders, but others such as texture/shadow/shader/water quality from Low to Very High. Other options include MSAA, soft shadows, post effects, shadow resolution and extended draw distance options. There is a handy option at the top which shows how much video memory the options are expected to consume, with obvious repercussions if a user requests more video memory than is present on the card (although there’s no obvious indication if you have a low-end GPU with lots of GPU memory, like an R7 240 4GB).
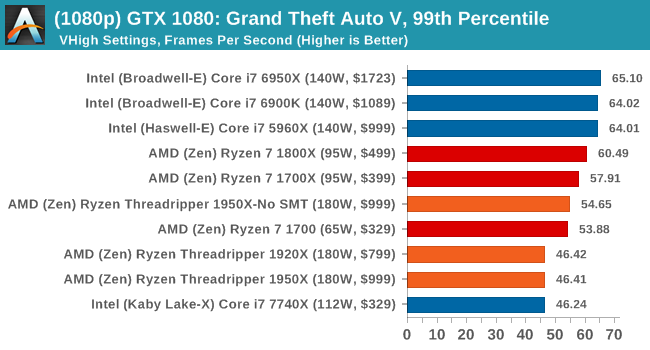
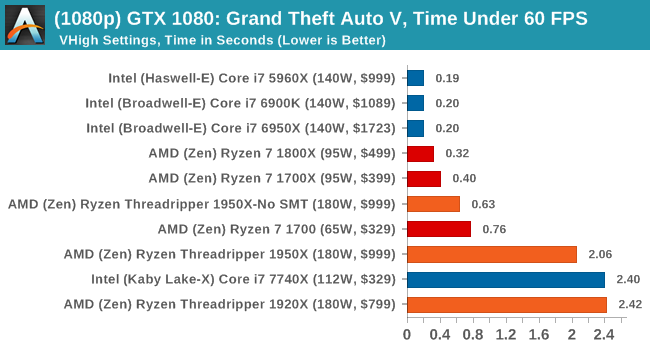
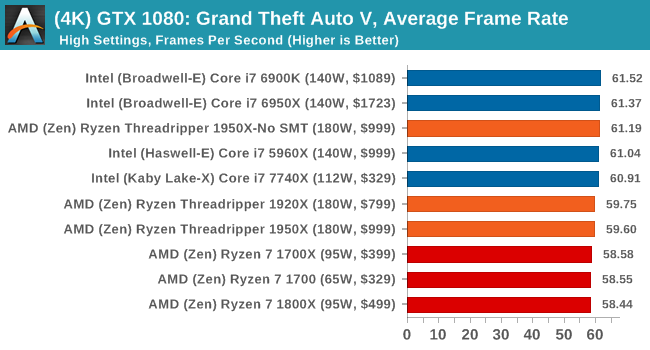
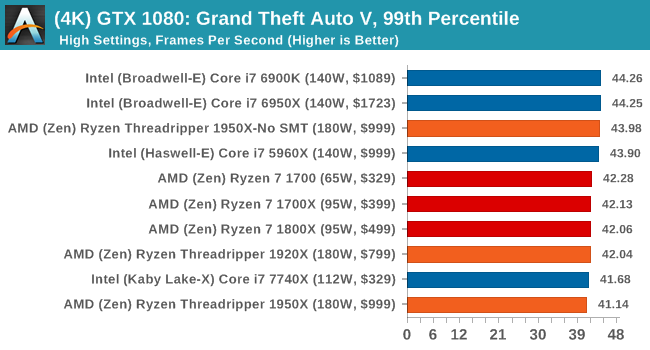
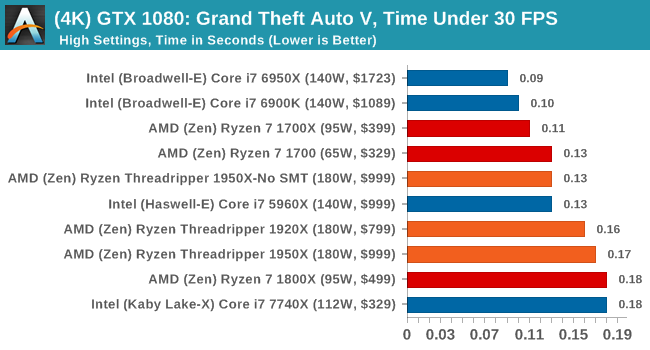
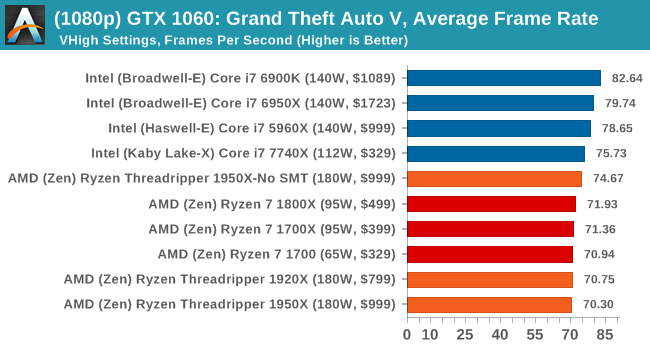
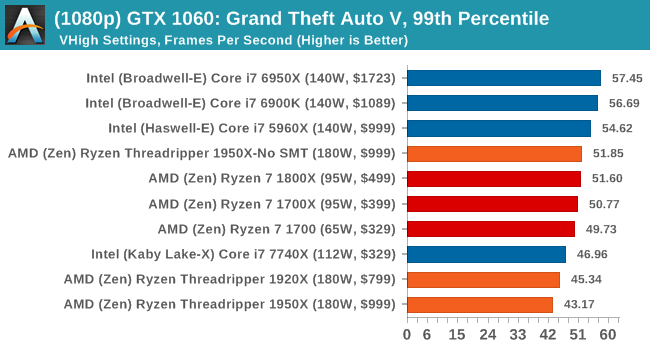
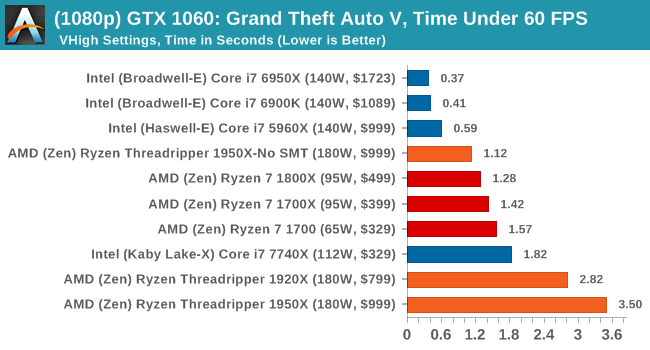
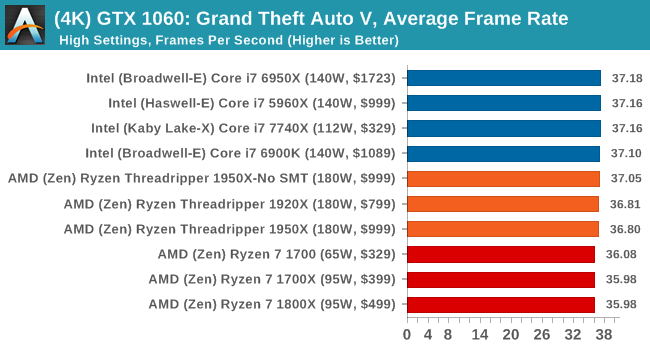
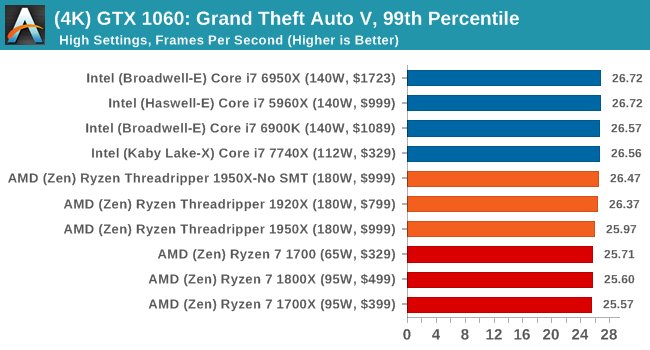
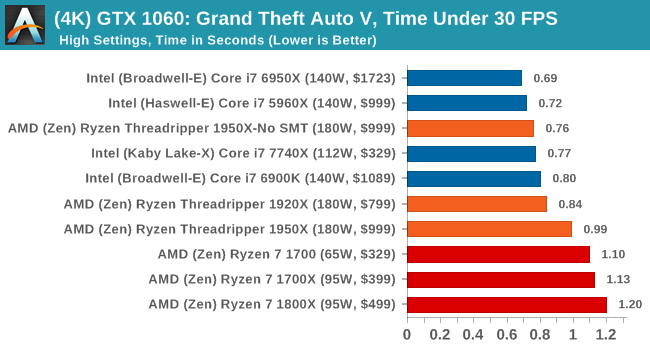
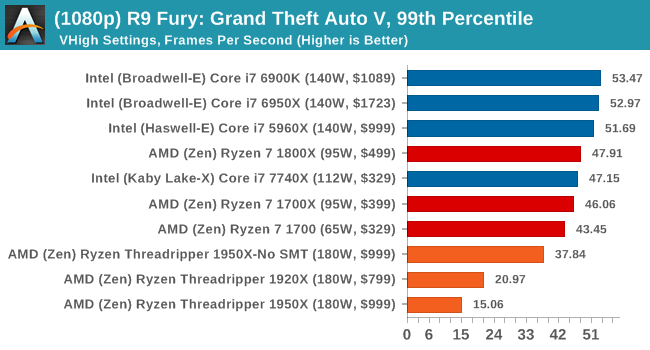
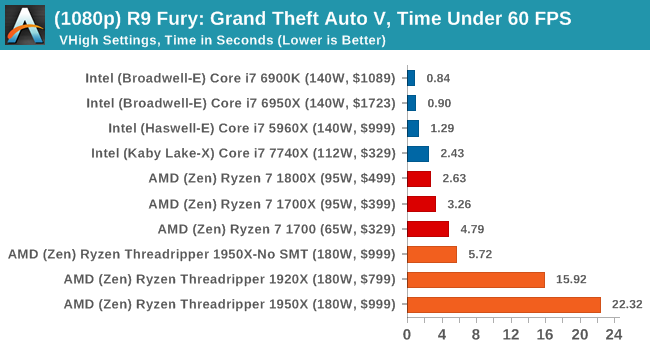
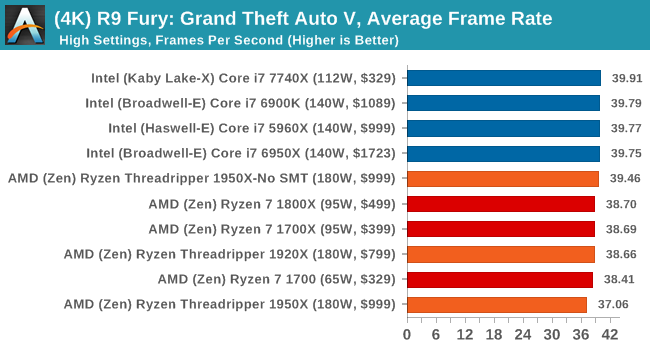
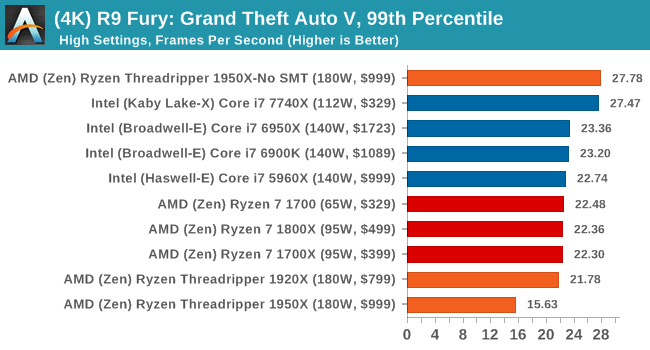
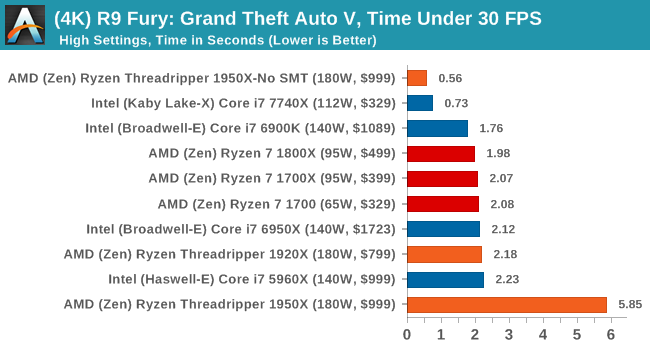
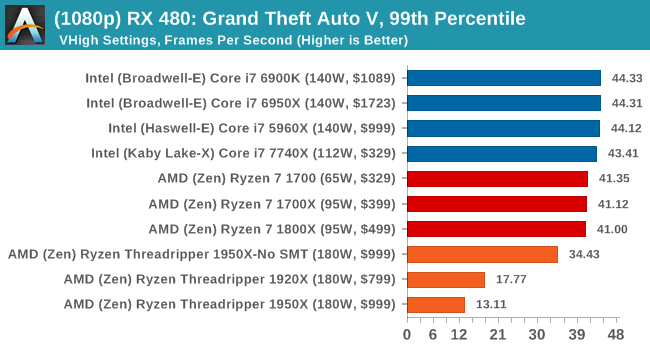
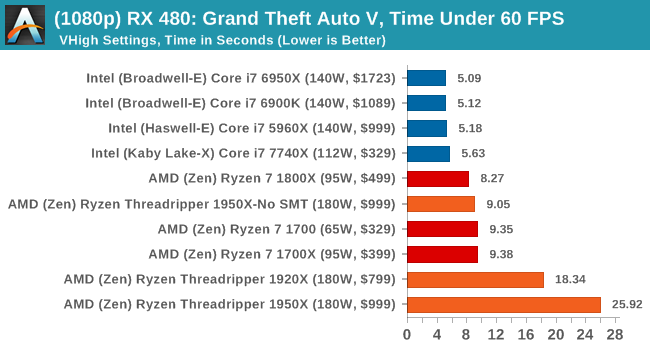
To that end, we run the benchmark at 1920x1080 using an average of Very High on the settings, and also at 4K using High on most of them. We take the average results of four runs, reporting frame rate averages, 99th percentiles, and our time under analysis.
All of our benchmark results can also be found in our benchmark engine, Bench.
MSI GTX 1080 Gaming 8G Performance
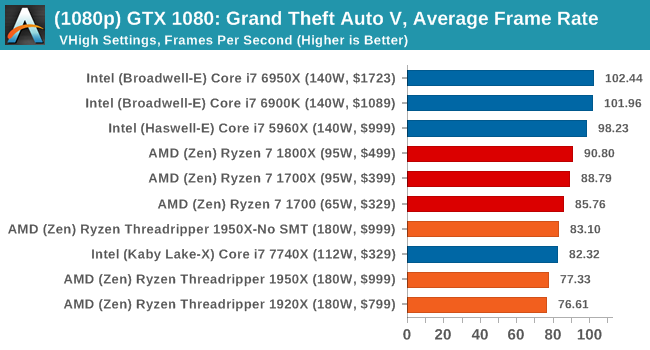
1080p
4K
ASUS GTX 1060 Strix 6G Performance
1080p
4K
Sapphire Nitro R9 Fury 4G Performance
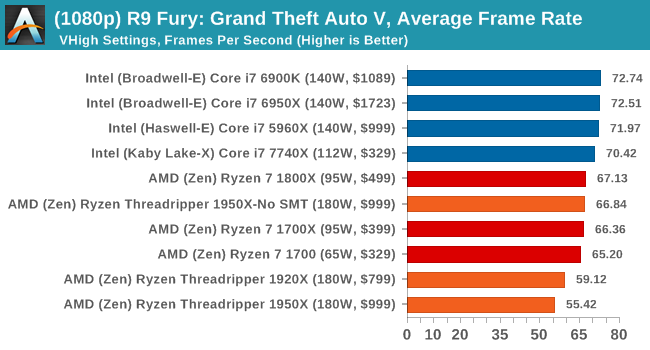
1080p
4K
Sapphire Nitro RX 480 8G Performance
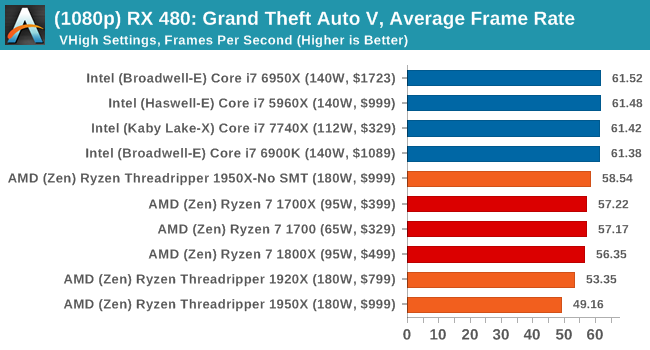
1080p
4K
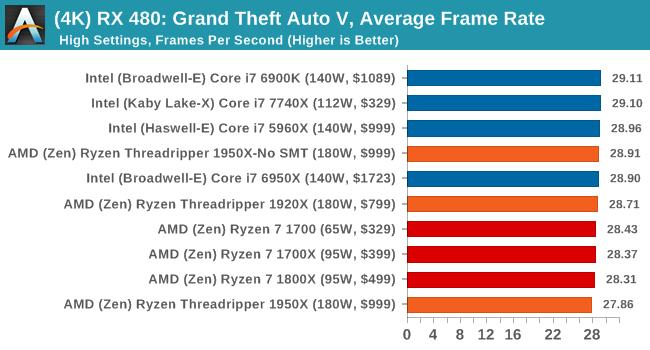
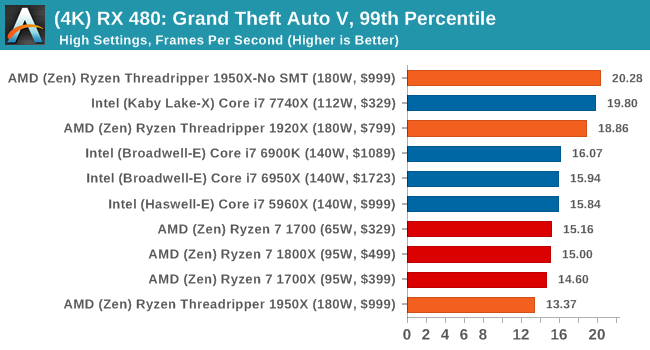
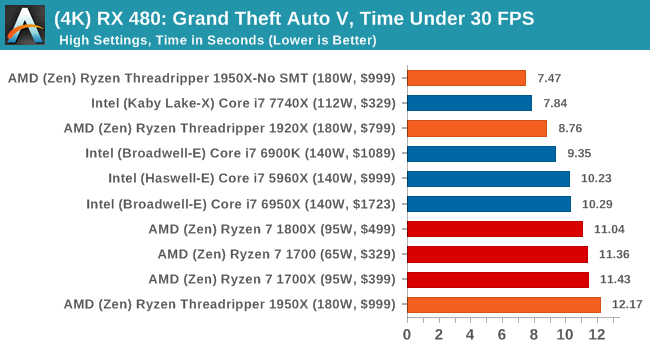
Depending on the CPU, for the most part Threadripper performs near to Ryzen or just below it.


347 Comments
View All Comments
BOBOSTRUMF - Friday, August 11, 2017 - link
Actually Intel's 140 can consume more than 210 if You want the top unrestricted performance limited. Read tomshardware reviewFiliprino - Thursday, August 10, 2017 - link
How comes WinRAR is faster with the 10 core Broadwell than with the 10 core Skylake?What did they change on Cinebench going from 10 to 11.5? Threadripper is the faster CPU in Cinebench 10, but in the newer one it is not. Then again Cinebench 15 shows TR as the faster CPU. Is this benchmark reliable?
How comes Chromium compilation is so slow? Others have pointed out they get much better scaling (linear speedup). That makes sense because compilation basically consists in launching isolated processes (compiler instances). Is this related with the segfaulting problem under GNU/Linux systems?
For encoding I would start to use FFmpeg when benchmarking so many cores. In my brain lies a memory of FFmpeg being faster than Handbrake for the same number of cores. Maybe the GUI loop interrupts the process in a performance-unfriendly way. Too much overhead. HPC workloads can suffer even from the network driver having too many interrupts (hence, Linux tickless configuration).
I have read SYSMARK Results and I find strange that TR media results are slower than data, being TR slower than Intel in media and faster than Intel in data. Isn't SYSMARK from BAPCo (http://www.pcworld.com/article/3023373/hardware/am... You already point it out on the article, sorry.
How comes R9 Fury in Shadow of Mordor has AMD and Intel CPUs running consistently at two different frame rates (~95 vs ~103)?
The same but with the GTX 1080. Both cases happen regardless of the Intel architecture (Haswell, Broadwell and Skylake all have the same FPS value).
What happens with NVIDIA driver on Rocket League? Bad caching algorithm (TR has more cores/threads -> more cache available to store GPU command data)? You say you had issues but, what are your thoughts?
How comes GTA V has those Under 60 and 30 FPS graphs knowing that the game is available for PS4 and XBox One (it has been already optimized for two CCX CPU, at least there is a version for that case)? Nevertheless, with NVIDIA cards, 2 seconds out of 90 is not that much.
What I can think is that all these benchmarks are programmed using threading libraries from the "good old times" due to bad scaling. And in some cases there is architecture-specific targeted code. I also include in my conception the small dataset being used. I also would not make a case out of a benchmark programmed with code having false sharing (¡:O!)
Currently for gaming, it seems that the easiest way is to have a Virtual Machine with PCIe passthrough pinned to one of the MCM dies.
As a suggestion to Anandtech, I would like to see more free (libre) software being used to measure CPU performance, compiling the benchmarks from source against the target CPU architecture. Something like Phoronix. Maybe you could use PTS (Phoronix Test Suite).
Filiprino - Thursday, August 10, 2017 - link
Positive things: ThreadRipper is under its TDP consumption. Intel is more power hungry. The Intel 16-core might go through the rough in power consumption.Good gaming performance. Intel is generally better, but TR still offers a beefy CPU for that too, losing a few frames only.
Strong rendering performance.
Strong video encoding performance.
When you talk about IPC, it would be useful to measure it with profiling tools, not just getting "points", "miliseconds" and "seconds".
Seeing how these benchmarks do not scale by much beyond 10 cores you might realize software has to get better.
Chad - Thursday, August 10, 2017 - link
Second ffmpeg test (pretty please!)mapesdhs - Thursday, August 10, 2017 - link
Ian, a query about the CPU Legacy Tests: why do you reckon does the 1920X beat both 1950X and 1950X-G for CB 11.5 MT, yet the latter win out for CB 10 MT? Is there a max-thread limit in V11.5? Filiprino asked much the same above.
"...and so losing half the threads in Game Mode might actually be a detriment to a workstation implementation."
Isn't that the whole point though? For most workstation tasks, don't use Game Mode. There will be exceptions of course, but in general...
Btw, where's C-ray? ;)
Ian.
Da W - Thursday, August 10, 2017 - link
ALL OF YOU COMPLAINERS: START A TECH REVIEW WEBSITE YOURSELVES AND STFU!hansmuff - Thursday, August 10, 2017 - link
Don't read the comments. Also, a lot of the "complaints" are read by Ryan and he actually addresses them and his articles improve as a result of criticism. He's never been bad, but you can see an ascension in quality over time, along with his partaking in critical commentary.IOW, we don't really need a referee.
hansmuff - Thursday, August 10, 2017 - link
And of course I mean Ian, not Ryan.mapesdhs - Friday, August 11, 2017 - link
It is great that he replies at all, and does so to quite a lot of the posts too.Kepe - Thursday, August 10, 2017 - link
Wait a second, according to AMD and all the other articles about the 1950X and Game Mode, game mode disables all the physical cores of one of the CPU clusters and leaves SMT on, so you get 8 cores and 16 threads. It doesn't just turn off SMT for a 16 core / 16 thread setup.AMD's info here: https://community.amd.com/community/gaming/blog/20...