The AMD Ryzen Threadripper 1950X and 1920X Review: CPUs on Steroids
by Ian Cutress on August 10, 2017 9:00 AM ESTAshes of the Singularity Escalation
Seen as the holy child of DirectX12, Ashes of the Singularity (AoTS, or just Ashes) has been the first title to actively go explore as many of DirectX12s features as it possibly can. Stardock, the developer behind the Nitrous engine which powers the game, has ensured that the real-time strategy title takes advantage of multiple cores and multiple graphics cards, in as many configurations as possible.

As a real-time strategy title, Ashes is all about responsiveness during both wide open shots but also concentrated battles. With DirectX12 at the helm, the ability to implement more draw calls per second allows the engine to work with substantial unit depth and effects that other RTS titles had to rely on combined draw calls to achieve, making some combined unit structures ultimately very rigid.
Stardock clearly understand the importance of an in-game benchmark, ensuring that such a tool was available and capable from day one, especially with all the additional DX12 features used and being able to characterize how they affected the title for the developer was important. The in-game benchmark performs a four minute fixed seed battle environment with a variety of shots, and outputs a vast amount of data to analyze.
For our benchmark, we run a fixed v2.11 version of the game due to some peculiarities of the splash screen added after the merger with the standalone Escalation expansion, and have an automated tool to call the benchmark on the command line. (Prior to v2.11, the benchmark also supported 8K/16K testing, however v2.11 has odd behavior which nukes this.)
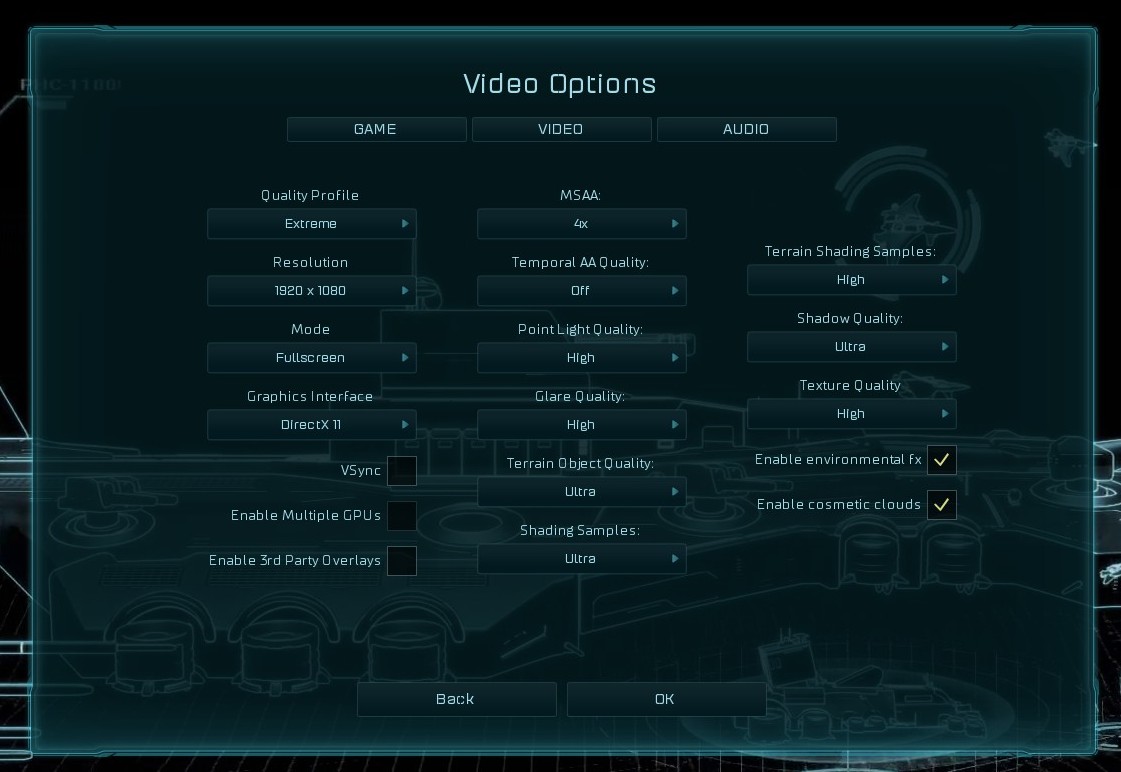
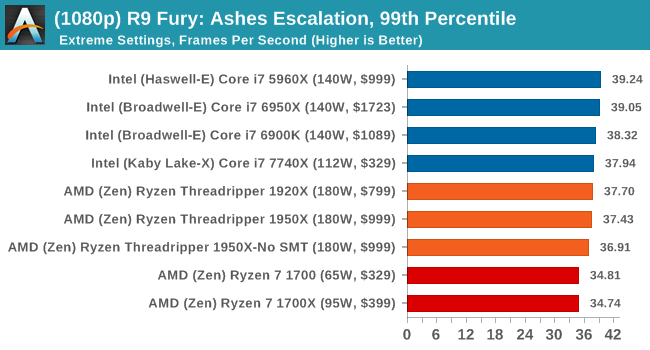
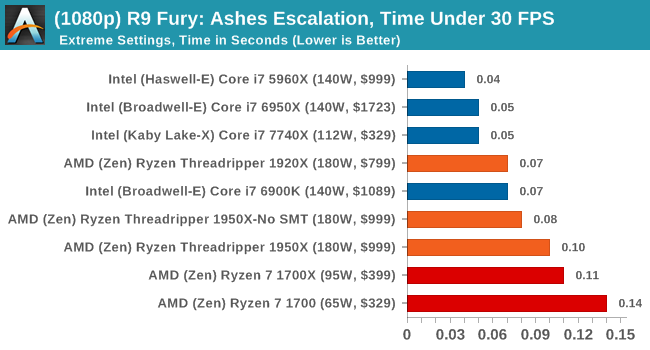
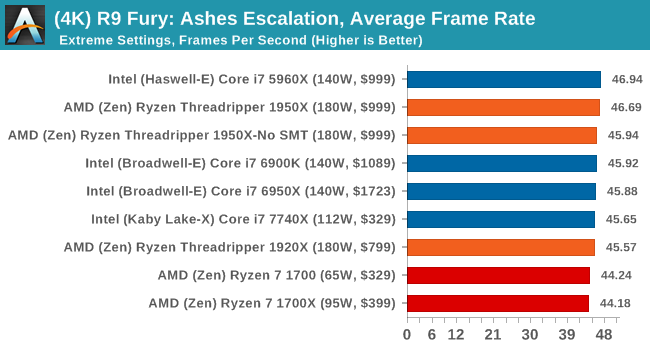
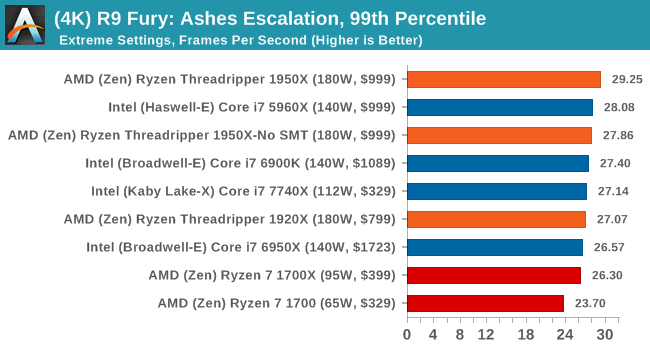
At both 1920x1080 and 4K resolutions, we run the same settings. Ashes has dropdown options for MSAA, Light Quality, Object Quality, Shading Samples, Shadow Quality, Textures, and separate options for the terrain. There are several presents, from Very Low to Extreme: we run our benchmarks at Extreme settings, and take the frame-time output for our average, percentile, and time under analysis.
All of our benchmark results can also be found in our benchmark engine, Bench.
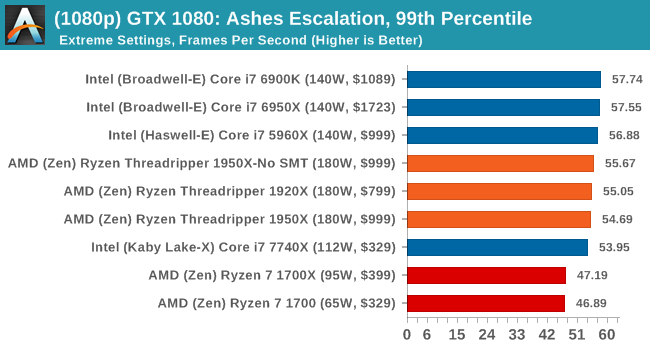
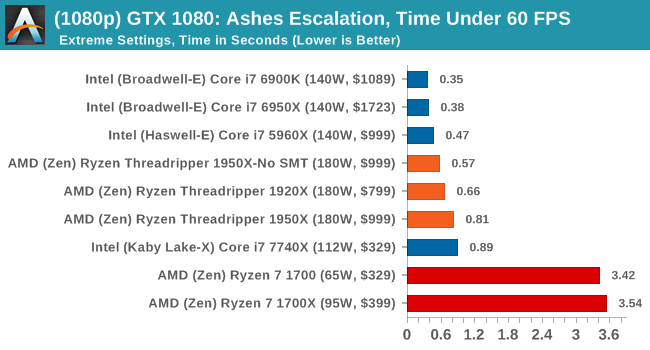
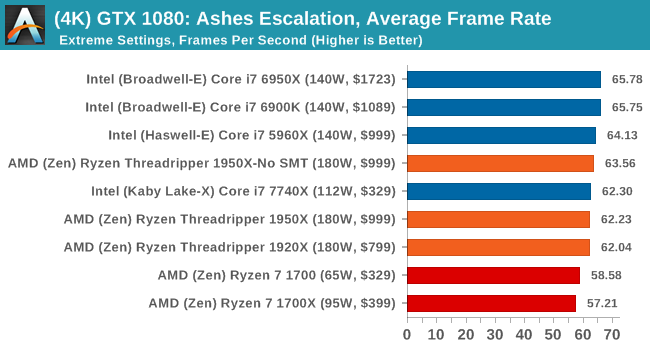
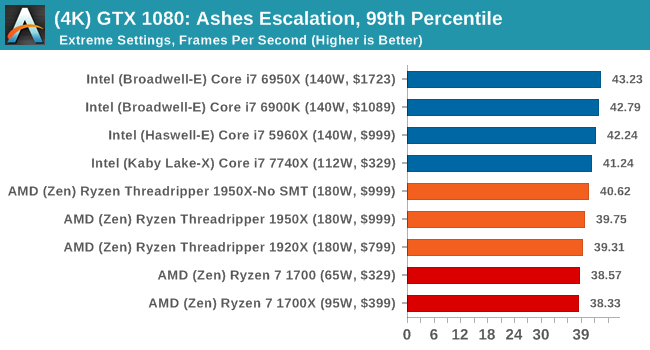
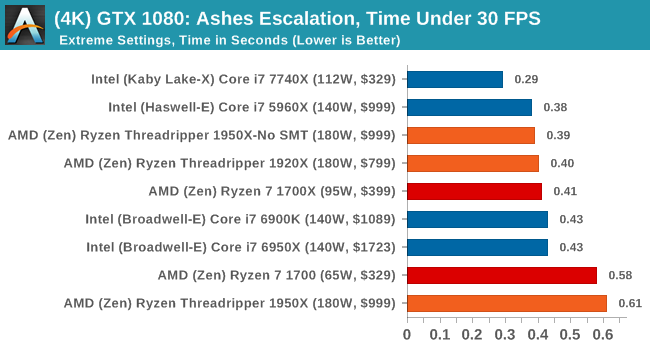
MSI GTX 1080 Gaming 8G Performance
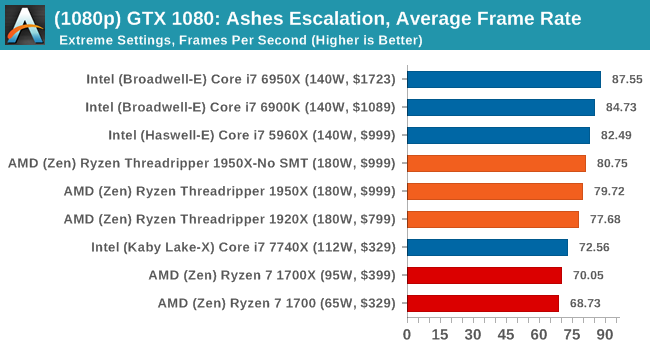
1080p
4K
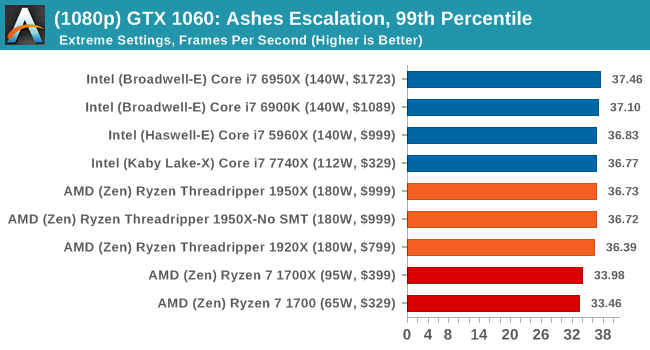
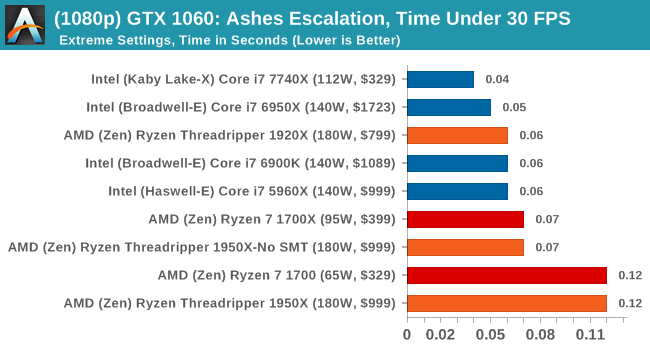
ASUS GTX 1060 Strix 6G Performance

1080p
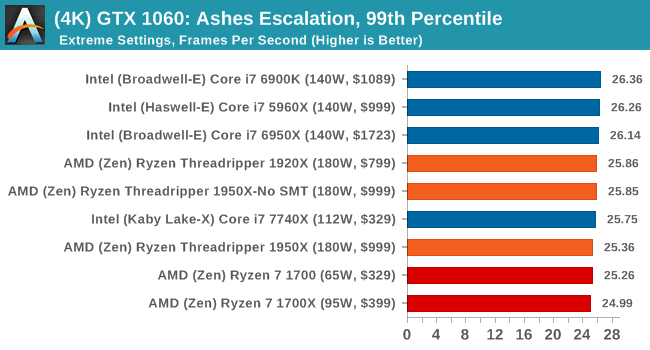
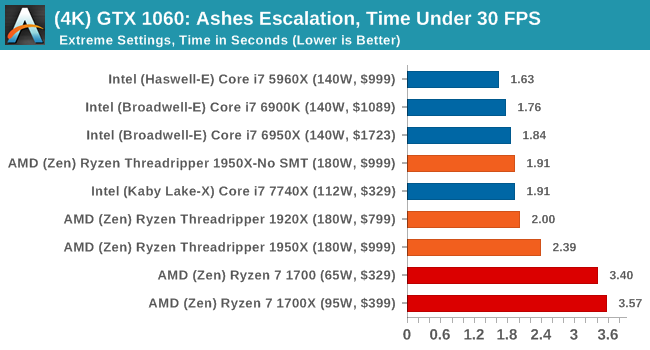
4K

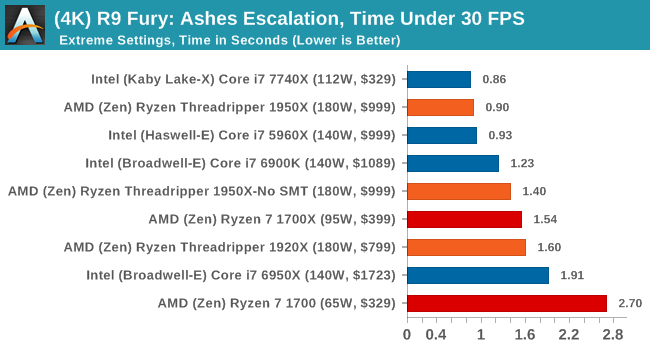
Sapphire Nitro R9 Fury 4G Performance
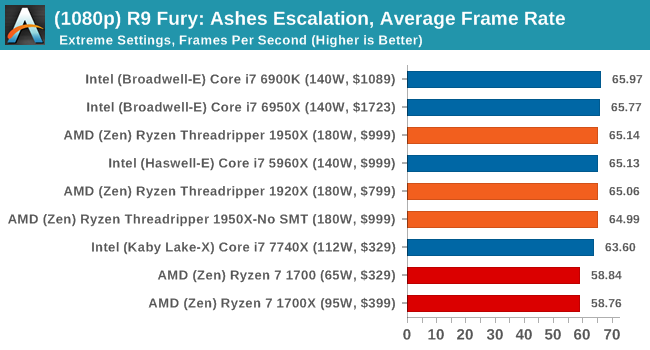
1080p
4K
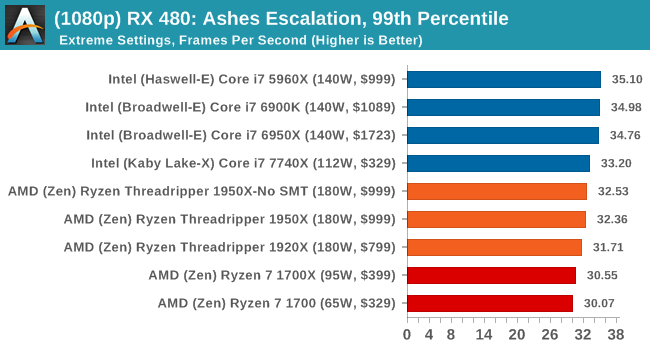
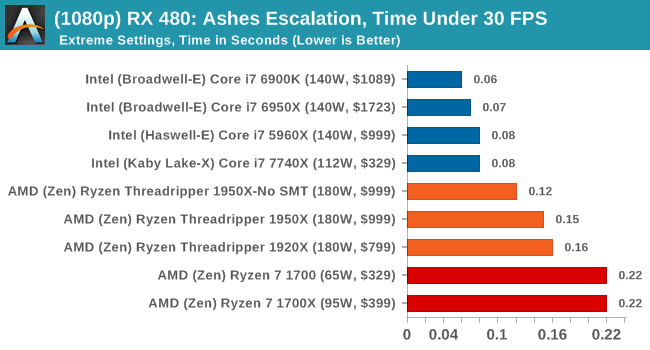
Sapphire Nitro RX 480 8G Performance
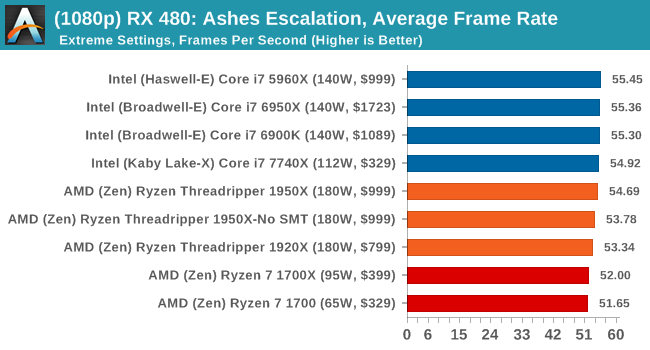
1080p
4K
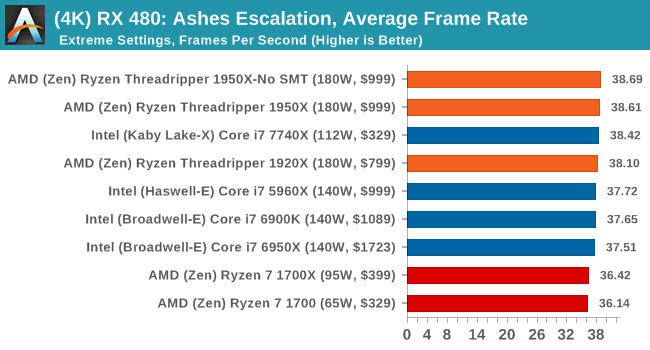
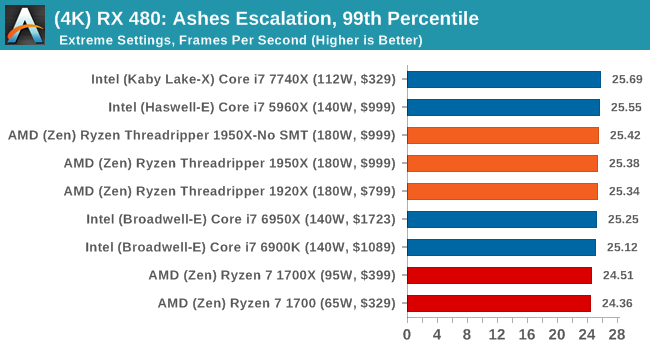
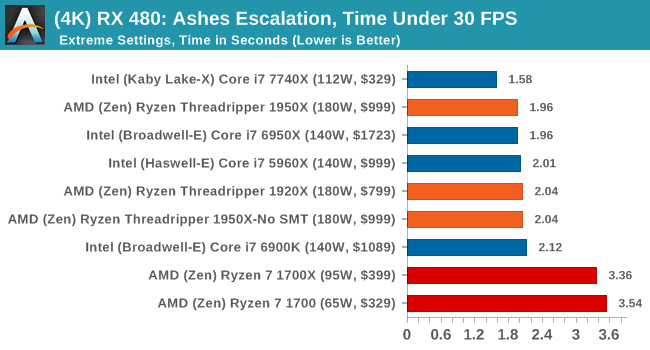
AMD gets in the mix a lot with these tests, and in a number of cases pulls ahead of the Ryzen chips in the Time Under analysis.


347 Comments
View All Comments
Lolimaster - Friday, August 11, 2017 - link
Adding useless singe thread benchs for people that will pay $600+ for many cores is plain stupidity like that useless open a pdf test.casperes1996 - Saturday, August 12, 2017 - link
Why do you bother replying to these, Ian? I love your enthusiasm about what you do, and am happy that you reply to comments, but as you state yourself, no matter what you say, you'll be called a shill on more than a weekly basis by either side no matter what you do. Intel shill, AMD shill, Apple shill, Nvidia shill and so on. There's no stopping it, because you just can't please the people who go into something wanting a specific result. Well, you can if you give them that result, but sometimes, facts aren't what you want them to be, and some people don't accept that.Cheers, mate
Diji1 - Thursday, August 10, 2017 - link
You sound like a crazy person.Notmyusualid - Saturday, August 12, 2017 - link
@ Diji1You are correct.
He is implying just because we want HEDT platforms / chips, that we care nothing for single-threaded performance.
He is a true AMD fan-boi, as you will see over time.
lordken - Thursday, August 10, 2017 - link
@Johan Steyn: while I agree with you that the Intel piece with PR slide at the top was a little bit lame, I even lolled at "most scalable" part (isn't something like "glued" zen the most scalable design?) I think this review is good and goes also around architecture etc., there were few instances during reading when it seemed odd wording or being unnecessarily polite toward intel's shortcoming/deficit but I cant even remember them now.Though I was surprised about power numbers, as Toms measured much higher W for 7900X , 160-200 and with TTF even up to 250-331 , but here 7800/7900x had only ~150W.
Also this sentence is odd
"All the Threadripper CPUs hit around 177W, just under the 180W TDP, while the Skylake-X CPUs move to their 140W TDP." move to their? They are above the TDP...why not state it clearly?
tamalero - Thursday, August 10, 2017 - link
Im sratching my head on power consumption as well. Almost all reviewers shows that the i9's consume more than threadripper.Could be the motherboard used?
Some used the Zenith and other reviewers used the ASROCK retail one.
smilingcrow - Thursday, August 10, 2017 - link
Power consumption can vary a lot depending on the type of task and the exact nature of that task.So you should expect a lot of variation across reviews.
Johan Steyn - Thursday, August 10, 2017 - link
The amount of tests on games in this review is unbalanced. Also read my reply to Ian.Extremely well stated: " unnecessarily polite toward Intel's shortcoming" Sometimes I think these guys think all are complete mindless drones.
carewolf - Thursday, August 10, 2017 - link
It has always been like this here. This was pretty neutral by Anandtech standards, they even admitted it when it was faster.Johan Steyn - Thursday, August 10, 2017 - link
Please read my response to Ian, I think you are not looking close enough to what is happening here.