The AMD Ryzen Threadripper 1950X and 1920X Review: CPUs on Steroids
by Ian Cutress on August 10, 2017 9:00 AM ESTCivilization 6
First up in our CPU gaming tests is Civilization 6. Originally penned by Sid Meier and his team, the Civ series of turn-based strategy games are a cult classic, and many an excuse for an all-nighter trying to get Gandhi to declare war on you due to an integer overflow. Truth be told I never actually played the first version, but every edition from the second to the sixth, including the fourth as voiced by the late Leonard Nimoy, it a game that is easy to pick up, but hard to master.

Benchmarking Civilization has always been somewhat of an oxymoron – for a turn based strategy game, the frame rate is not necessarily the important thing here and even in the right mood, something as low as 5 frames per second can be enough. With Civilization 6 however, Firaxis went hardcore on visual fidelity, trying to pull you into the game. As a result, Civilization can taxing on graphics and CPUs as we crank up the details, especially in DirectX 12.
Perhaps a more poignant benchmark would be during the late game, when in the older versions of Civilization it could take 20 minutes to cycle around the AI players before the human regained control. The new version of Civilization has an integrated ‘AI Benchmark’, although it is not currently part of our benchmark portfolio yet, due to technical reasons which we are trying to solve. Instead, we run the graphics test, which provides an example of a mid-game setup at our settings.

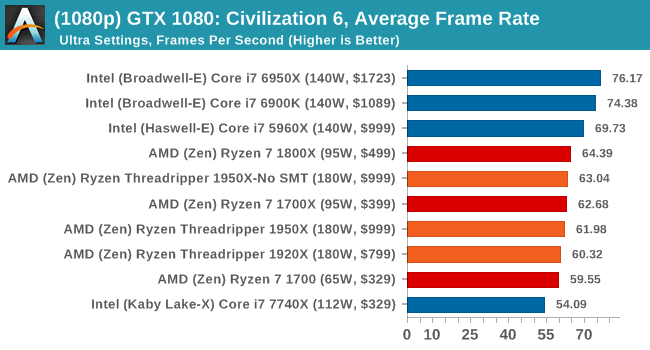
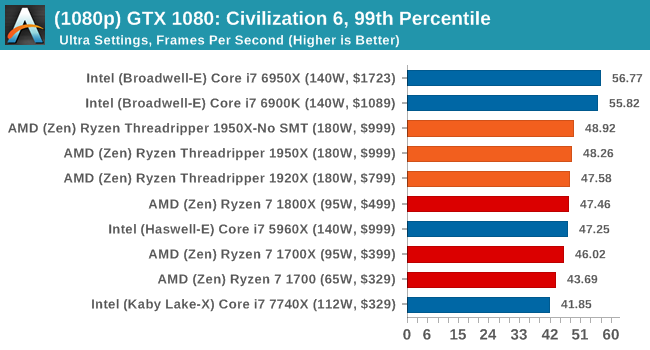
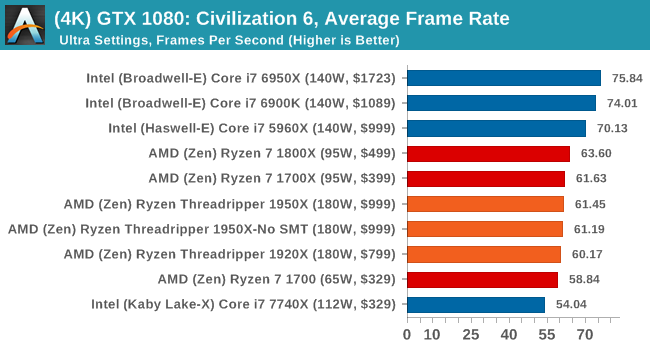
At both 1920x1080 and 4K resolutions, we run the same settings. Civilization 6 has sliders for MSAA, Performance Impact and Memory Impact. The latter two refer to detail and texture size respectively, and are rated between 0 (lowest) to 5 (extreme). We run our Civ6 benchmark in position four for performance (ultra) and 0 on memory, with MSAA set to 2x.
For reviews where we include 8K and 16K benchmarks (Civ6 allows us to benchmark extreme resolutions on any monitor) on our GTX 1080, we run the 8K tests similar to the 4K tests, but the 16K tests are set to the lowest option for Performance.
All of our benchmark results can also be found in our benchmark engine, Bench.
MSI GTX 1080 Gaming 8G Performance
1080p
4K
8K
16K
ASUS GTX 1060 Strix 6G Performance
1080p
4K
Sapphire Nitro R9 Fury 4G Performance
1080p
4K
Sapphire Nitro RX 480 8G Performance
1080p
4K
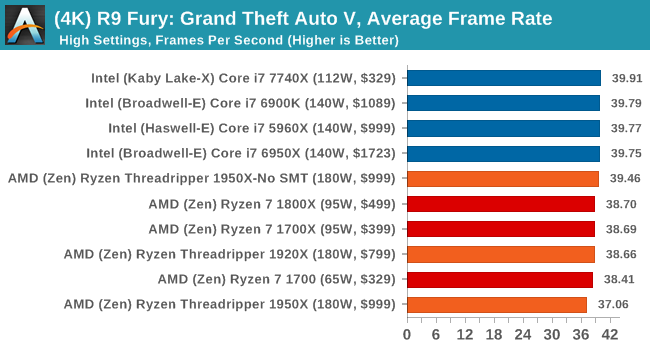
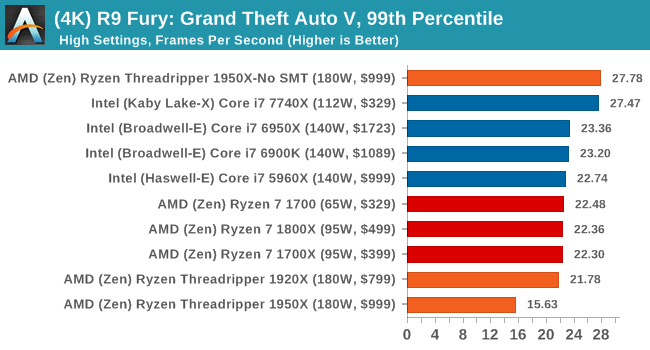
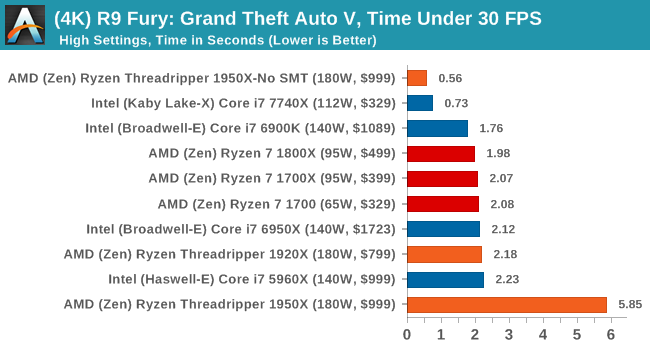
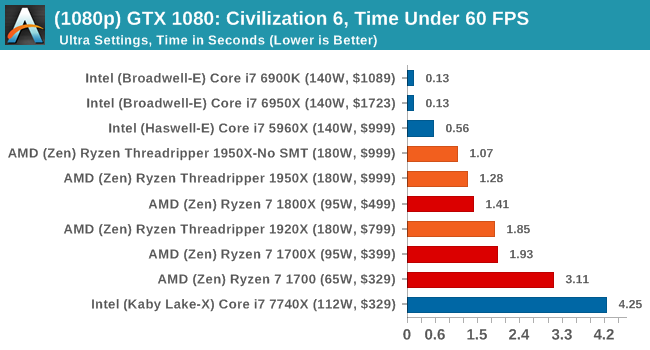
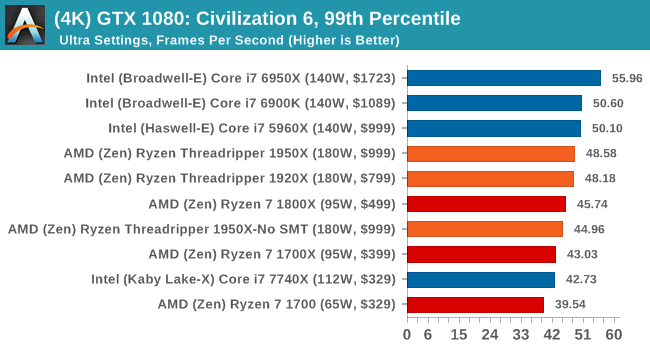
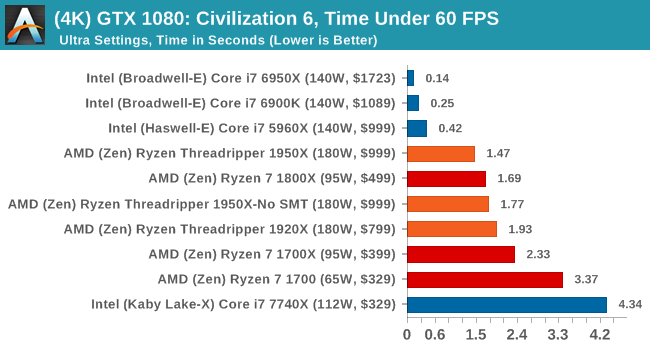
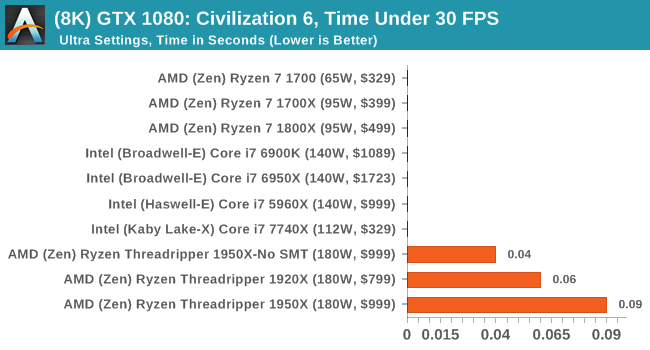
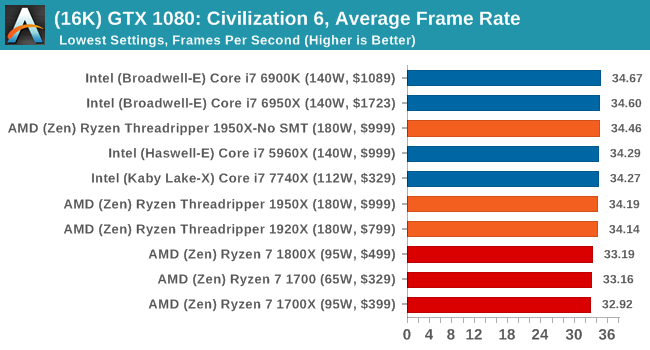
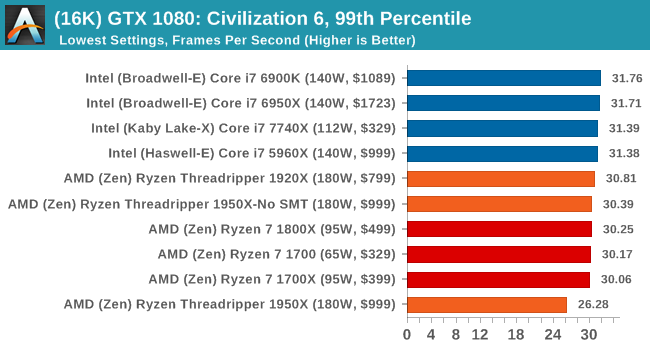
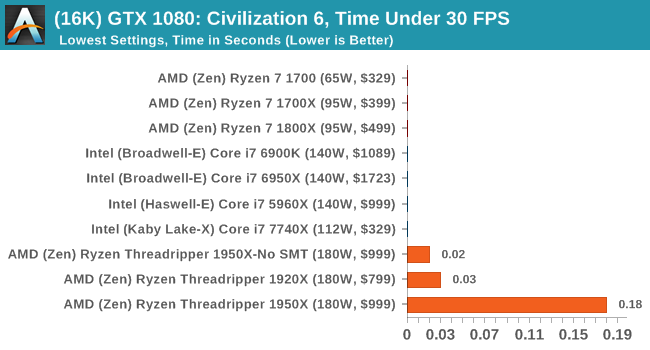
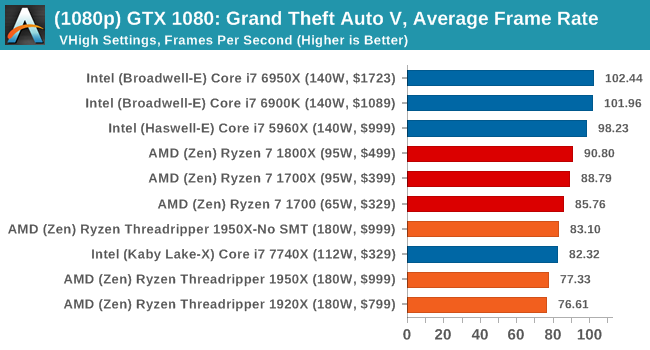
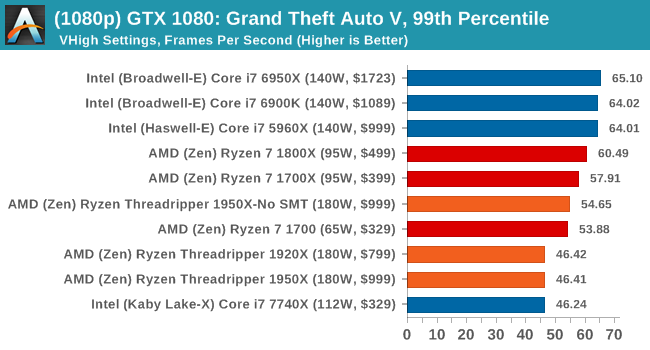
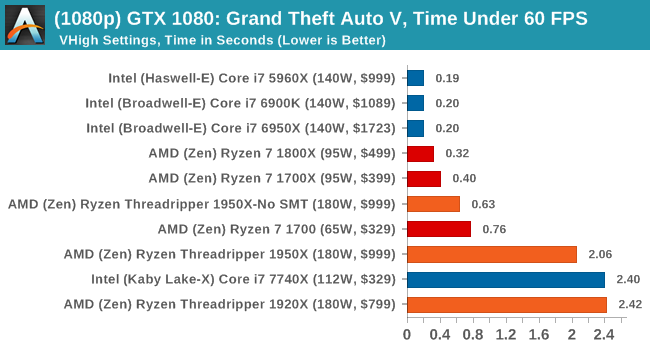
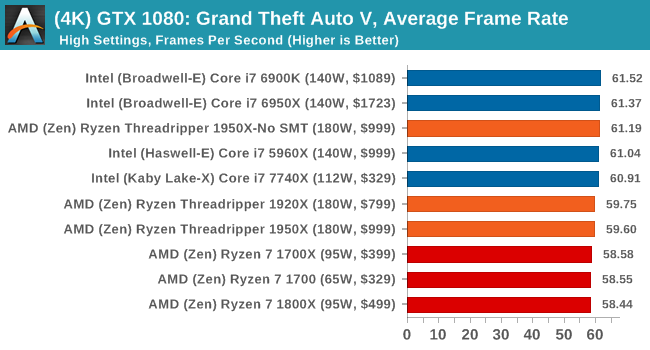
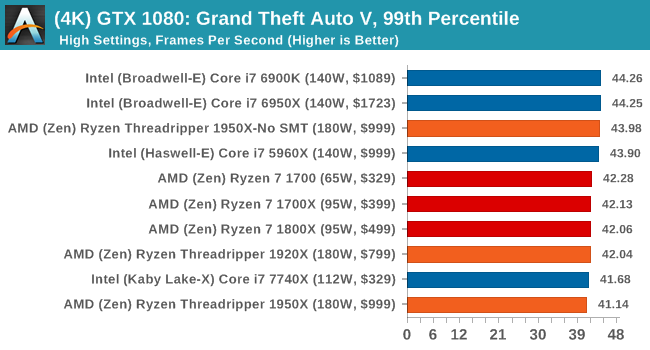
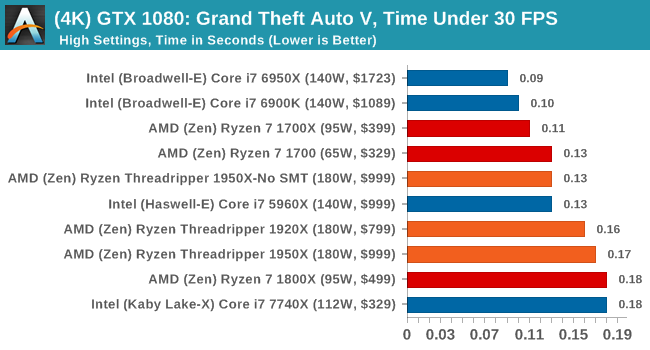
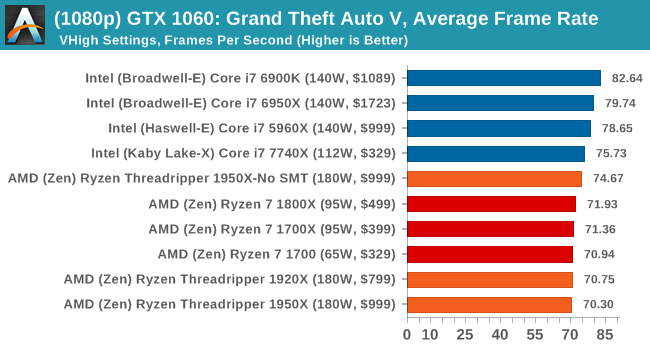
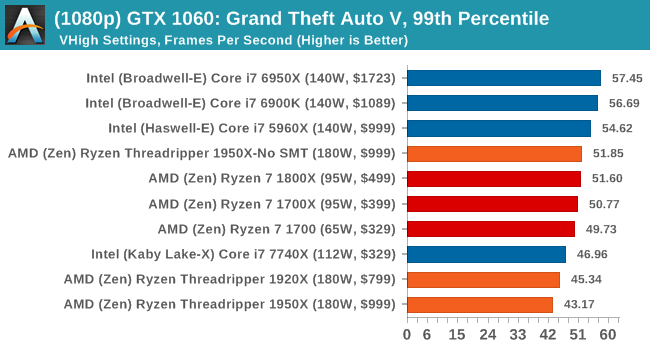
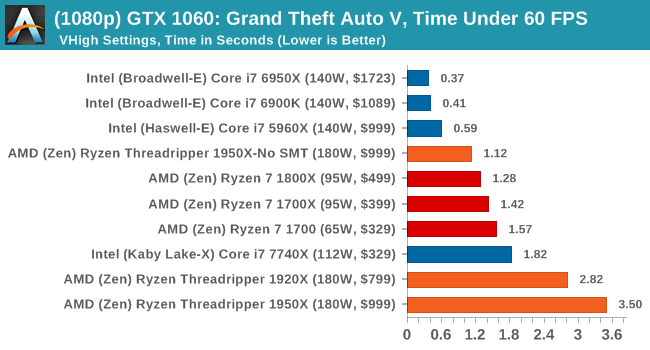
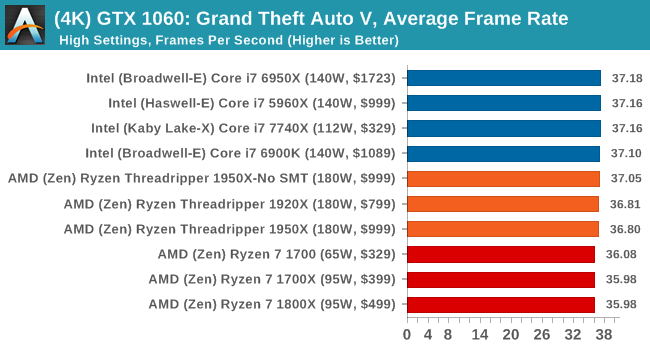
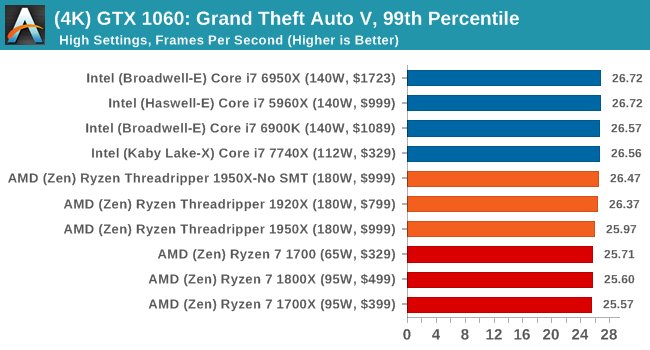
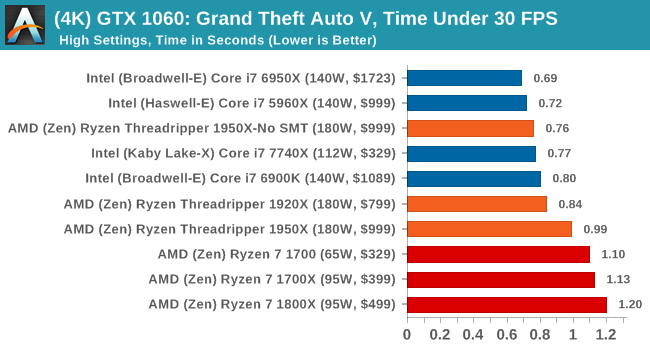
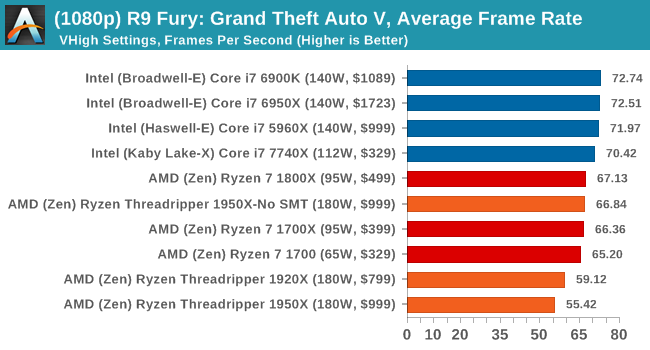
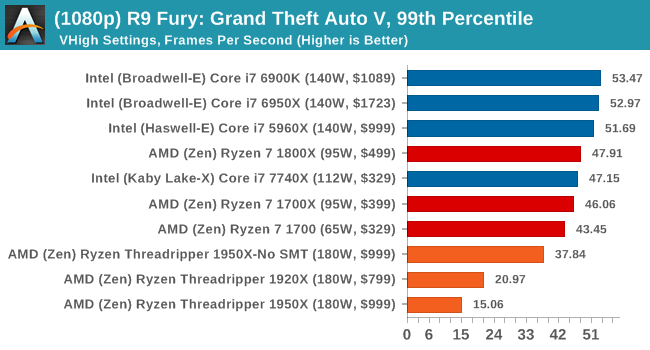
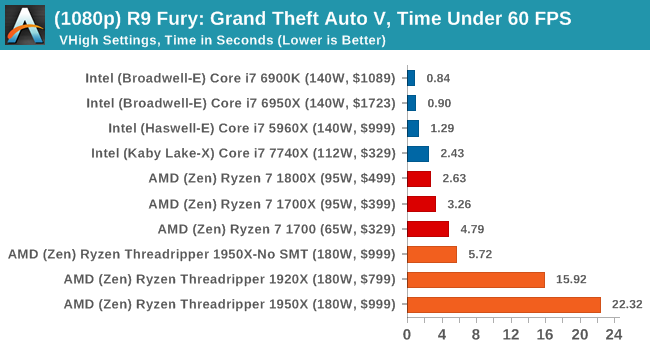
On the whole, the Threadripper CPUs perform as well as Ryzen does on most of the tests, although the Time Under analysis always seems to look worse for Threadripper.


347 Comments
View All Comments
Lolimaster - Friday, August 11, 2017 - link
Adding useless singe thread benchs for people that will pay $600+ for many cores is plain stupidity like that useless open a pdf test.casperes1996 - Saturday, August 12, 2017 - link
Why do you bother replying to these, Ian? I love your enthusiasm about what you do, and am happy that you reply to comments, but as you state yourself, no matter what you say, you'll be called a shill on more than a weekly basis by either side no matter what you do. Intel shill, AMD shill, Apple shill, Nvidia shill and so on. There's no stopping it, because you just can't please the people who go into something wanting a specific result. Well, you can if you give them that result, but sometimes, facts aren't what you want them to be, and some people don't accept that.Cheers, mate
Diji1 - Thursday, August 10, 2017 - link
You sound like a crazy person.Notmyusualid - Saturday, August 12, 2017 - link
@ Diji1You are correct.
He is implying just because we want HEDT platforms / chips, that we care nothing for single-threaded performance.
He is a true AMD fan-boi, as you will see over time.
lordken - Thursday, August 10, 2017 - link
@Johan Steyn: while I agree with you that the Intel piece with PR slide at the top was a little bit lame, I even lolled at "most scalable" part (isn't something like "glued" zen the most scalable design?) I think this review is good and goes also around architecture etc., there were few instances during reading when it seemed odd wording or being unnecessarily polite toward intel's shortcoming/deficit but I cant even remember them now.Though I was surprised about power numbers, as Toms measured much higher W for 7900X , 160-200 and with TTF even up to 250-331 , but here 7800/7900x had only ~150W.
Also this sentence is odd
"All the Threadripper CPUs hit around 177W, just under the 180W TDP, while the Skylake-X CPUs move to their 140W TDP." move to their? They are above the TDP...why not state it clearly?
tamalero - Thursday, August 10, 2017 - link
Im sratching my head on power consumption as well. Almost all reviewers shows that the i9's consume more than threadripper.Could be the motherboard used?
Some used the Zenith and other reviewers used the ASROCK retail one.
smilingcrow - Thursday, August 10, 2017 - link
Power consumption can vary a lot depending on the type of task and the exact nature of that task.So you should expect a lot of variation across reviews.
Johan Steyn - Thursday, August 10, 2017 - link
The amount of tests on games in this review is unbalanced. Also read my reply to Ian.Extremely well stated: " unnecessarily polite toward Intel's shortcoming" Sometimes I think these guys think all are complete mindless drones.
carewolf - Thursday, August 10, 2017 - link
It has always been like this here. This was pretty neutral by Anandtech standards, they even admitted it when it was faster.Johan Steyn - Thursday, August 10, 2017 - link
Please read my response to Ian, I think you are not looking close enough to what is happening here.