The AMD Ryzen Threadripper 1950X and 1920X Review: CPUs on Steroids
by Ian Cutress on August 10, 2017 9:00 AM ESTPower Consumption and Distribution
With Threadripper weighing in at a TDP of 180W, it comes across as a big jump from previous AMD platforms that hover at 45-95W, or Intel platforms that are sub-95W for mainstream and up to 140W for the high-end desktop. Let us not forget that AMD actually released a 220W TDP processor in the form of the FX-9590 running at 5 GHz, which was initially sold for 12+ months as a part purely for OEMs and system integrators in order to ensure that users had sufficient cooling. Eventually it was released as a consumer product, bundled with a beefy double width liquid cooler and a pair of fans. AMD sampled us a CPU, not before I went and spent £300 on one myself and reviewed it:
Nonetheless, 180W for AMD isn’t a new concept for TDP. For this review I’ve been using the liquid cooler AMD shipped with our FX-9590 sample, because it was designed to handle at least 220W. (AMD also sampled a 3x120 Thermaltake cooler with Threadripper, which would have taken a lot longer to organise on the test bed.)
For our power testing, we run Prime95 for at least 60 seconds then use software to poll the integrated power counters on the chip to get results. Depending on the CPU, we can get data for the full chip, per core, DRAM, uncore or integrated graphics – it relies on our tool being up to date or the registers for this data to be known. Normally this way of reading the power consumption can be a smidge inaccurate compared to more invasive methods, it is quick and scriptable, and it is this data that governs if and when a CPU is hitting power limits and needs to adjust fan speeds/frequencies to compensate.
To start, let us take the full package power consumption for Threadripper.
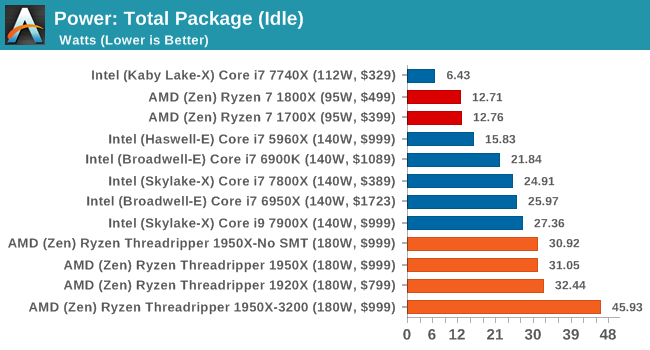
On the whole, Threadripper is a hungry chip even at idle. Most of the power here is being consumed by the memory controller and PCIe bus to keep the GPU ticking over with a static display. The fact that the 1950X running DDR4-3200 memory is pulling another 13W+ from the CPU shows how much of an impact the memory controller has on total power consumption. For all the chips, we’re recording sub 2W power draw from the cores.
When we load up the package with a single thread, it fires up the uncore/mesh as well as the memory and puts the system into its peak turbo state. Depending on the way the CPU is designed, this could fire up a single core or a bank of cores, so although in a bank of cores only one will be doing the work, it can still train power to be noticeable.
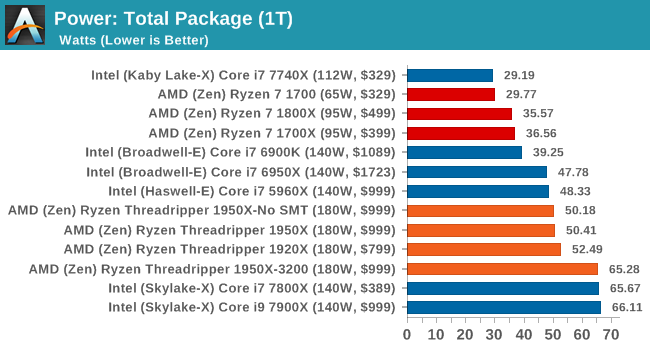
The results show all the Threadripper CPUs again hitting around the same mark, well above the Ryzen CPUs, and matching the 10C/8C parts from Broadwell-E and Haswell-E respectively. The 1950X running DDR4-3200 is still pulling an additional +13W, but interestingly the Skylake-X cores have jumped in power consumption to around this level. It would appear that the MoDe-X interconnect used in Skylake-X can also draw substantial power.
The next test is running the CPU will a full complement of threads for the design of the chip. This usually puts maximum strain on all the cores, the interconnect and the memory controller.
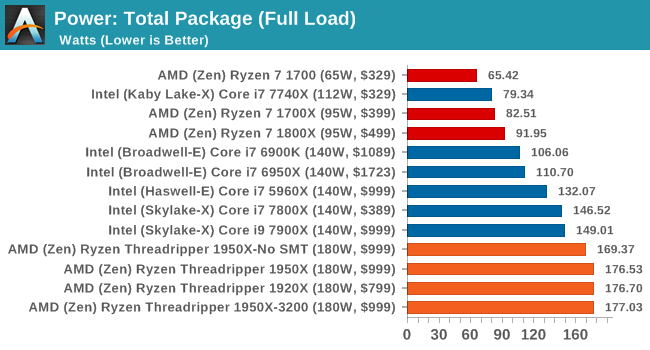
All the Threadripper CPUs hit around 177W, just under the 180W TDP, while the Skylake-X CPUs move to their 140W TDP. The 1950X in Game Mode seems to draw a little less power, which might be due to how the DRAM is being run in a NUMA environment.
One of the other graphs we have for some of the chips is the ‘cores-only’ power draw. At full load, we get an interesting plot:
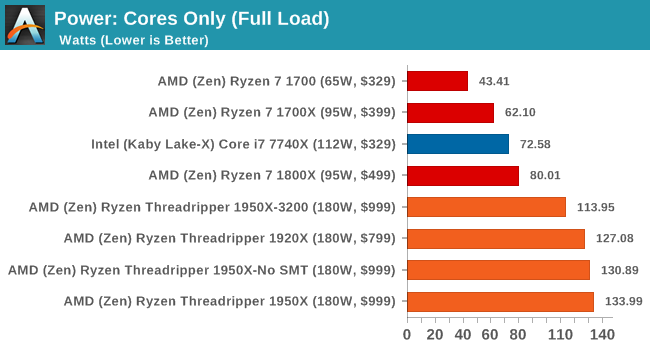
The key element to this graph is the 1950X running at DDR4-3200. Because the faster DRAM requires the memory controller to draw more power, it leaves less power for the CPU cores, potentially resulting in a lower turbo core frequency. So while the faster memory might guarantee faster performance in memory limited scenarios, the core frequency might end up lower given worse performance overall. It’s an interesting thought, so we plotted the per-core power for the 1950X at DDR4-2400 and DDR4-3200.
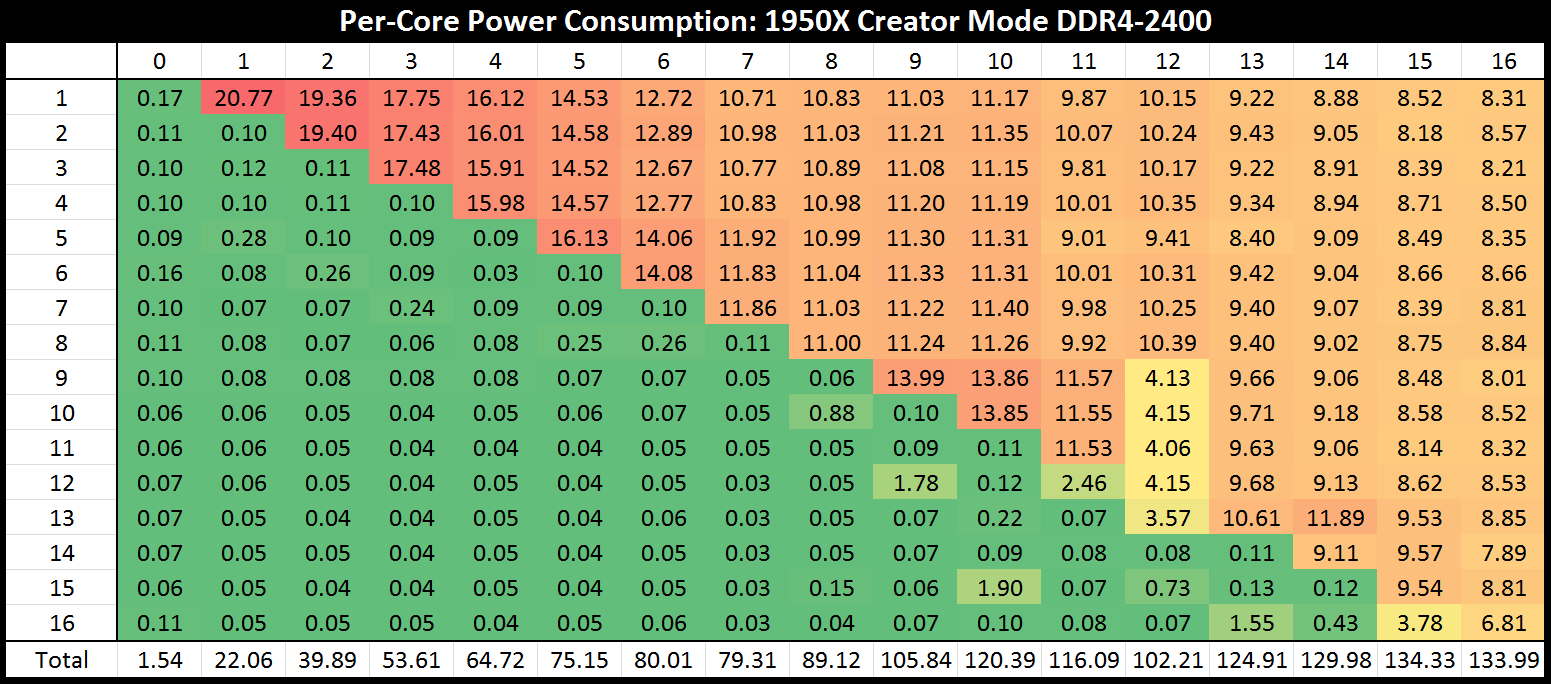
In this graph, the core number on the vertical axis is where the power measurement is taken, while from left to right is where we are loading up the cores, two threads at a time.
Initially we see that with two threads being loaded onto one core, that single core is drawing 20.77W. This quickly moves down to 19W, 17W, 16W to 11W by the time that half of the chip is loaded. At this point, with 8 cores loaded, the cores on their own are drawing 89W – if we add in the DRAM controllers, this would certainly be more than a Ryzen CPU. However, as we move past 10 cores loaded, something odd happens – the total power consumption of the cores drops from 120W to 116W to 102W when 24 threads are in play. This is indicated by the second silicon die drawing less power per core. It then ramps up again, with the full chip giving each core about 8.2W.
Moving onto the DDR4-3200 graph shows a similar scenario:
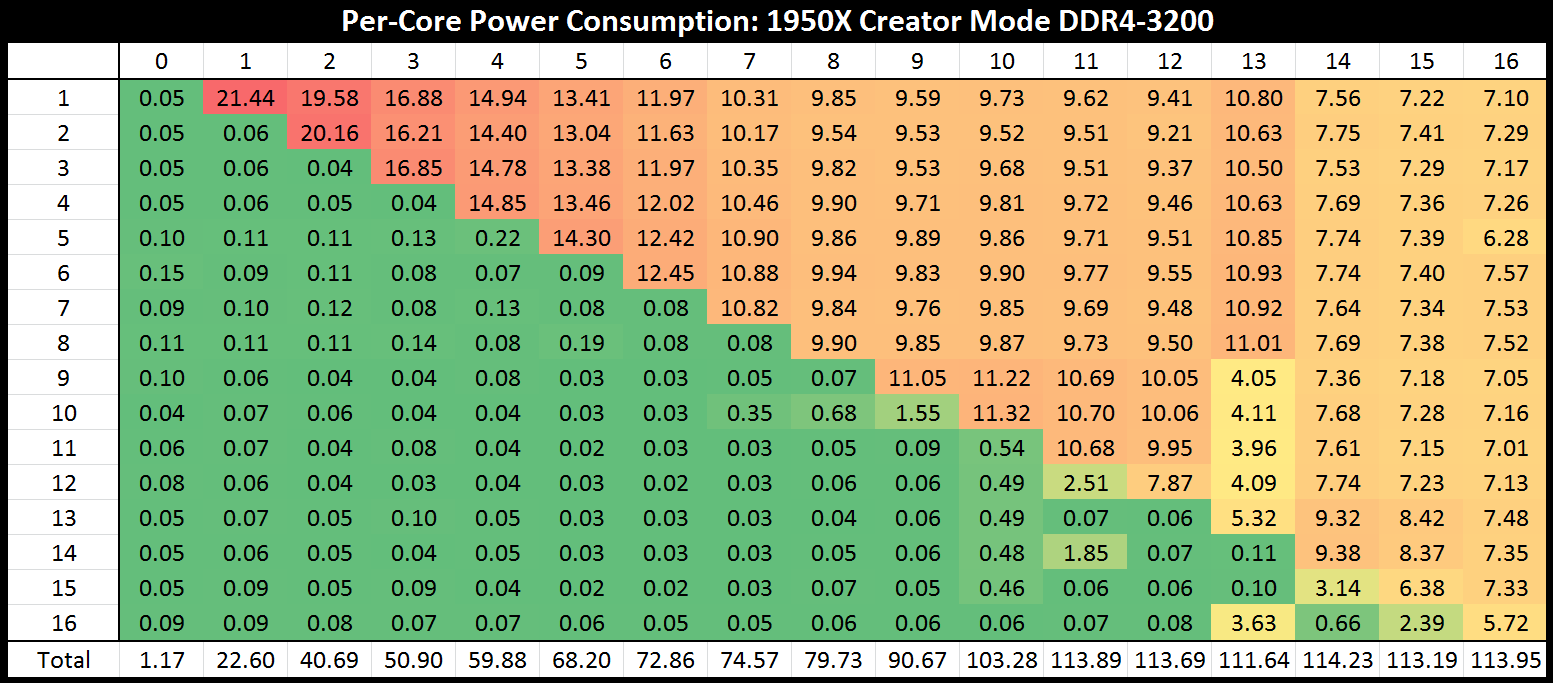
At first, the single core gets a big 21W, although as we load up the cores by the time it hits 4 cores/8 threads, the sub-15W per core at DDR4-3200 is being eclipsed by the 16W per core at DDR4-2400. Moving through we see a small wobble at 24-26 threads again, with the final tally putting only 114W onto the cores, 20W less than at DDR4-2400.
Some of the data for Game Mode did not come through properly, so we can’t draw many conclusions from what we have, although an interesting point should be made. In Game Mode, when a system requires a low number of threads, say anywhere from 2-8, because SMT is disabled these threads need to run on different CCXes. In Creator Mode, these threads would group into 1-4 cores over one CCX, and consume less power. At DDR4-2400, this means 65W in Creator mode for 8 threads (4 cores) compared to 89W in Game mode for 8 cores active.


347 Comments
View All Comments
Lolimaster - Friday, August 11, 2017 - link
A single 1950X destroyed 80% of the intel xeon lineup.Lolimaster - Friday, August 11, 2017 - link
Any cpu after nehalem perform enough at single thread except for software optimized too much for certain brands, like dolphin and intel.Lolimaster - Friday, August 11, 2017 - link
Specially when every cpu right now autoclocks to 4Ghz on ST tasks. Single thread is just an obsolete metric when just the most basic of tasks will use it, tasks the last thing you will worry is speed, maybe curse about that piece of c*rap not using 80% of you cpu resources.ZeroPointEF - Thursday, August 10, 2017 - link
I would love to see more VM benchmarking on these types of CPUs. I would also love to see how a desktop performs on top of a Server 2016 hypervisor with multiple servers (Windows and Linux) running on top of the same hypervisor.ZeroPointEF - Thursday, August 10, 2017 - link
I should have made it clear that I loved the review. Ian's reviews are always great!I would just like to see these types of things in addition. It seems like we are getting to a point where we can have our own home lab and a desktop all on one machine on top of a hypervisor, but this idea may be my own strange dream.
smilingcrow - Thursday, August 10, 2017 - link
And others would like to know how it works at video editing or as a DAW etc.To add a whole bunch of demanding benchmarks just for HEDT systems is a hell of a lot of work for little return for a site whose main focus is the mainstream.
Try looking at more specialised reviews.
johnnycanadian - Thursday, August 10, 2017 - link
This, please! My TR purchase is hinging on the performance of multiple VMWare VMs all running full-out at least 18 hours per day.Ian, I'd love to see some of your compute-intensive multi-core benches running on a Linux host with Linux-based VMWare VMs (OpenCV analysis, anyone? Send me that 1950x and I'll happily run SIFT and SURF analysis all day long for you :-). I was delighted by the non-gaming benchmarks shown first in this review and hope to see more professional benches on Anand. Leave the gamerkids to Tom's or HardOCP (or at least limit gaming benchmarks to hardware that is built for it): Anandtech has always been more about folks who make their living on HPDC, and I have nothing but the highest respect for the technical staff at this publication.
I don't give a monkey's about RGB lighting, tempered glass cases, 4k gaming or GTAV FPS. How machines like Threadripper perform in a HPC environment is going to keep AMD in this market, and I sincerely hope they prove to be viable.
mapesdhs - Thursday, August 10, 2017 - link
Yes, I was pleased to see the non-gaming tests presented first, makes a change, and at least a subtle nod to the larger intended market for TR.Ian.
pm9819 - Friday, August 18, 2017 - link
Your going to spend a $1000 on cpu but have no clue how it handles the tasks you need it for, smh. As a VMWare customer they will tell you which cpu has been certified to handle a specific tasked. You don't need a random website to tell you that.nitin213 - Thursday, August 10, 2017 - link
Hi IanIt's a great review but i do have some suggestions on the test suite. The test suite for this CPU was not materially different from test suites of many of the other desktop CPUs done earlier. I think it would be great to see some tests which explicitly put to use the multi-threaded capabilities and the insane IOs of the system to test, e.g server hosting with how many users being able to login, virtual machines, more productivity test suites when put together with a multi-GPU setup (running adobe creator or similar) etc. I think a combination of your epyc test suite and your high-end GPU test suite would probably be best suited for this.
Also, for the gaming benchmark, it seemed you had 1080, 1060, rx580 and rx480 GPUs. Not sure if these were being bottlenecked by GPU with differences in framerates being semantic and not necessarily a show of PC strength. Also, Civ 6 AI test suite would a great addition as that really stresses the CPU.
i completely understand that there is only so much that can be done in a limited timeframe typically made available for these reviews but would be great to see these tests in future iterations and updates.