The AMD Ryzen Threadripper 1950X and 1920X Review: CPUs on Steroids
by Ian Cutress on August 10, 2017 9:00 AM ESTRise of the Tomb Raider (1080p, 4K)
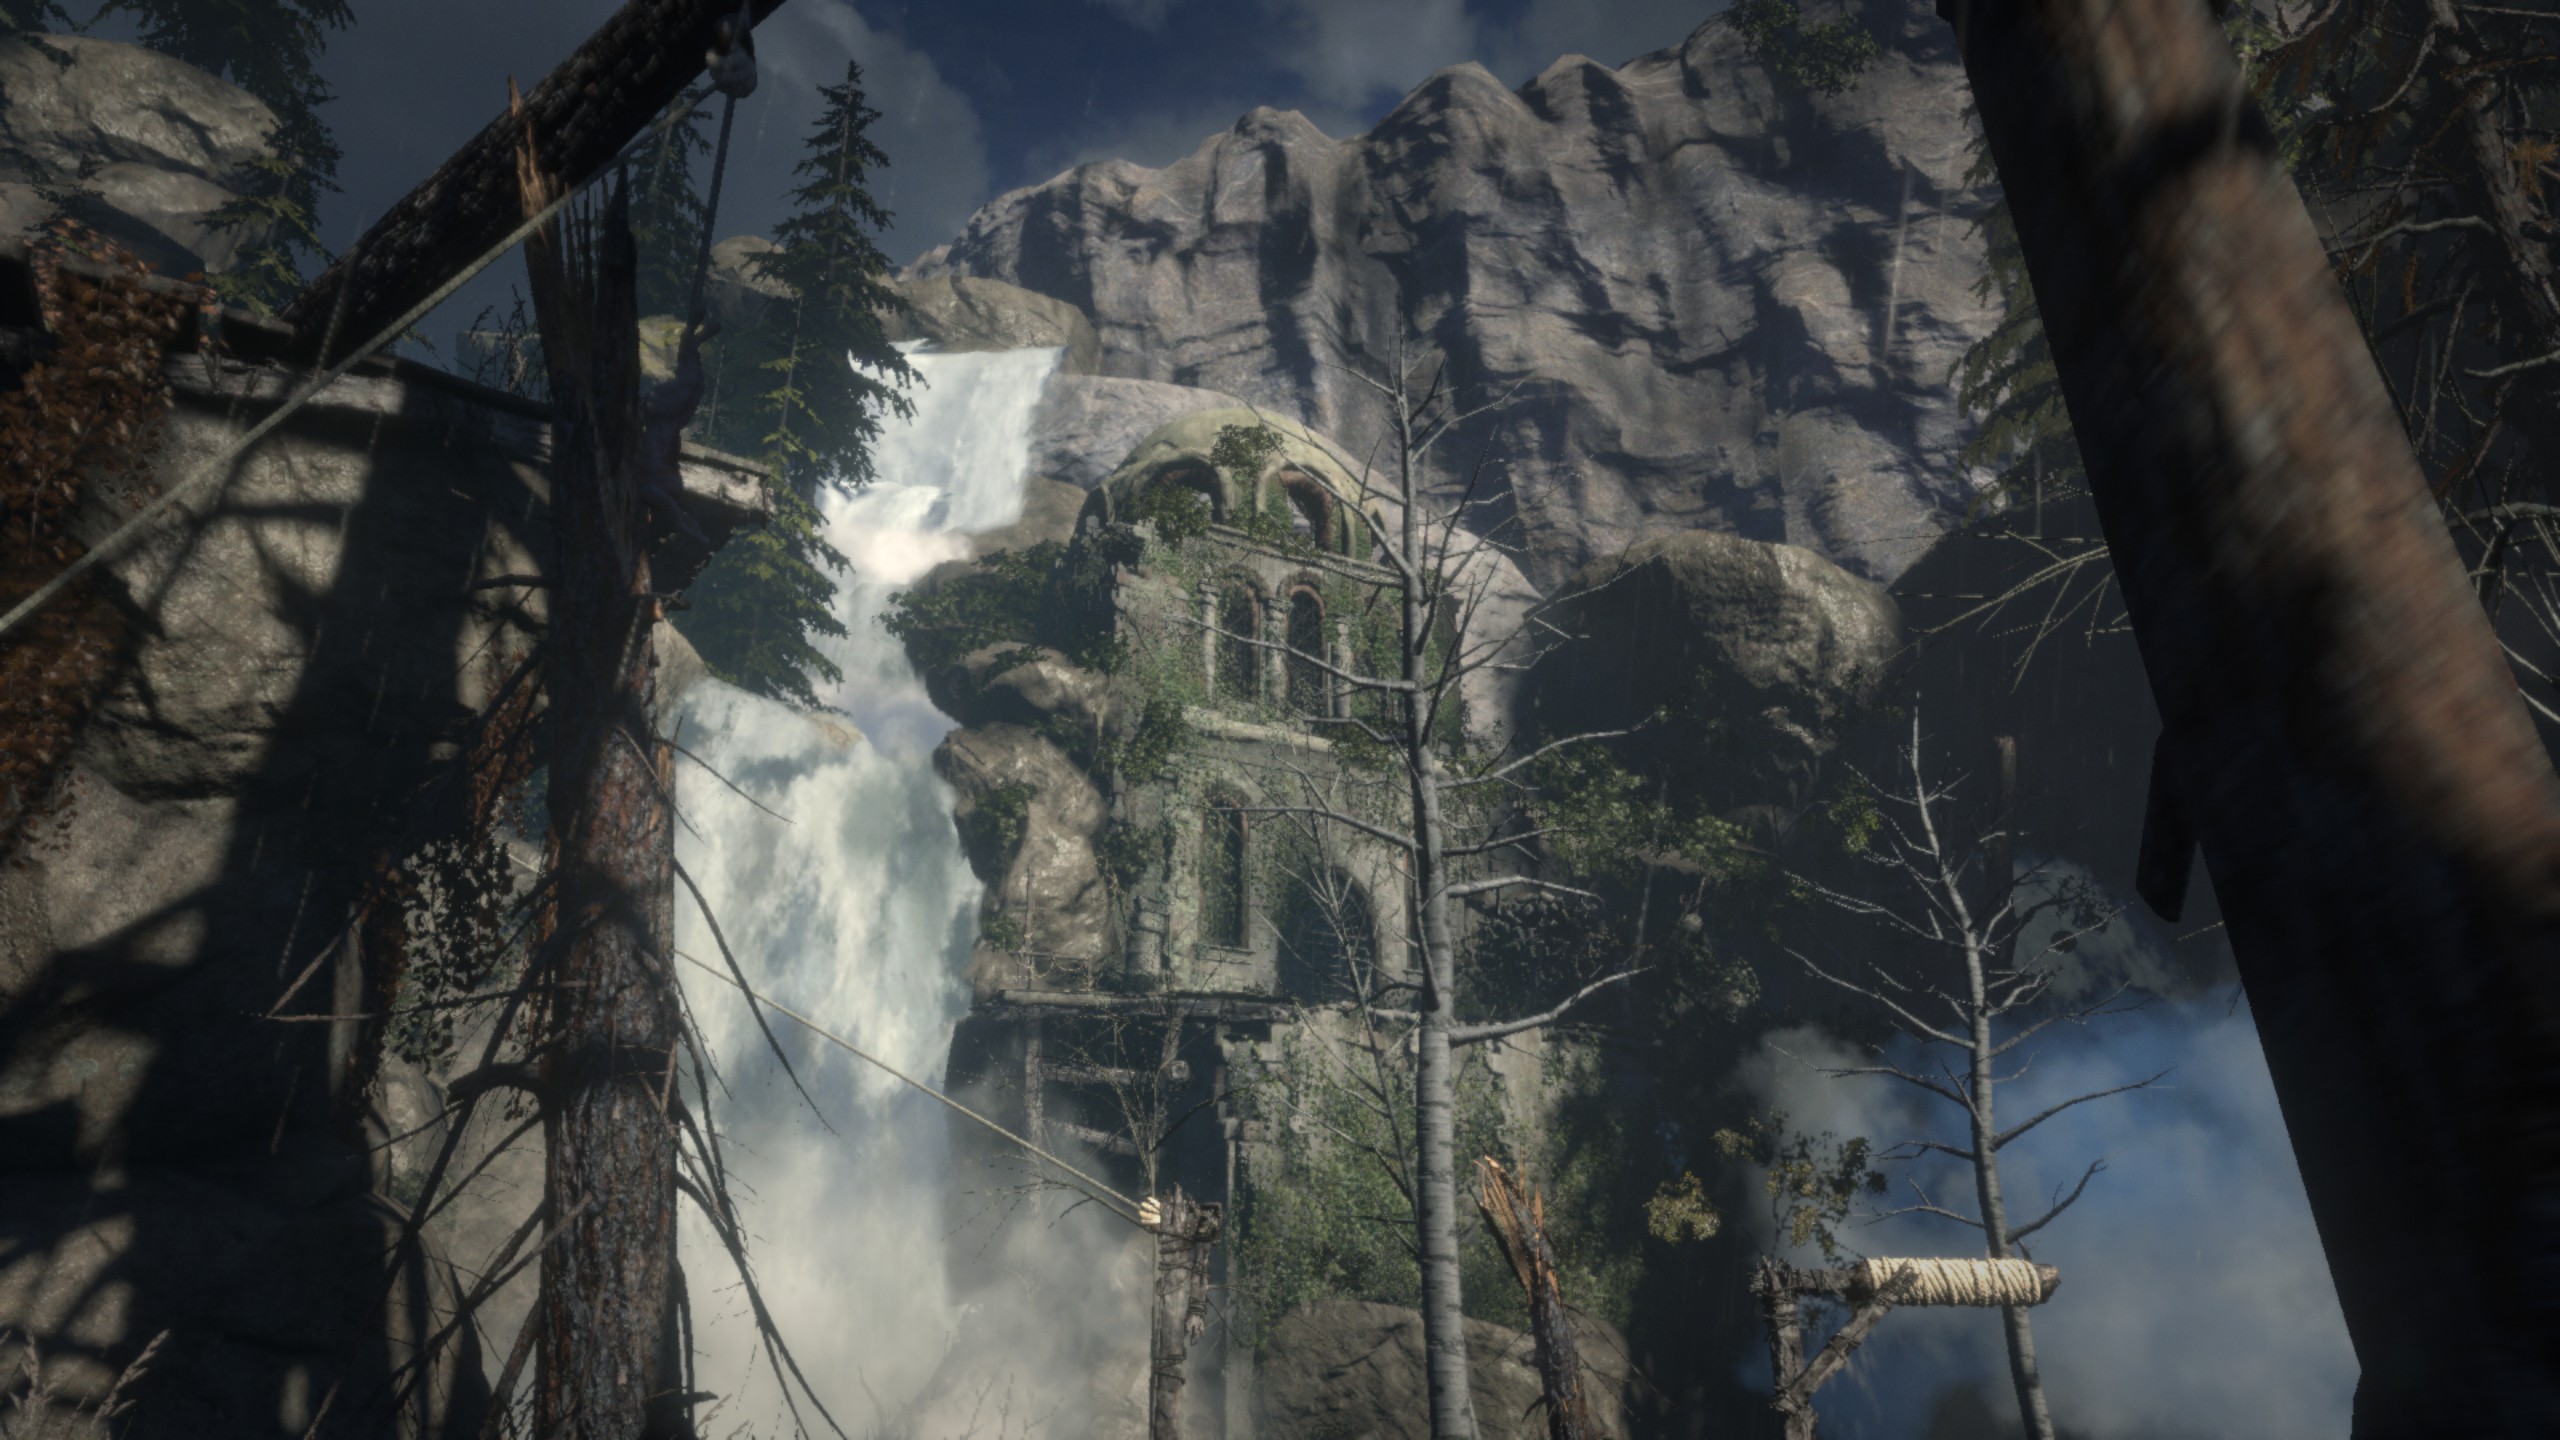
One of the newest games in the gaming benchmark suite is Rise of the Tomb Raider (RoTR), developed by Crystal Dynamics, and the sequel to the popular Tomb Raider which was loved for its automated benchmark mode. But don’t let that fool you: the benchmark mode in RoTR is very much different this time around.
Visually, the previous Tomb Raider pushed realism to the limits with features such as TressFX, and the new RoTR goes one stage further when it comes to graphics fidelity. This leads to an interesting set of requirements in hardware: some sections of the game are typically GPU limited, whereas others with a lot of long-range physics can be CPU limited, depending on how the driver can translate the DirectX 12 workload.
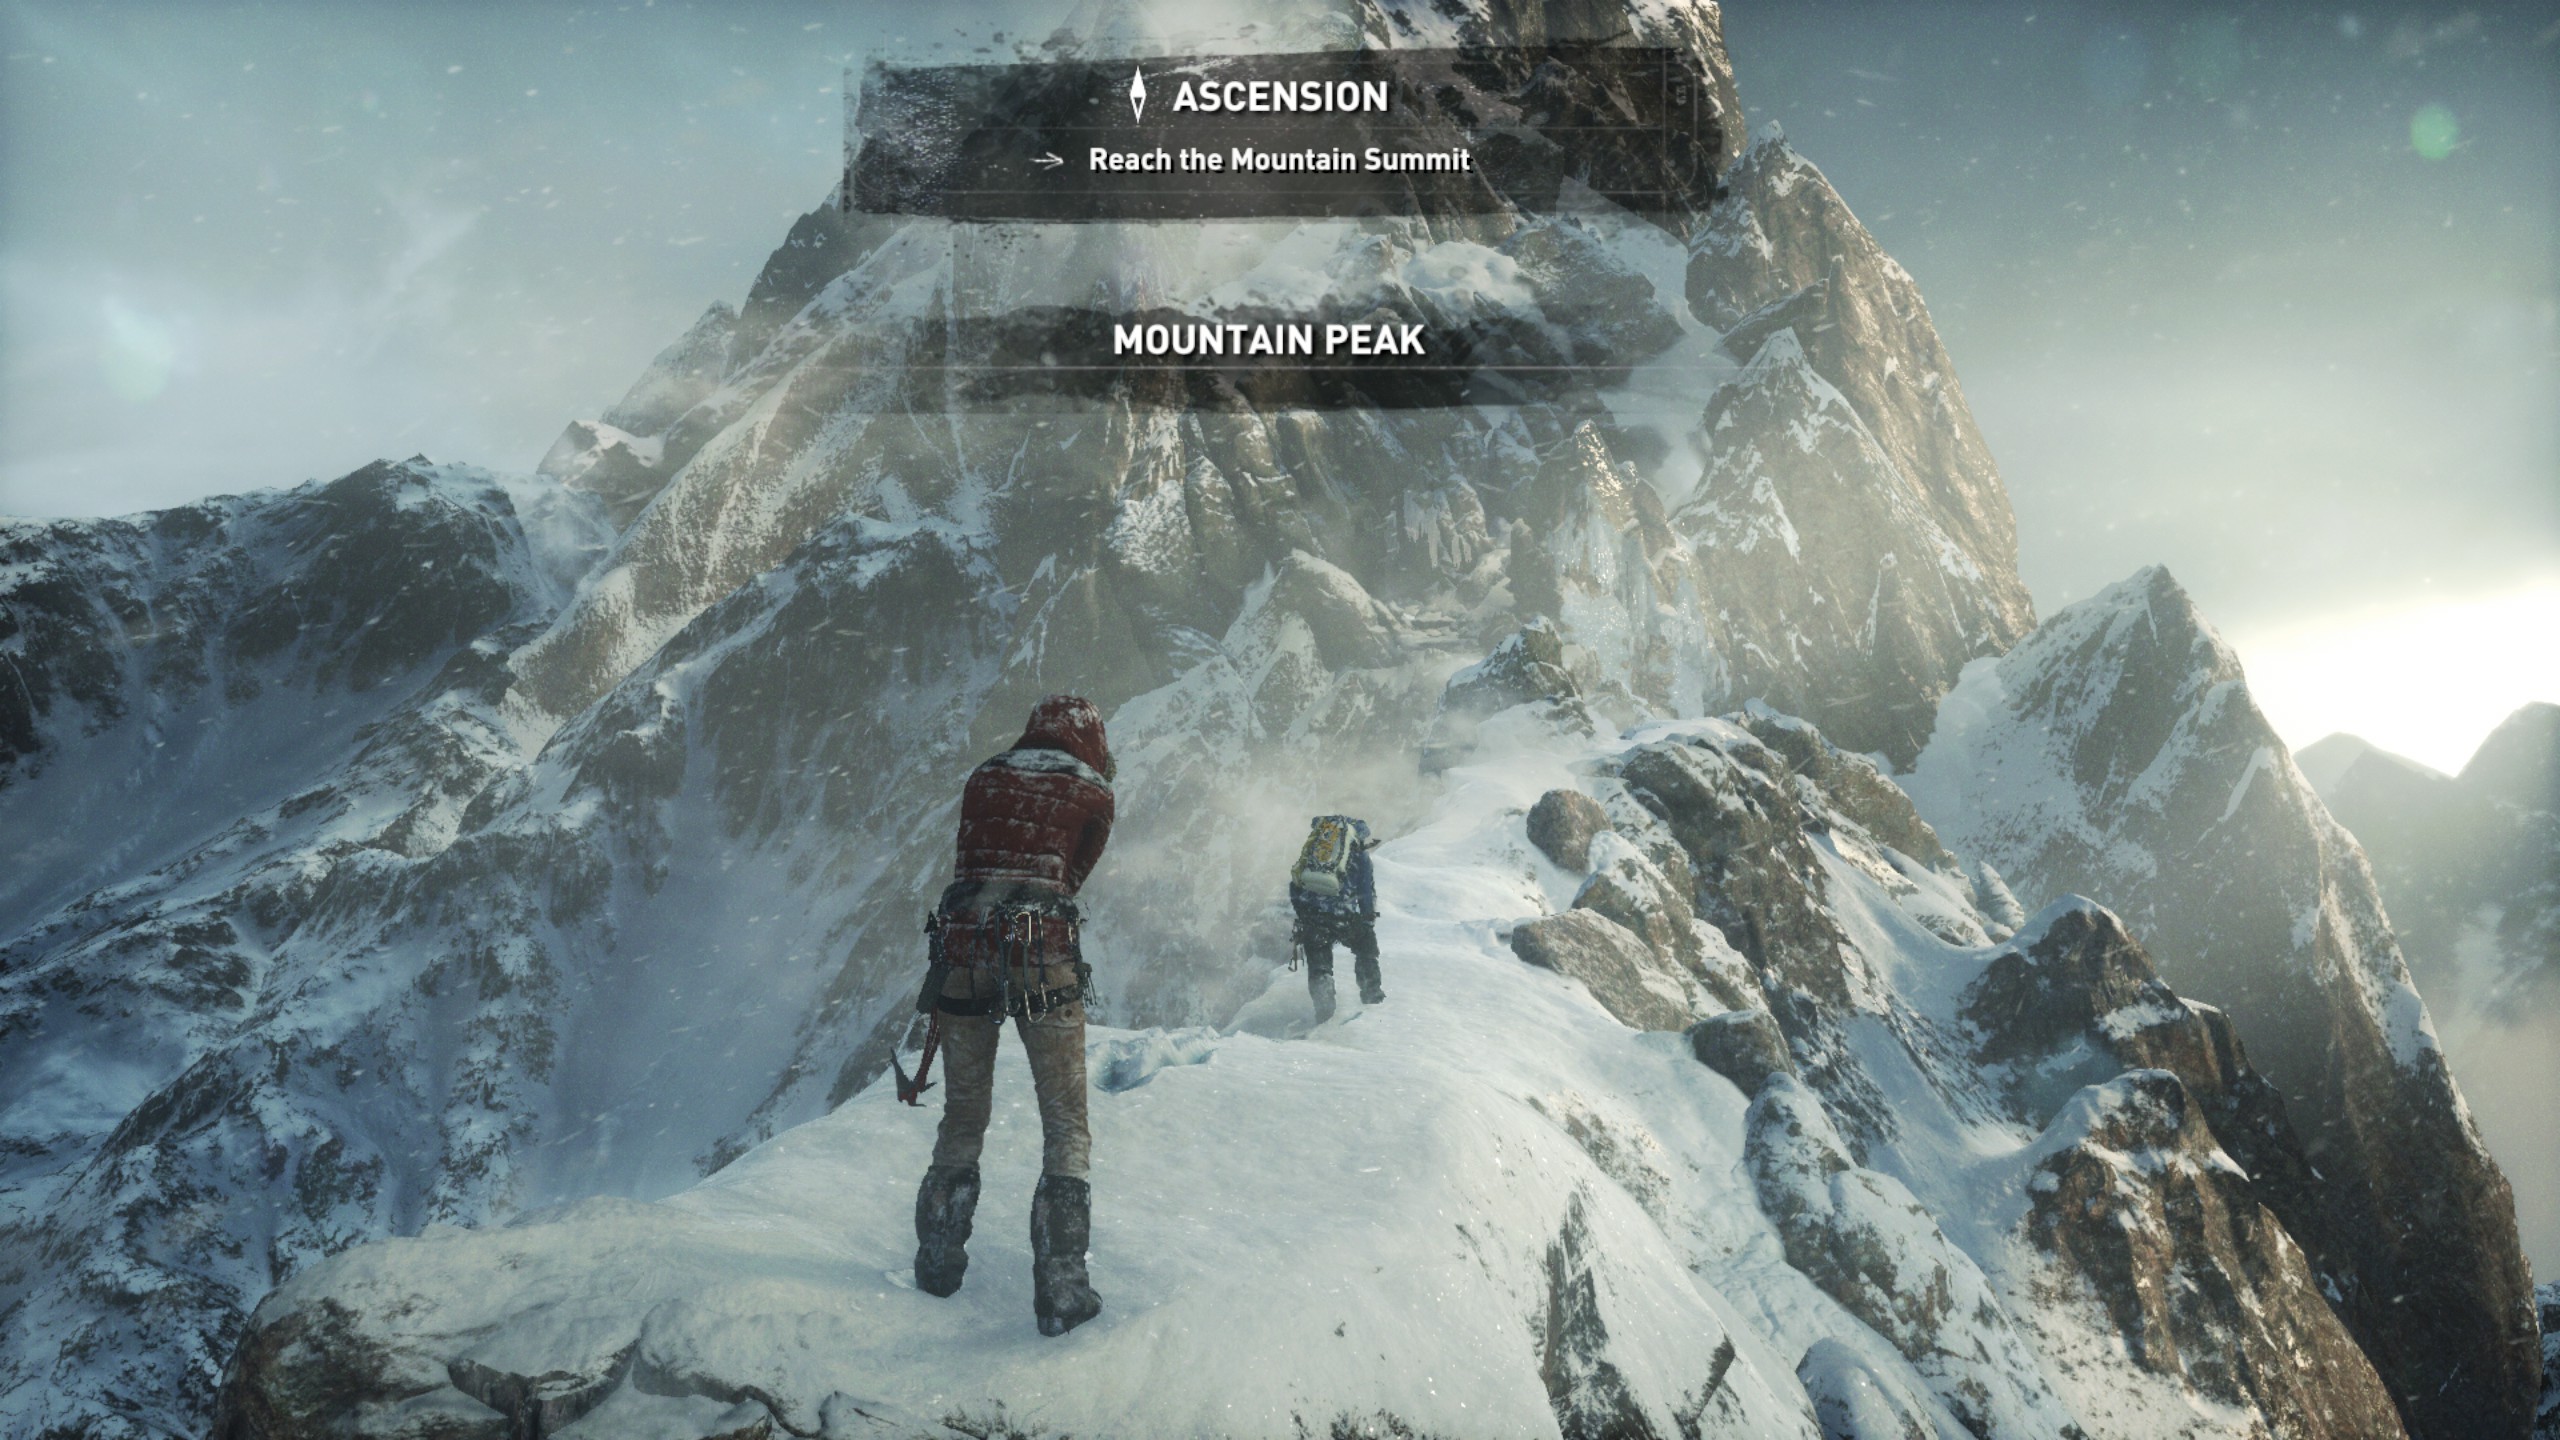
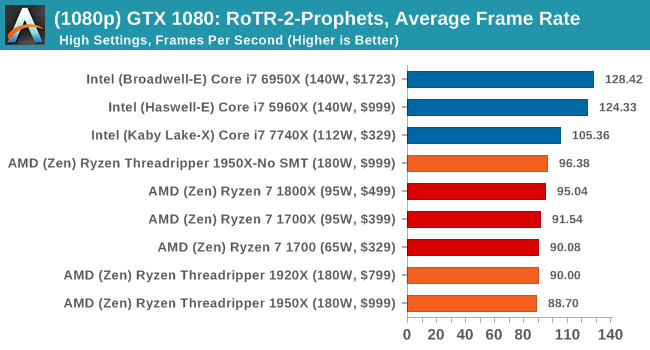
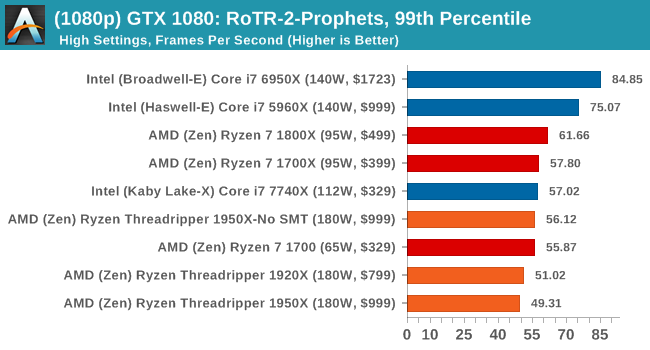
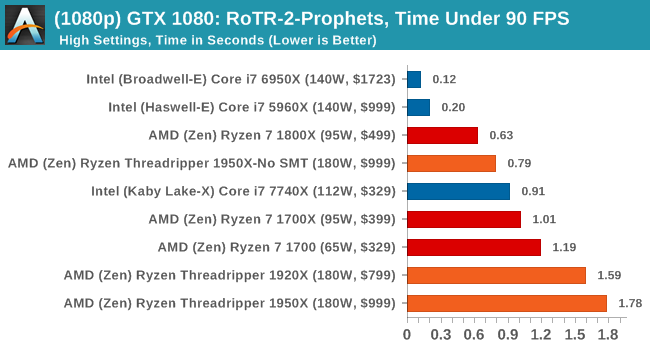
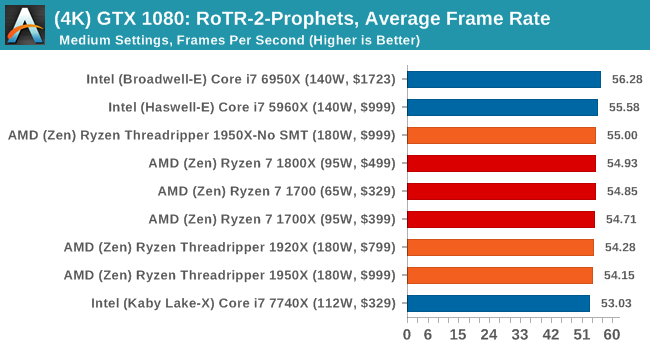
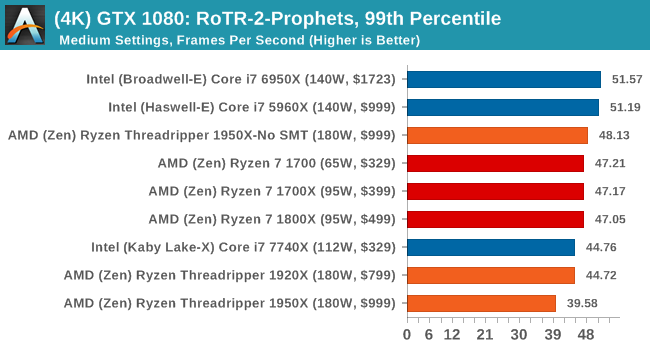
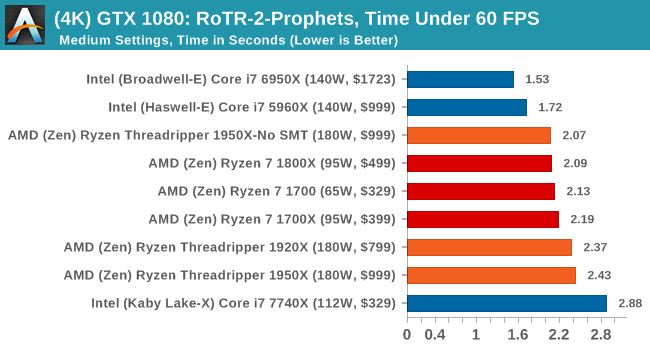
Where the old game had one benchmark scene, the new game has three different scenes with different requirements: Spine of the Mountain (1-Valley), Prophet’s Tomb (2-Prophet) and Geothermal Valley (3-Mountain) - and we test all three (and yes, I need to relabel them - I got them wrong when I set up the tests). These are three scenes designed to be taken from the game, but it has been noted that scenes like 2-Prophet shown in the benchmark can be the most CPU limited elements of that entire level, and the scene shown is only a small portion of that level. Because of this, we report the results for each scene on each graphics card separately.
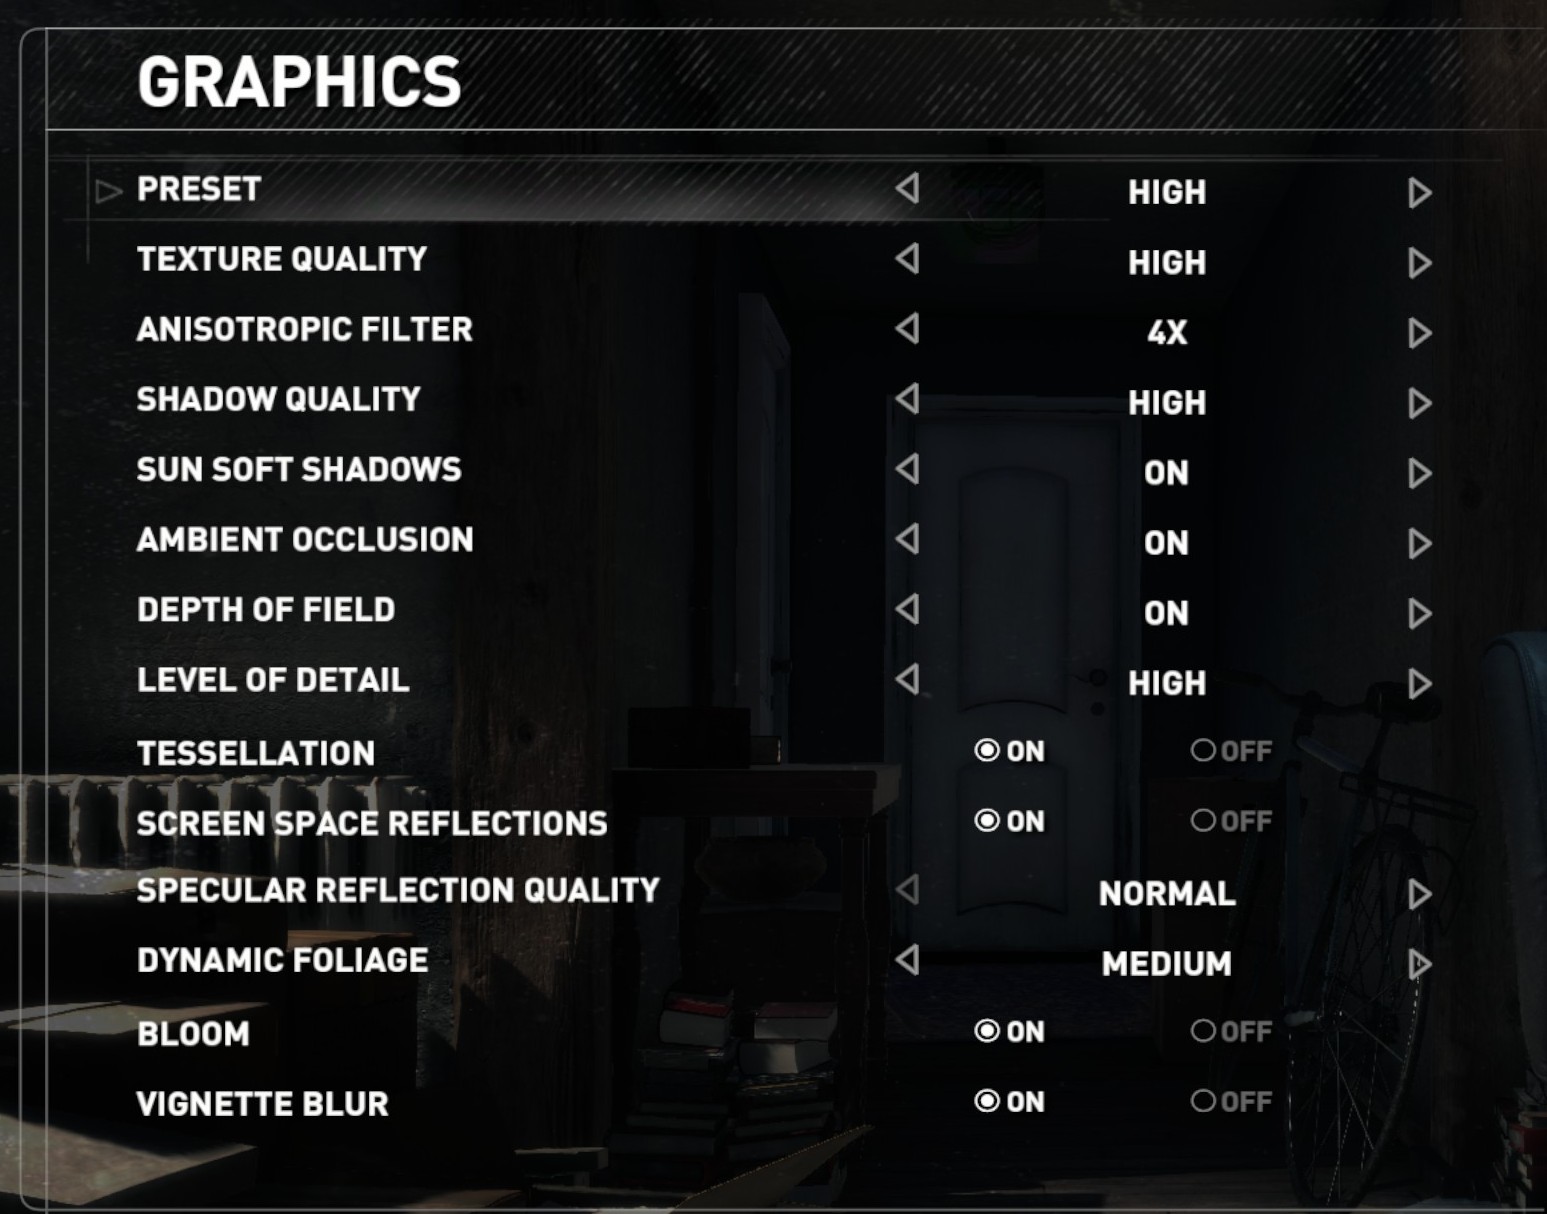
Graphics options for RoTR are similar to other games in this type, offering some presets or allowing the user to configure texture quality, anisotropic filter levels, shadow quality, soft shadows, occlusion, depth of field, tessellation, reflections, foliage, bloom, and features like PureHair which updates on TressFX in the previous game.
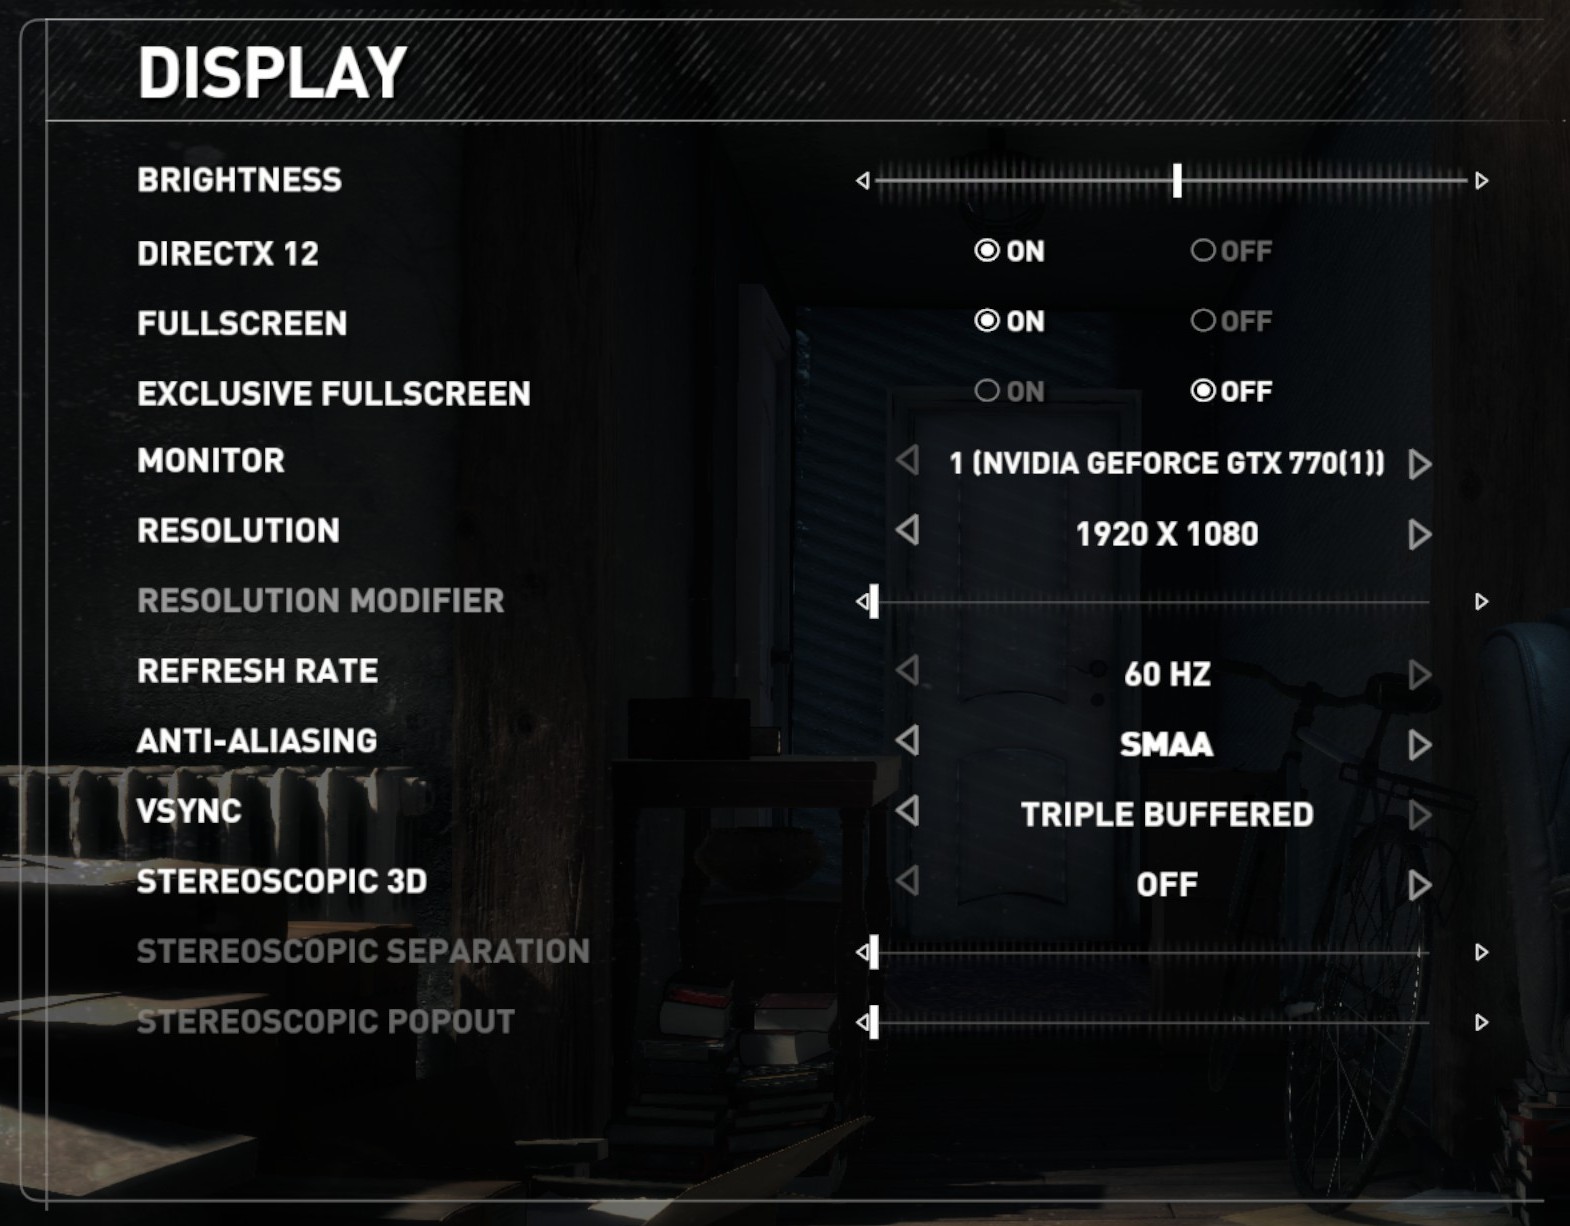
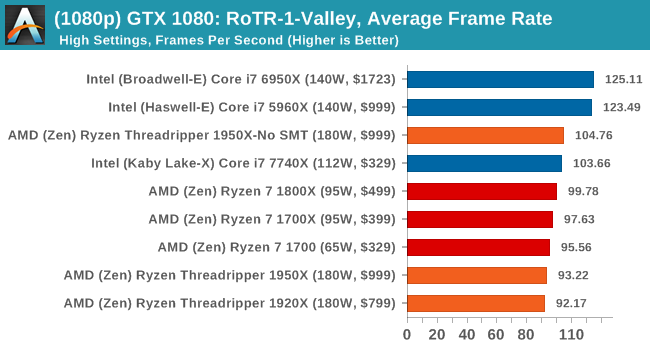
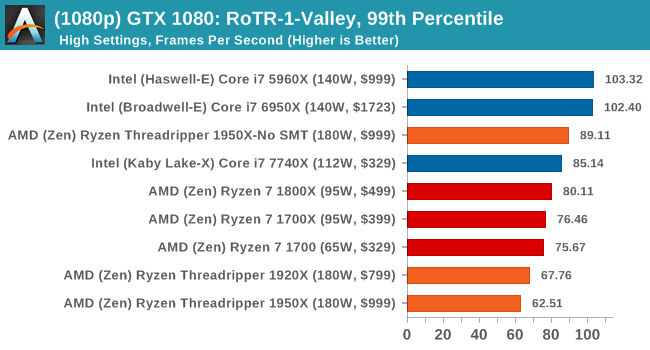
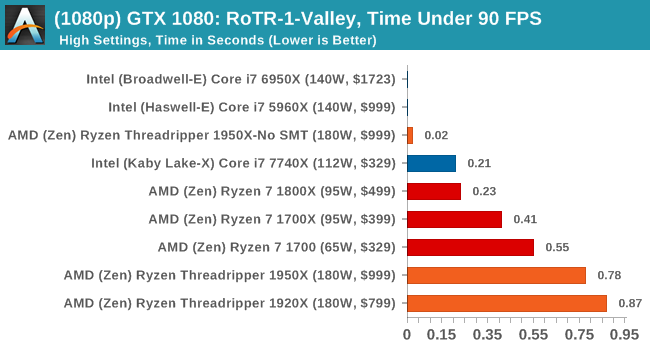
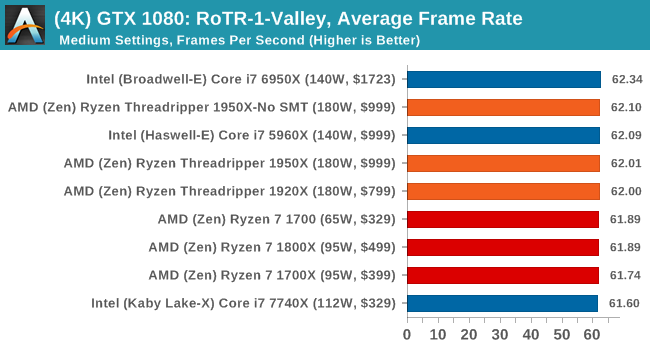
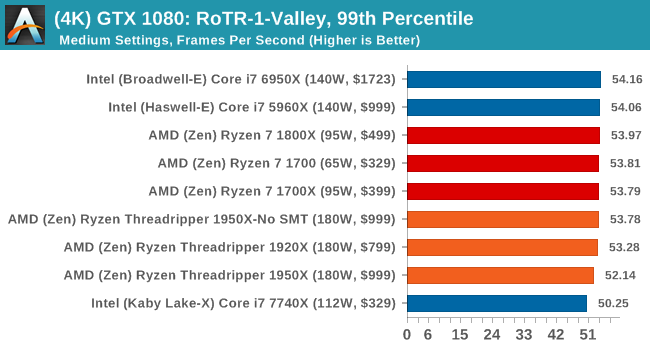
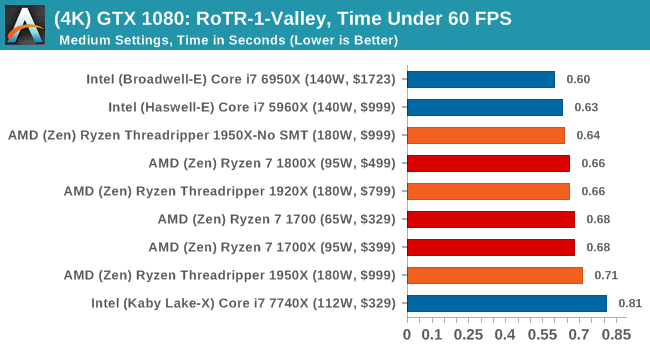
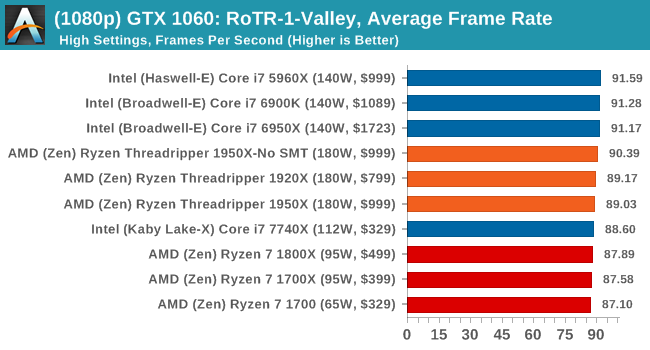
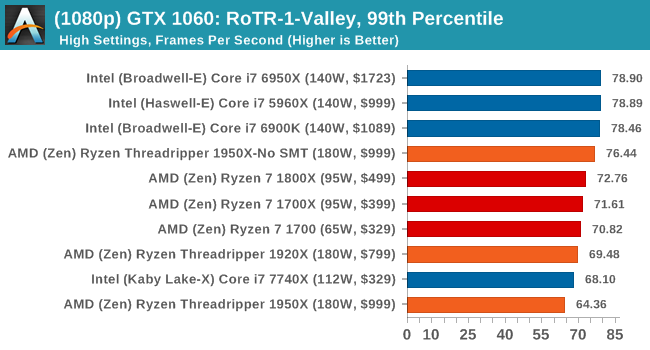
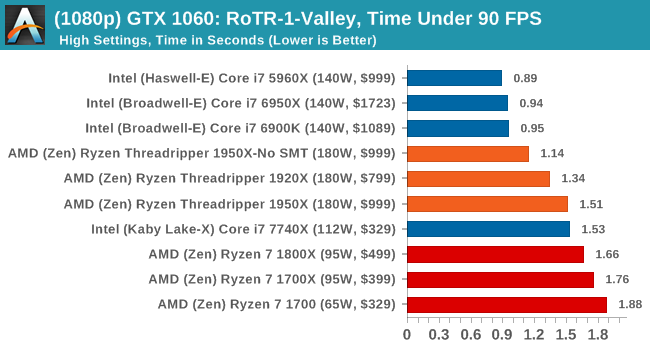
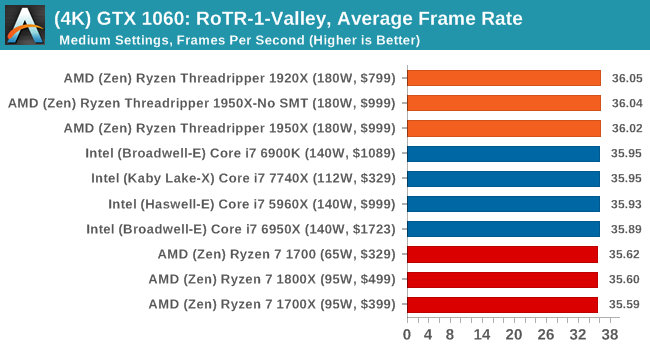
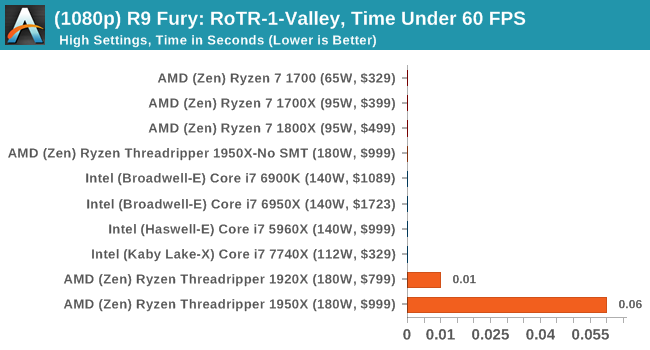
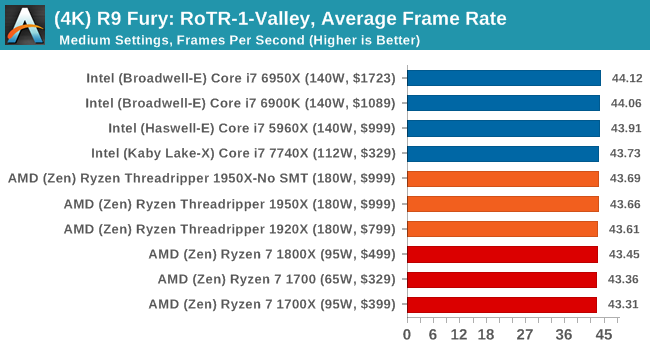
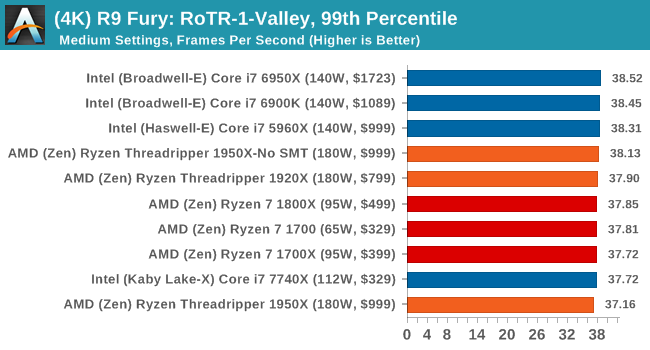
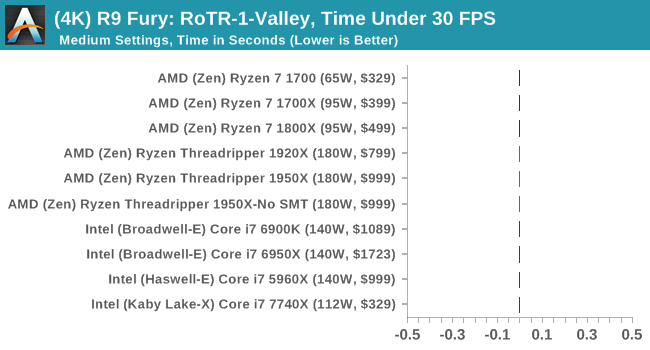
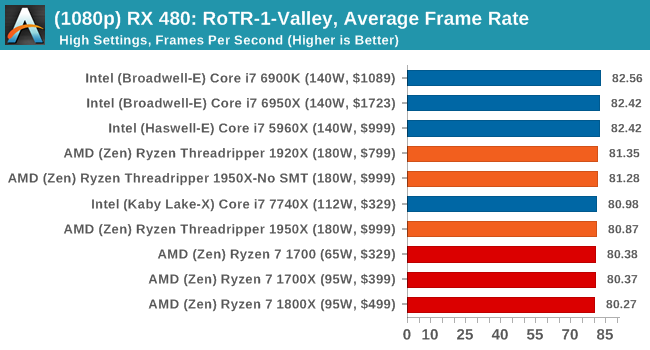
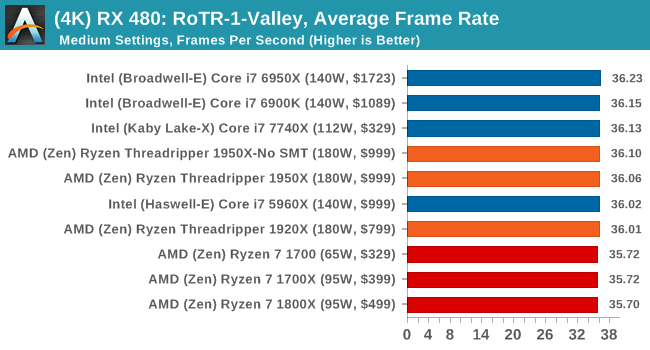
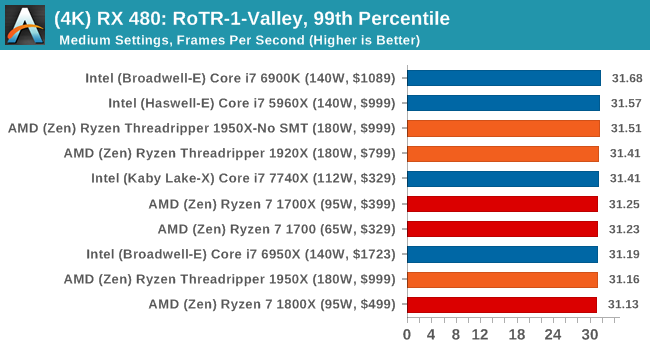
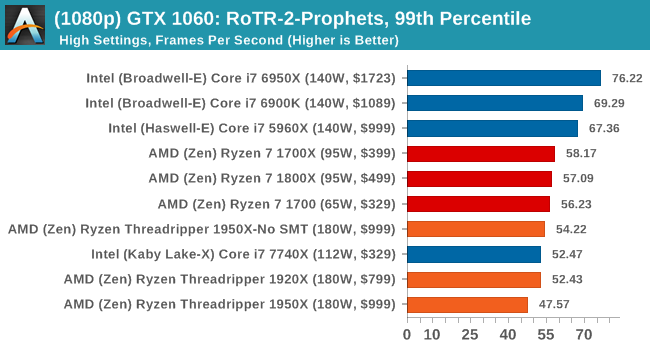
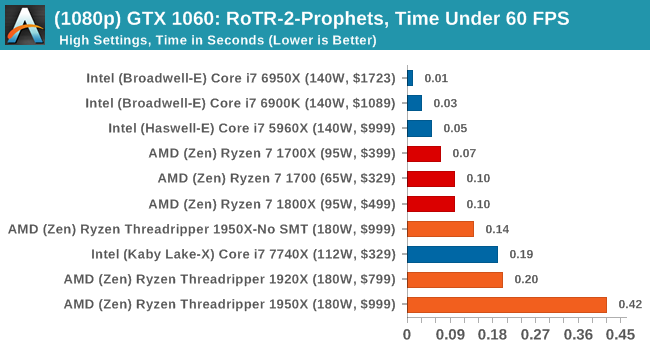
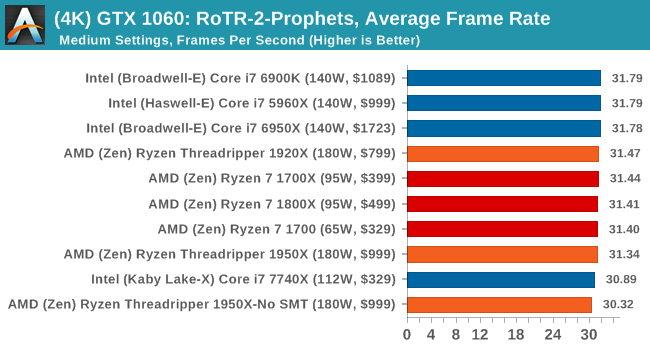
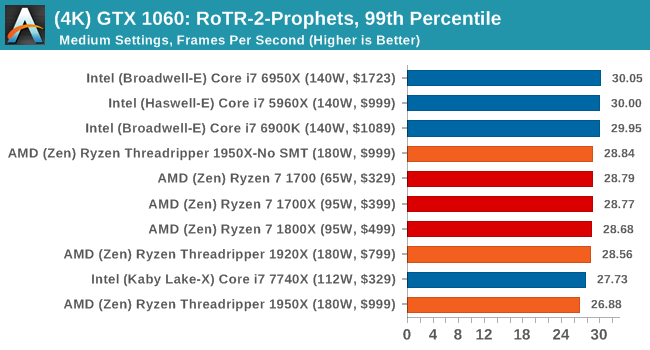
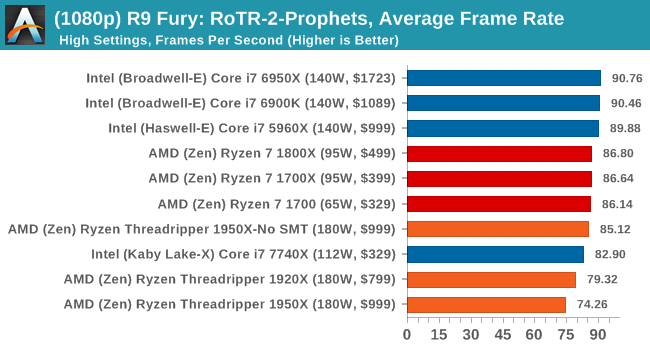
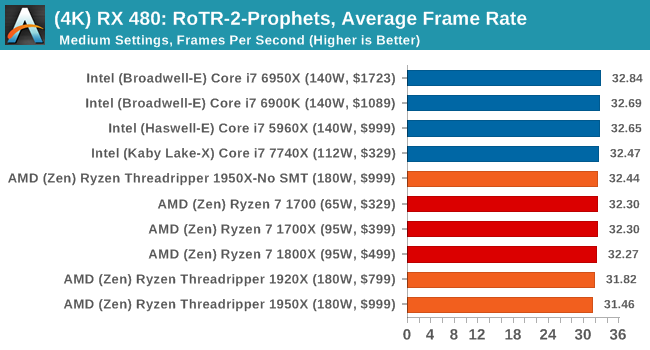
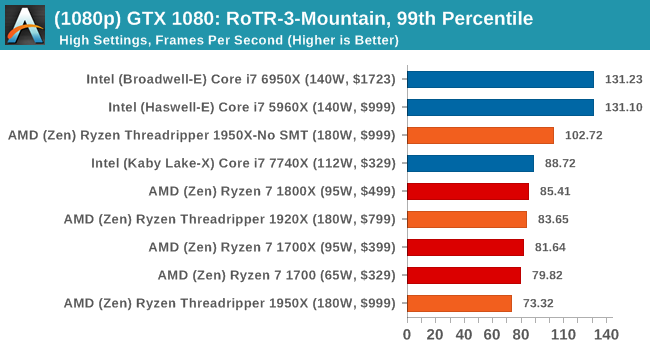
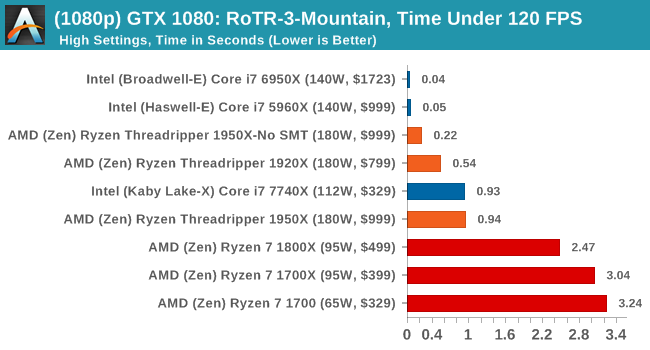
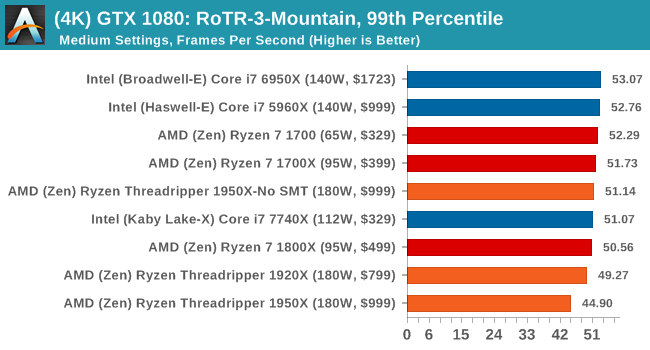
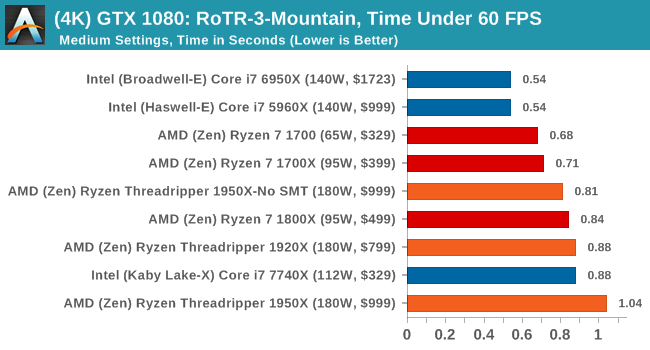
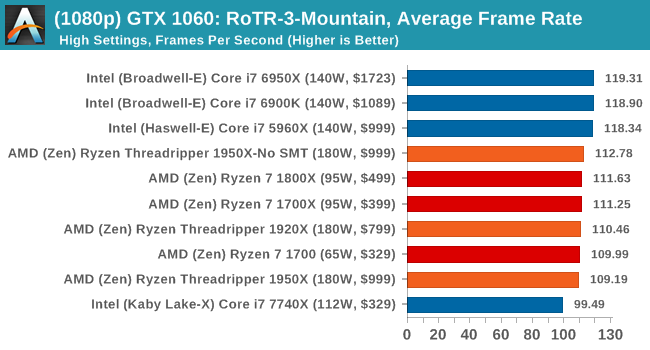
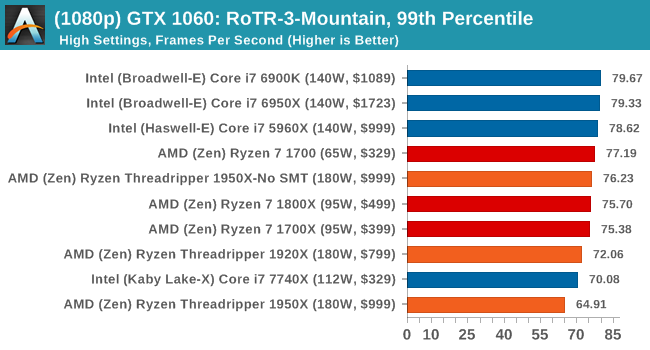
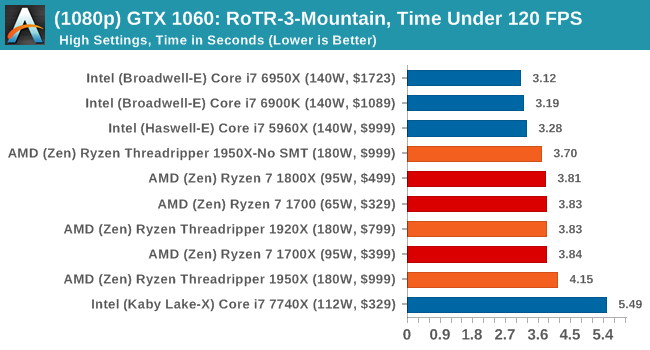
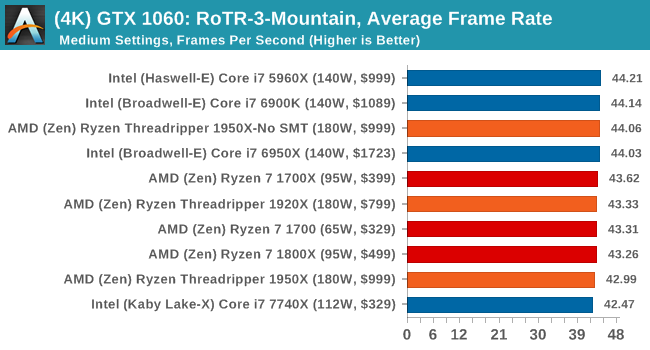
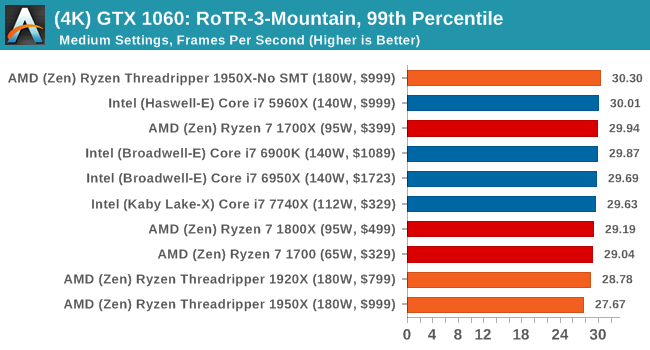
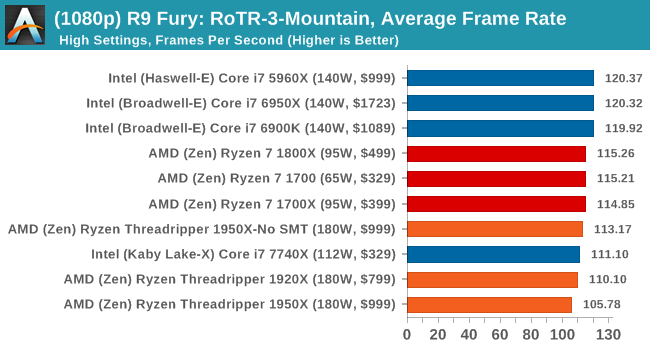
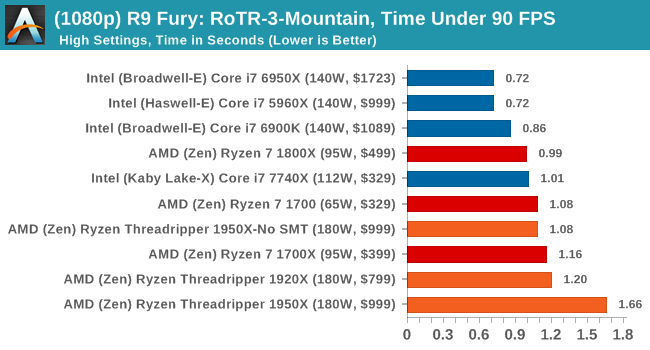
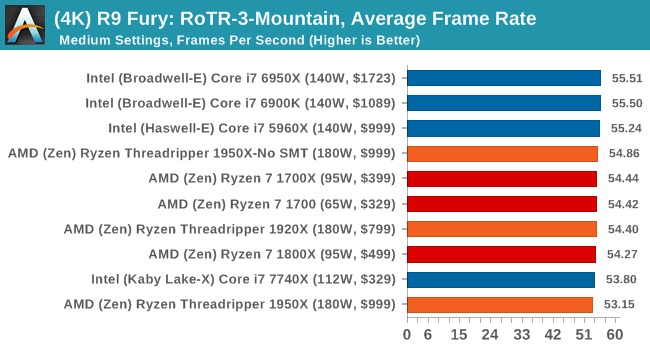
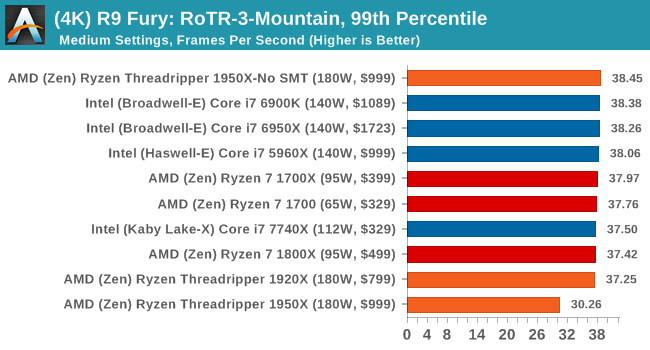
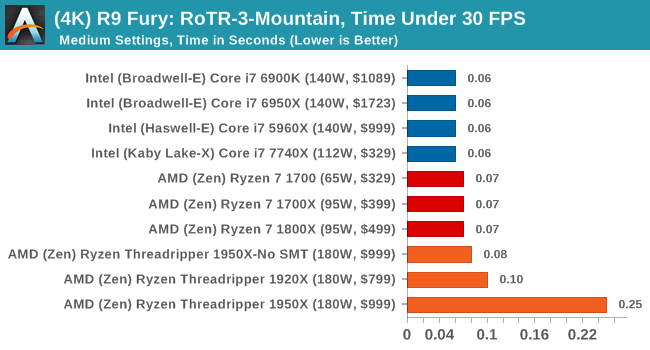
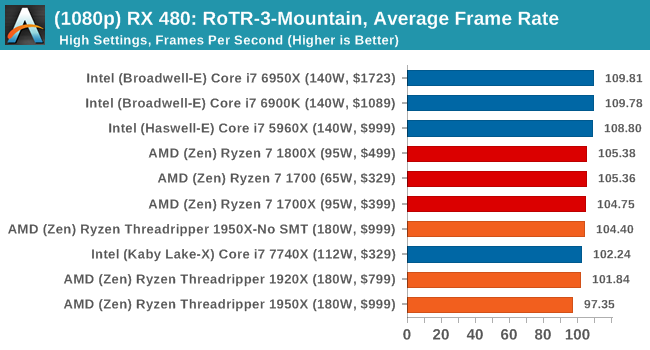
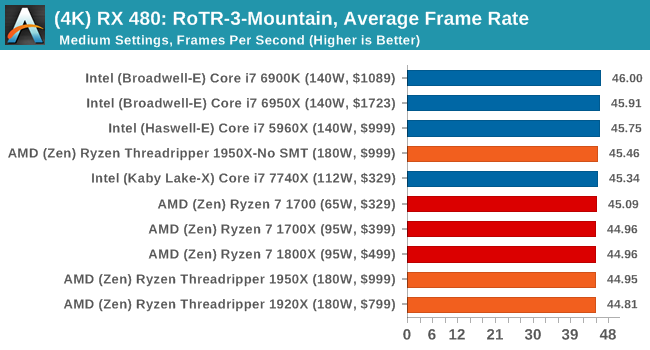
Again, we test at 1920x1080 and 4K using our native 4K displays. At 1080p we run the High preset, while at 4K we use the Medium preset which still takes a sizable hit in frame rate.
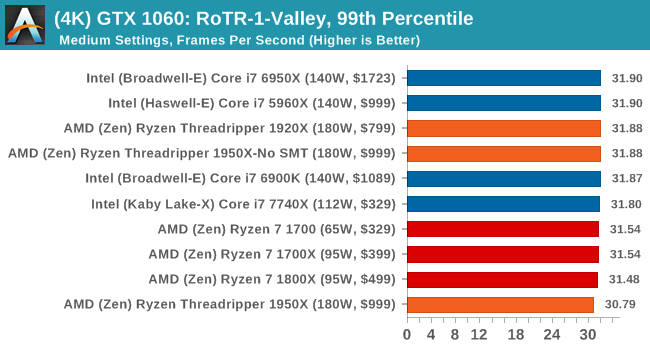
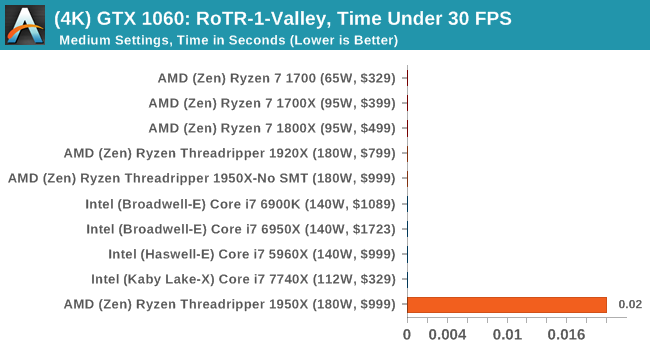
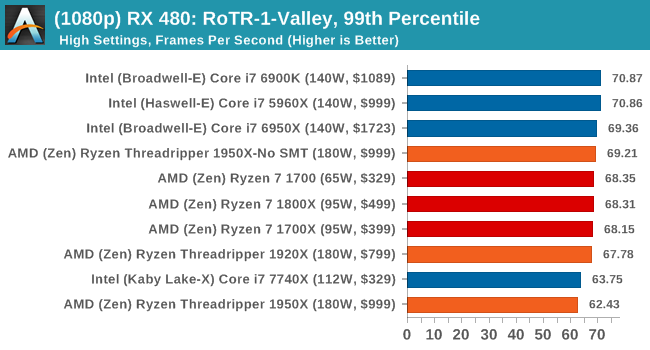
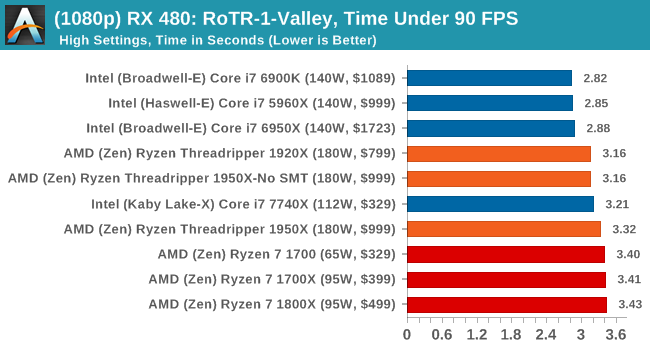
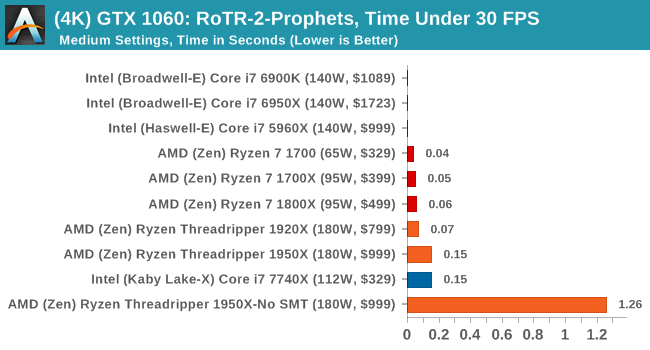
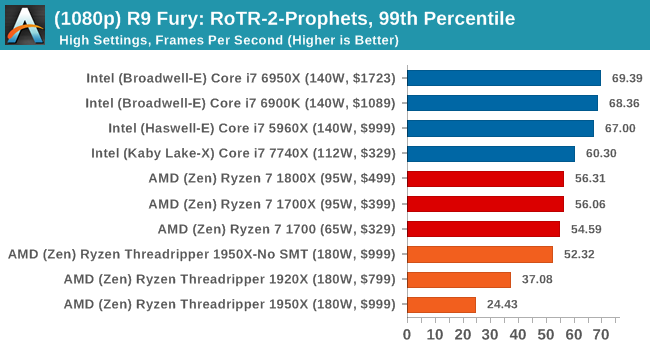
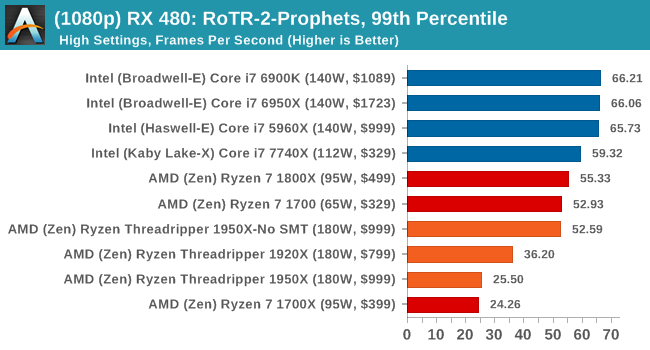
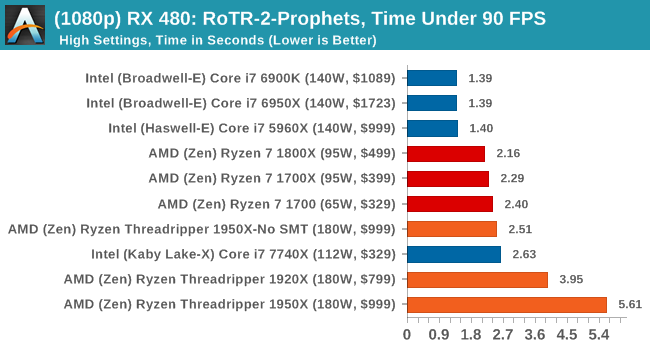
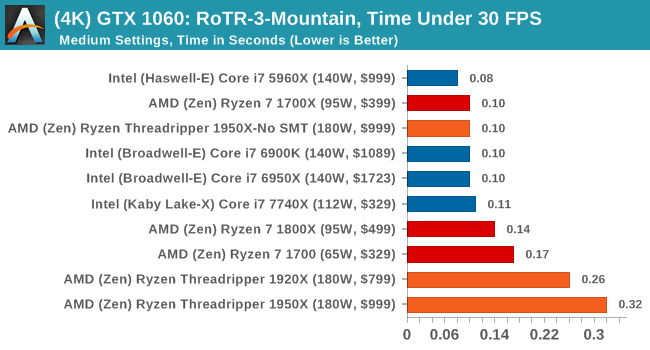
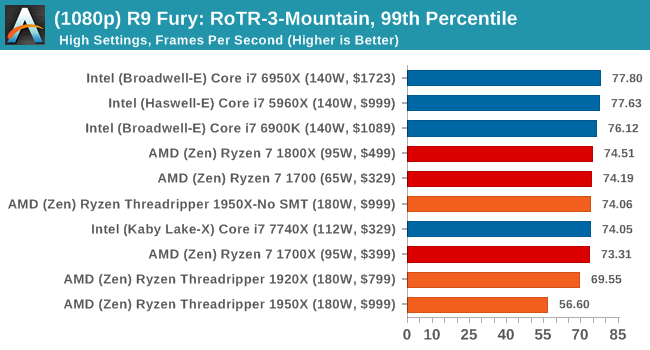
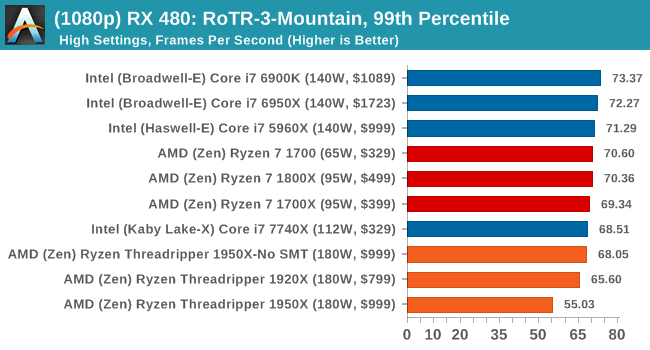
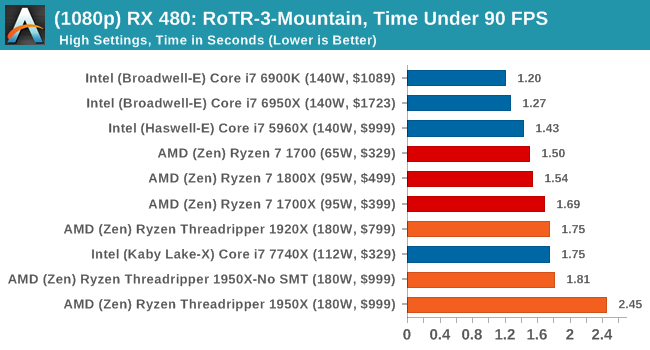
It is worth noting that RoTR is a little different to our other benchmarks in that it keeps its graphics settings in the registry rather than a standard ini file, and unlike the previous TR game the benchmark cannot be called from the command-line. Nonetheless we scripted around these issues to automate the benchmark four times and parse the results. From the frame time data, we report the averages, 99th percentiles, and our time under analysis.
All of our benchmark results can also be found in our benchmark engine, Bench.
#1 Geothermal Valley Spine of the Mountain
MSI GTX 1080 Gaming 8G Performance
1080p
4K
ASUS GTX 1060 Strix 6G Performance
1080p
4K
Sapphire Nitro R9 Fury 4G Performance
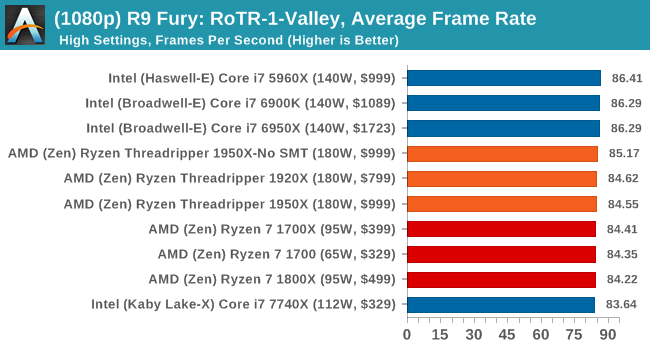
1080p

4K
Sapphire Nitro RX 480 8G Performance
1080p
4K

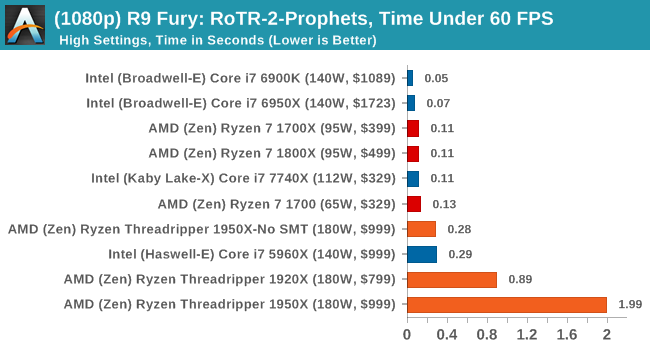
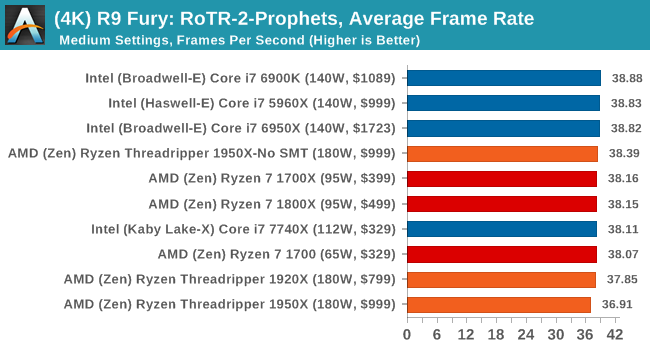
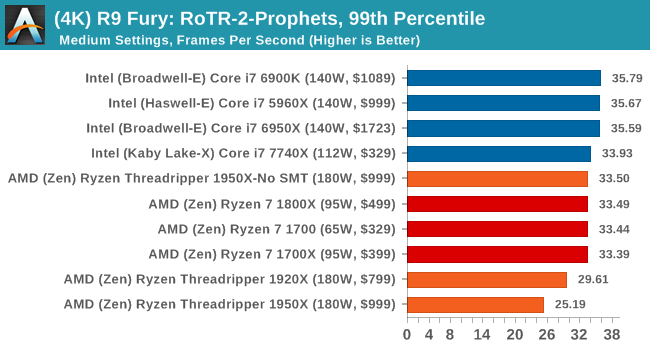
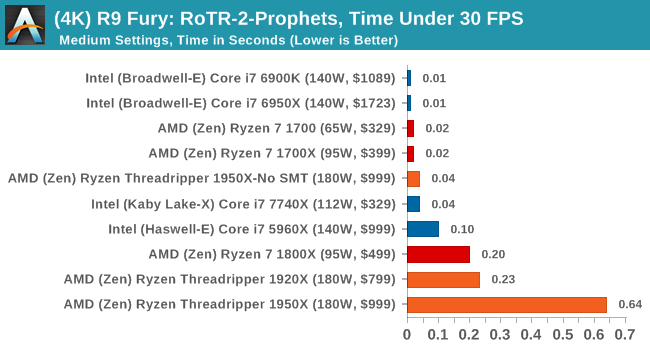
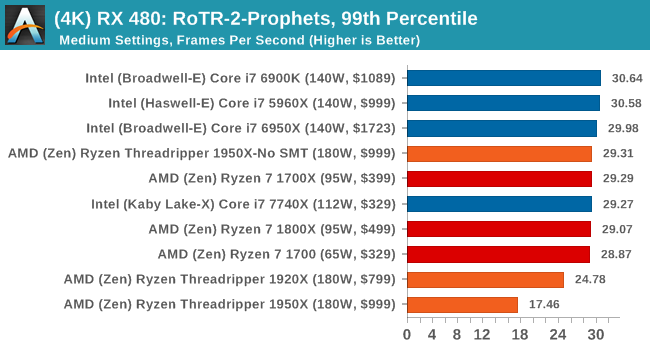
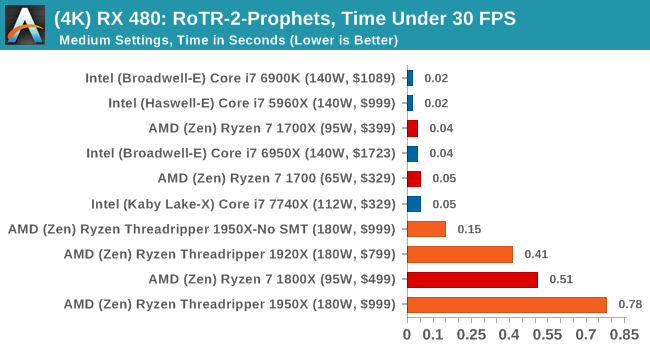
#2 Prophet’s Tomb

MSI GTX 1080 Gaming 8G Performance
1080p
4K
ASUS GTX 1060 Strix 6G Performance
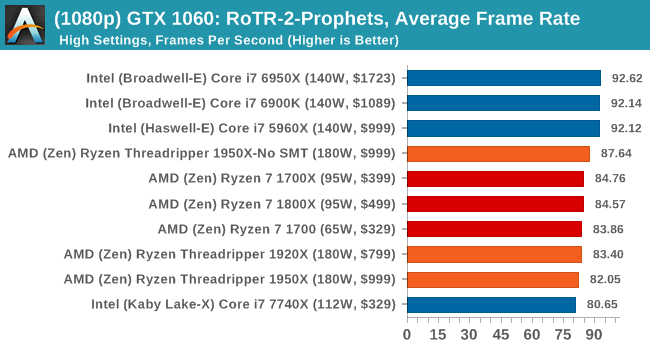
1080p
4K
Sapphire Nitro R9 Fury 4G Performance
1080p
4K
Sapphire Nitro RX 480 8G Performance
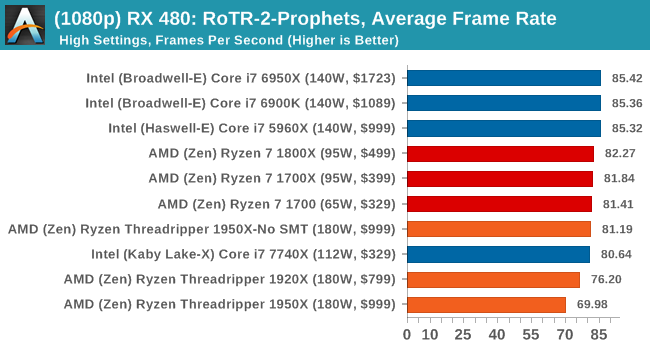
1080p
4K
#3 Spine of the Mountain Geothermal Valley
MSI GTX 1080 Gaming 8G Performance
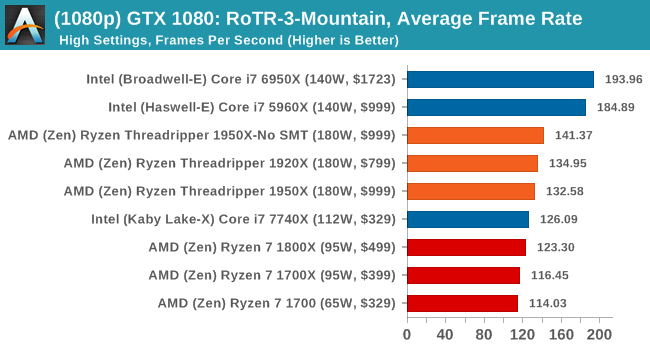
1080p
4K

ASUS GTX 1060 Strix 6G Performance
1080p
4K
Sapphire Nitro R9 Fury 4G Performance
1080p
4K
Sapphire Nitro RX 480 8G Performance
1080p
The 4K
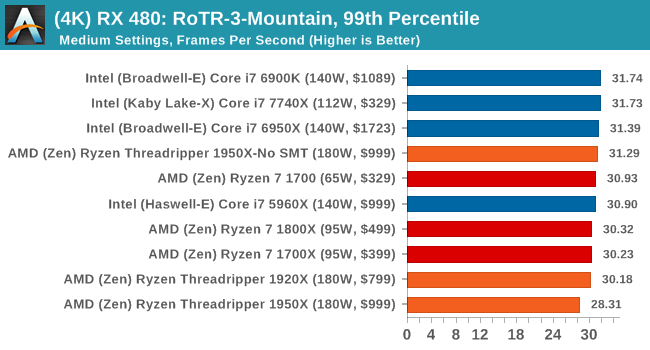
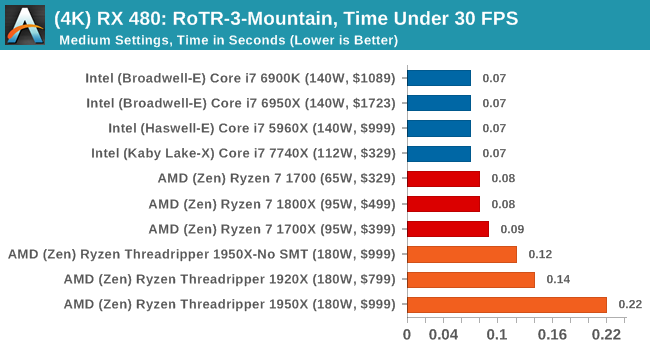
It's clear from these results that the 1950X is not the best gaming chip when in its default mode.


347 Comments
View All Comments
T1beriu - Thursday, August 10, 2017 - link
GTA V, Sapphire Nitro R9 Fury 4G Performance with GTX 1060 charts.GTA V, Sapphire Nitro RX 480 8G Performance with R9 Fury charts.
CleverBullet - Thursday, August 10, 2017 - link
What did you use to test max power consumption? Prime95 small FFTs?I'd love to see some perf/watt comparisons to the 7900X in the future, GamersNexus has some interesting results in that regard with the 1950X behaving significantly better at stock than the 7900X, both doing more work for less power.
carewolf - Thursday, August 10, 2017 - link
You did something wrong with the chromium builds benchmark. It has absolutely no cross core communication and scales almost linearly with number of cores. So you must have misconfigured something or hit a glitz. I work on Chromium profesionally, and we can normally speed it up 2x by distributing compile jobs all the way to another machine. Or by 10x by distributing compile jobs to 10 other machines. Not scaling to more cores on the same CPU makes no sense.Ian Cutress - Thursday, August 10, 2017 - link
We're using a late March build based on v56 with MSVC, using the methodology described in the ELI5, and implementing a complete clean rebuild every time. Why March v56? Because when we locked down our suite a few months back to start testing Windows 10 on several generations of processors, that's where it was at. 50 processors in, several hundred to go...Lolimaster - Friday, August 11, 2017 - link
Then again creating obsolete date for the sake of "our benchamark suite". How about running the "for comparison's sake bench" and another with the latest version, not that difficult.Dave Null - Thursday, August 10, 2017 - link
I don't know why you're being criticized as an Intel shill, Ian. I'll probably be purchasing Threadripper, and I thought it was a good review.One thing I would like to see is some kind of audio benchmark. It's pretty well established at this point that there are latency considerations with Threadripper, and it would be useful to know how this affects DAWs with high track counts, for example.
schizoide - Thursday, August 10, 2017 - link
The link to the 5Ghz space-heater on page 19 goes to your Dropbox as a file:// URL, not http://.Ian Cutress - Thursday, August 10, 2017 - link
That was an odd error. I've adjusted it.Johan Steyn - Thursday, August 10, 2017 - link
The review is unbalanced, aiming mostly at gamers. You probably understand what TR is about, but not all do. This article does not focus on what TR is good at.Ian Cutress - Thursday, August 10, 2017 - link
You do realise how many requests we actually got for game tests? This is our regular CPU Gaming test suite, taken from the suggestions of the readers: fast and slow GPUs, AMD and NVIDIA, 1080 and 4K. The data is there because people do request it, and despite your particular use case, it's an interesting academic exercise in itself. The CPU benchmarks are still plentiful: around 80 tests that take 8-10 hours to run in total. If you want to focus purely on those, then go ahead - the data is meant to be for everyone and whatever focus they are interested in.