The Intel Skylake-X Review: Core i9 7900X, i7 7820X and i7 7800X Tested
by Ian Cutress on June 19, 2017 9:01 AM ESTBenchmarking Performance: CPU Encoding Tests
One of the interesting elements on modern processors is encoding performance. This includes encryption/decryption, as well as video transcoding from one video format to another. In the encrypt/decrypt scenario, this remains pertinent to on-the-fly encryption of sensitive data - a process by which more modern devices are leaning to for software security. Video transcoding as a tool to adjust the quality, file size and resolution of a video file has boomed in recent years, such as providing the optimum video for devices before consumption, or for game streamers who are wanting to upload the output from their video camera in real-time. As we move into live 3D video, this task will only get more strenuous, and it turns out that the performance of certain algorithms is a function of the input/output of the content.
HandBrake H264 and HEVC
As mentioned above, video transcoding (both encode and decode) is a hot topic in performance metrics as more and more content is being created. First consideration is the standard in which the video is encoded, which can be lossless or lossy, trade performance for file-size, trade quality for file-size, or all of the above can increase encoding rates to help accelerate decoding rates. Alongside Google's favorite codec, VP9, there are two others that are taking hold: H264, the older codec, is practically everywhere and is designed to be optimized for 1080p video, and HEVC (or H265) that is aimed to provide the same quality as H264 but at a lower file-size (or better quality for the same size). HEVC is important as 4K is streamed over the air, meaning less bits need to be transferred for the same quality content.
Handbrake is a favored tool for transcoding, and so our test regime takes care of three areas.
Low Quality/Resolution H264: He we transcode a 640x266 H264 rip of a 2 hour film, and change the encoding from Main profile to High profile, using the very-fast preset.
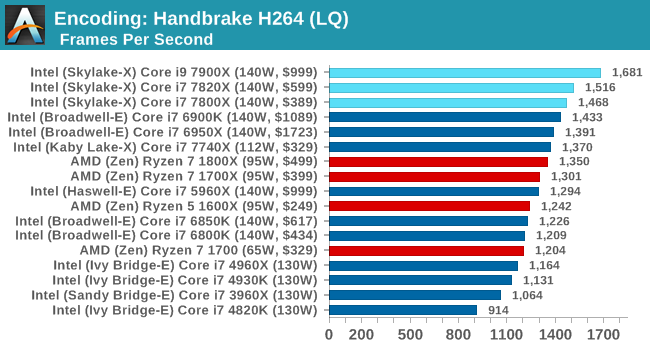
More cores, more frequency, more IPC, more fun: the Core i9-7900X wins here, and even the i7-7800X wins out against the Core i7-6900K.
High Quality/Resolution H264: A similar test, but this time we take a ten-minute double 4K (3840x4320) file running at 60 Hz and transcode from Main to High, using the very-fast preset.
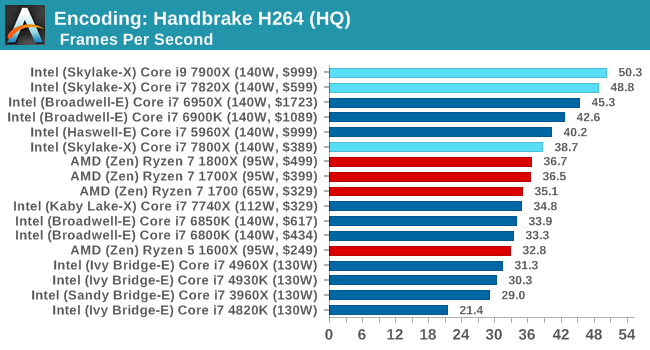
Moving into HQ mode means making the job more parallel, so the higher core counts stay at the top of the chart.
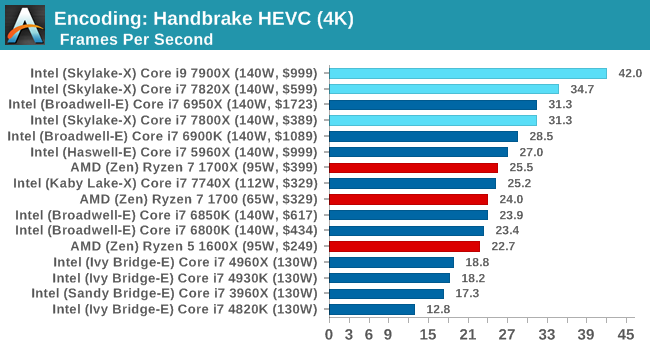
HEVC Test: Using the same video in HQ, we change the resolution and codec of the original video from 4K60 in H264 into 4K60 HEVC.
WinRAR 5.40
For the 2017 test suite, we move to the latest version of WinRAR in our compression test. WinRAR in some quarters is more user friendly that 7-Zip, hence its inclusion. Rather than use a benchmark mode as we did with 7-Zip, here we take a set of files representative of a generic stack (33 video files in 1.37 GB, 2834 smaller website files in 370 folders in 150 MB) of compressible and incompressible formats. The results shown are the time taken to encode the file. Due to DRAM caching, we run the test 10 times and take the average of the last five runs when the benchmark is in a steady state.
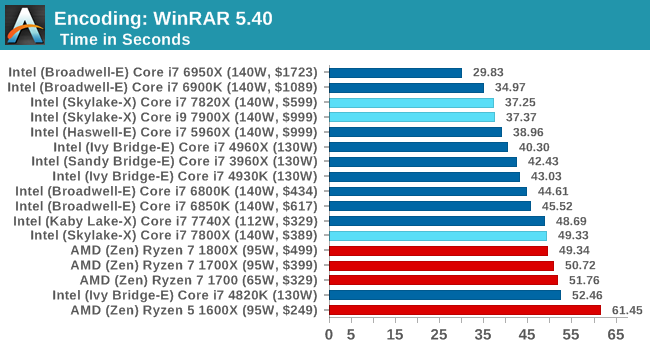
WinRAR loves having access to all the caches as much as possible, to prefetch and store data as needed. The Skylake-X chips fall back a bit here, even with DDR4-2666 support. The Core i7-7800X uses DDR4-2400 memory, so puts it further behind. Interesting didn't realise that the lower core count Broadwell-E chips were affected so much by this test, and the higher core count Ivy Bridge-E parts are faster here.
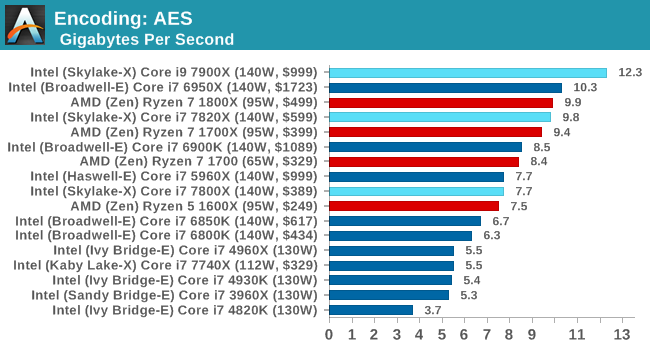
AES Encoding
Algorithms using AES coding have spread far and wide as a ubiquitous tool for encryption. Again, this is another CPU limited test, and modern CPUs have special AES pathways to accelerate their performance. We often see scaling in both frequency and cores with this benchmark. We use the latest version of TrueCrypt and run its benchmark mode over 1GB of in-DRAM data. Results shown are the GB/s average of encryption and decryption.
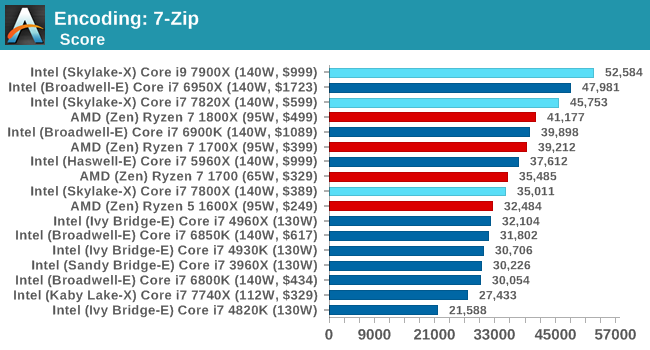
7-Zip
One of the freeware compression tools that offers good scaling performance between processors is 7-Zip. It runs under an open-source licence, is fast, and easy to use tool for power users. We run the benchmark mode via the command line for four loops and take the output score.


264 Comments
View All Comments
Slappi2 - Monday, June 19, 2017 - link
Running 1080s, doubt I'll notice.Luckz - Monday, June 19, 2017 - link
That's an impressive review / article considering the source.prophet001 - Monday, June 19, 2017 - link
The TDP on the chip is 140W. If they can't cool it then there's a problem with the heat spreader.How well it overclocks is another point of discussion separate from this one.
prisonerX - Monday, June 19, 2017 - link
And yet the only reason you're seeing it at all is becuase of AMD. You epitomise the pure, untrammeled genius of typical Intel customers.Spunjji - Tuesday, June 20, 2017 - link
This is lost on Slappi.FreckledTrout - Monday, June 19, 2017 - link
Slappi2, you reading the same charts? Also have you seen game reviews on other sites. The 1800x holds its own pretty well compared to t he 7820x 8-core, yes the 7820x is faster but not by a huge margin. We don't have Thredripper just yet to see AMD's 10 core comparison so saying Intel's 10 core is killing AMD's 8-core models is a bit disingenuous.AnandTechReader2017 - Monday, June 19, 2017 - link
The review is missing power consumption, clock speed and current price.At no point is it stated what clock speed anything is running at, it could be that Ryzen is running at base and Intel running overclocked (as speedshift would allow). There are also no comparisons with speedshift on/off.
There is no mention of power draw, the Intel processors are all using a 112/130/140W envelope, but are probably way below that with base, while Ryzen is 95/65W with no mention if overlocked above that envelope or underclocked.
If you check Amazon, one can get the R7 1800X for $439 versus the $499 they posted.
Also, the top Intel chips are competing with Thread Ripper, not Ryzen 7.
You're probably going to accuse me of fanboyism, I just don't like it if so many test details are missing. There is also no mention of temperature at max load, etc.
AnandTechReader2017 - Monday, June 19, 2017 - link
To add: They also have 2666MHz and 3000MHz RAM, yet they don't state what clock speed the test is run at.There is so much information missing.
Ian Cutress - Monday, June 19, 2017 - link
Power consumption is added. Sorry, I'm currently half-way around the world suffering jet lag - I had the graph compiled, I just forgot to write about it. It's been added.Clock Speed: As per the first page.
Current Pricing: As per the first page.
With regards the recent price drops from AMD on the Ryzen chips - everything seems to point that this is distributor driven. We've not seen anything official from AMD (such as price lists) that confirm an official price drop. If you have a link to that, please share.
On the DRAM: our standard policy as with every review is to run JEDEC for the maximum officially supported frequency. Nothing changes in this review. So that's DDR4-2666 for the 7900X and 7820X, and DDR4-2400 for the 7800X.
Tamz_msc - Monday, June 19, 2017 - link
What benchmark was used for the power consumption data?