The Intel Skylake-X Review: Core i9 7900X, i7 7820X and i7 7800X Tested
by Ian Cutress on June 19, 2017 9:01 AM ESTBenchmarking Performance: CPU System Tests
Our first set of tests is our general system tests. These set of tests are meant to emulate more about what people usually do on a system, like opening large files or processing small stacks of data. This is a bit different to our office testing, which uses more industry standard benchmarks, and a few of the benchmarks here are relatively new and different.
PDF Opening
First up is a self-penned test using a monstrous PDF we once received in advance of attending an event. While the PDF was only a single page, it had so many high-quality layers embedded it was taking north of 15 seconds to open and to gain control on the mid-range notebook I was using at the time. This put it as a great candidate for our 'let's open an obnoxious PDF' test. Here we use Adobe Reader DC, and disable all the update functionality within. The benchmark sets the screen to 1080p, opens the PDF to in fit-to-screen mode, and measures the time from sending the command to open the PDF until it is fully displayed and the user can take control of the software again. The test is repeated ten times, and the average time taken. Results are in milliseconds.
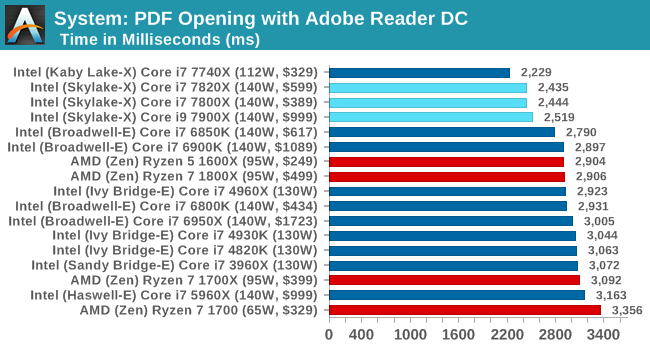
The extra frequency of the new processors is helping when it comes to opening our monster PDF, but also the extra L2 cache is likely having an effect as well.
FCAT Processing
One of the more interesting workloads that has crossed our desks in recent quarters is FCAT - the tool we use to measure stuttering in gaming due to dropped or runt frames. The FCAT process requires enabling a color-based overlay onto a game, recording the gameplay, and then parsing the video file through the analysis software. The software is mostly single-threaded, however because the video is basically in a raw format, the file size is large and requires moving a lot of data around. For our test, we take a 90-second clip of the Rise of the Tomb Raider benchmark running on a GTX 980 Ti at 1440p, which comes in around 21 GB, and measure the time it takes to process through the visual analysis tool.
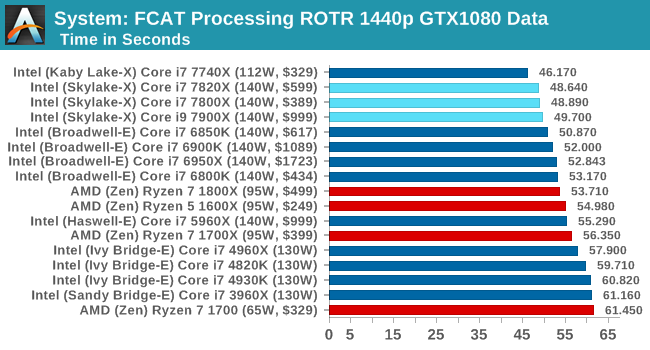
FCAT takes in a frame, processes it and dumps it, all on a single thread. The quicker you get through the workload the better, and frequency is supreme, hence we get the 7820X followed by the 7800X then the 7900X. Even though the 7900X has the higher turbo here, the results are with the margin expected.
3D Particle Movement v2.1
This is the latest version of the self-penned 3DPM benchmark. The goal of 3DPM is to simulate semi-optimized scientific algorithms taken directly from my doctorate thesis. Version 2.1 improves over 2.0 by passing the main particle structs by reference rather than by value, and decreasing the amount of double->float->double recasts the compiler was adding in. It affords a ~25% speed-up over v2.0, which means new data.
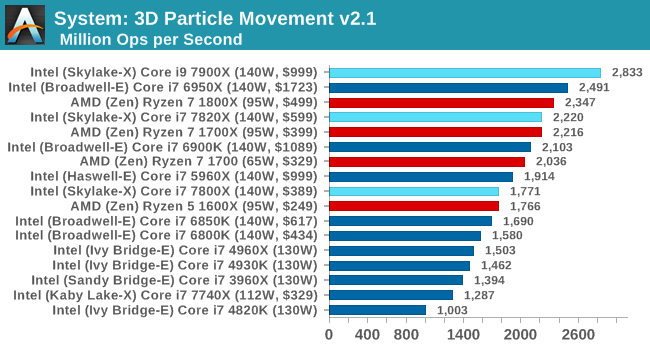
Give 3DPMv2.1 some cores, and it will show you the world / some numbers. The 1800X and 6950X were gunning for top spot, but the extra frequency of the 7900X wins here.
DigiCortex 1.20
Despite being a couple of years old, the DigiCortex software is a pet project for the visualization of neuron and synapse activity in the brain. The software comes with a variety of benchmark modes, and we take the small benchmark which runs a 32k neuron/1.8B synapse simulation. The results on the output are given as a fraction of whether the system can simulate in real-time, so anything above a value of one is suitable for real-time work. The benchmark offers a 'no firing synapse' mode, which in essence detects DRAM and bus speed, however we take the firing mode which adds CPU work with every firing.
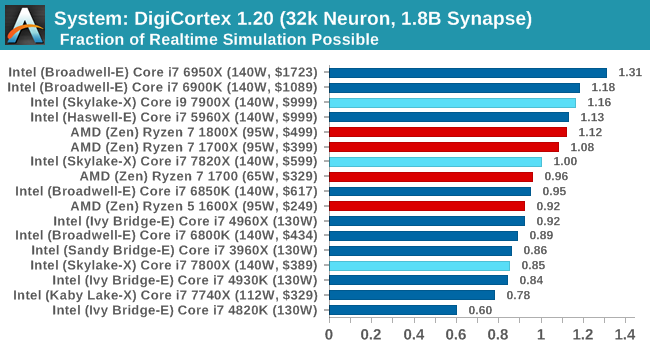
DigiCortex loves a bit of memory, although when speaking with the developer, there can some instances where the beast needs to be fed. Losing the inclusive L3 might be a factor here, especially with the 7800X all the way down.
Agisoft Photoscan 1.0
Photoscan stays in our benchmark suite from the previous version, however now we are running on Windows 10 so features such as Speed Shift on the latest processors come into play. The concept of Photoscan is translating many 2D images into a 3D model - so the more detailed the images, and the more you have, the better the model. The algorithm has four stages, some single threaded and some multi-threaded, along with some cache/memory dependency in there as well. For some of the more variable threaded workload, features such as Speed Shift and XFR will be able to take advantage of CPU stalls or downtime, giving sizeable speedups on newer microarchitectures.
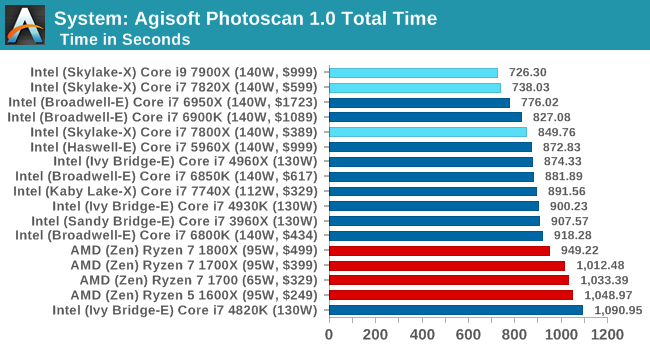
Photoscan is a mixed bag of operations, going through single thread sections to multithread and a range of cache/memory bandwidth requirepements. There's not much difference between thw 10 core and the 8 core, but the frequency helps against Broadwell-E.


264 Comments
View All Comments
AnandTechReader2017 - Monday, June 19, 2017 - link
And no load/idle? And clockspeed at full load?Also, no mention of Intel drawing more than the rated load?
AnandTechReader2017 - Monday, June 19, 2017 - link
Sorry, missed the paragraph under on refresh.wolfemane - Monday, June 19, 2017 - link
Seriously... you don't post gaming results because of bios issues? Seems RYZEN had issues due to premature bios as well but that sure as hell didn't keep you all from posting results anyways.I was going to give kudos to you guys as I was reading the article for excluding gaming reaults on workstation CPU's. But nope, you had to add that little blurb there at the end.
Pretty god damn shameful if you ask me. Post the results, then do a follow up when venders get their crap together and release reliable bios. The same venders that blamed AMD for their inability to create half way decent bios.
Ryan Smith - Monday, June 19, 2017 - link
Unfortunately it's a bit of a damned if you do, damned if you don't situation for us. The Skylake-X platform is still quite immature in some respects, and Intel did not give us a ton of lead-time in testing it. The BIOSes only came in a bit before Ian had to get on a plane. So we've been racing the clock for the past week trying to pull things together.What we do have are a set of incomplete data that still shows some issues. But we need time to further validate that data, and even more time to write about it. Both of which have been in short supply over the last few days.
Mentioning gaming at all is because we wanted to point out that there are still issues, and that anyone who is primarily interested in gaming is likely best served by waiting, rather than jumping on Intel's pre-orders.
wolfemane - Monday, June 19, 2017 - link
I GET where you are coming from. But you (Anandtech) had no issues posting AMD Ryzen results knowing full well that the x370 platform was far *FAR* from mature. Anandtech and other reviewers didn't hesitate to mention all the bugs possibly holding the platform back. But you still posted the results. As you should have.Ian Cutress - Monday, June 19, 2017 - link
Err, what? Our Ryzen 7 review did not have gaming benchmarks.http://www.anandtech.com/show/11170/the-amd-zen-an...
wolfemane - Monday, June 19, 2017 - link
Well... guess how incredibly stupid I feel? If I could retract my comment I would. I'll go reread the launch review again.cheshirster - Monday, June 19, 2017 - link
No need to apologizeHere are gaming tests on DDR4-3000 @ 2400 downclocked memory
With Ryzens BADLY underperforming in RoTR and Rocket League pretty much published
http://www.anandtech.com/show/11244/the-amd-ryzen-...
And for Intel they write this
"Our GTX1080 seems to be hit the hardest out of our four GPUs, as well as Civilization 6, the second Rise of the Tomb Raider test, and Rocket League on all GPUs. As a result, we only posted a minor selection of results, most of which show good parity at 4K"
DanNeely - Monday, June 19, 2017 - link
Check the dates; that was published about 5 weeks after the initial Zen review that Ian linked to above. The initial one didn't have any gaming data yet; because in both cases the release day situation was too broken.melgross - Monday, June 19, 2017 - link
Yeah, it's usually considered to be proper to first read about what you're commenting upon.