The Intel Skylake-X Review: Core i9 7900X, i7 7820X and i7 7800X Tested
by Ian Cutress on June 19, 2017 9:01 AM ESTBenchmarking Performance: CPU Rendering Tests
Rendering tests are a long-time favorite of reviewers and benchmarkers, as the code used by rendering packages is usually highly optimized to squeeze every little bit of performance out. Sometimes rendering programs end up being heavily memory dependent as well - when you have that many threads flying about with a ton of data, having low latency memory can be key to everything. Here we take a few of the usual rendering packages under Windows 10, as well as a few new interesting benchmarks.
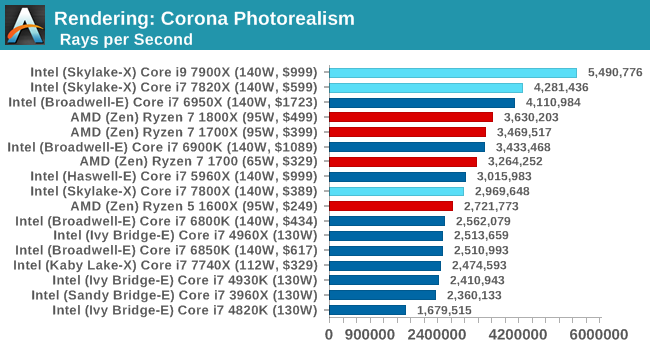
Corona 1.3
Corona is a standalone package designed to assist software like 3ds Max and Maya with photorealism via ray tracing. It's simple - shoot rays, get pixels. OK, it's more complicated than that, but the benchmark renders a fixed scene six times and offers results in terms of time and rays per second. The official benchmark tables list user submitted results in terms of time, however I feel rays per second is a better metric (in general, scores where higher is better seem to be easier to explain anyway). Corona likes to pile on the threads, so the results end up being very staggered based on thread count.
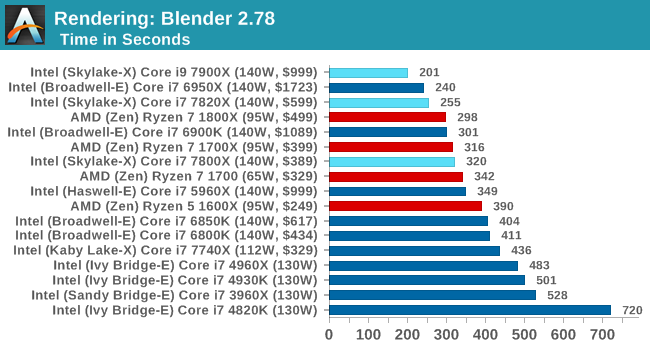
Blender 2.78
For a render that has been around for what seems like ages, Blender is still a highly popular tool. We managed to wrap up a standard workload into the February 5 nightly build of Blender and measure the time it takes to render the first frame of the scene. Being one of the bigger open source tools out there, it means both AMD and Intel work actively to help improve the codebase, for better or for worse on their own/each other's microarchitecture.
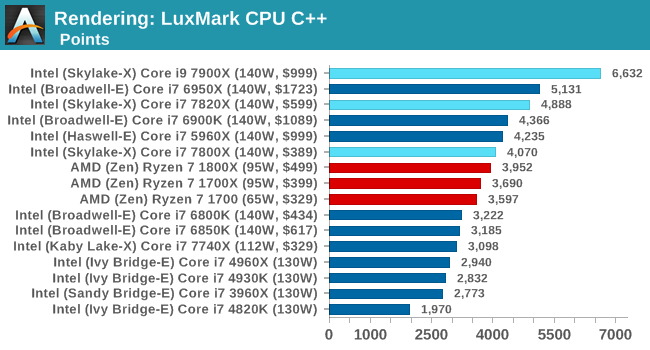
LuxMark
As a synthetic, LuxMark might come across as somewhat arbitrary as a renderer, given that it's mainly used to test GPUs, but it does offer both an OpenCL and a standard C++ mode. In this instance, aside from seeing the comparison in each coding mode for cores and IPC, we also get to see the difference in performance moving from a C++ based code-stack to an OpenCL one with a CPU as the main host.
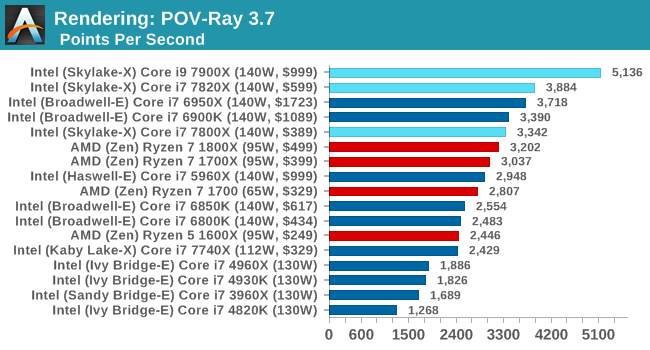
POV-Ray 3.7b3
Another regular benchmark in most suites, POV-Ray is another ray-tracer but has been around for many years. It just so happens that during the run up to AMD's Ryzen launch, the code base started to get active again with developers making changes to the code and pushing out updates. Our version and benchmarking started just before that was happening, but given time we will see where the POV-Ray code ends up and adjust in due course.
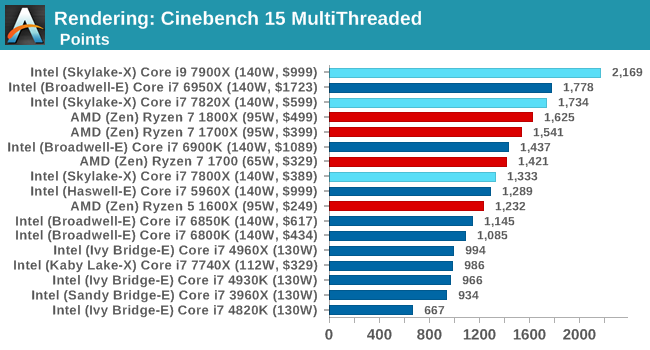
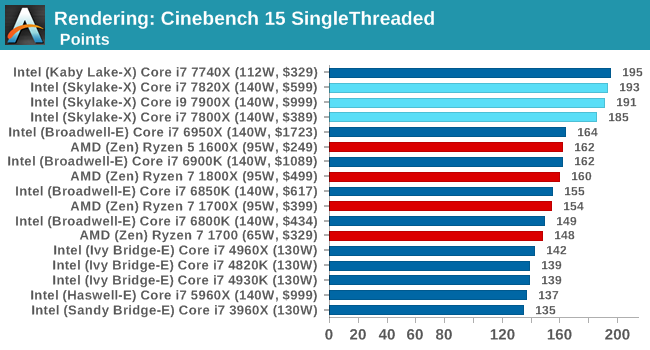
Cinebench R15
The latest version of CineBench has also become one of those 'used everywhere' benchmarks, particularly as an indicator of single thread performance. High IPC and high frequency gives performance in ST, whereas having good scaling and many cores is where the MT test wins out.


264 Comments
View All Comments
Ian Cutress - Monday, June 19, 2017 - link
Didn't get a chance to do overclocking. Testing 5 chips rather than one chip in less than a week (with BIOS issues) means I haven't slept much, and now I'm at a different event half way around the world.Ian Cutress - Monday, June 19, 2017 - link
I should add I have some 5 GHz numbers on Kaby i7. I need to find time to write but I'm fully booked today :(FreckledTrout - Monday, June 19, 2017 - link
Cool! (Pun intended)AnandTechReader2017 - Tuesday, June 20, 2017 - link
Could you also test with Speedshift on/off? Would be interesting how much of an impact it has.lefty2 - Monday, June 19, 2017 - link
One thing that is never covered by any of these reviews is the efficiency of the CPU. If you measure performance of a benchmark, then divide by the the power used in said benchmark, you will see the most efficient CPU by far is the R7 1700. All Intel Skylake-X and Kaby Lake CPUs are far less efficient (also the R7 1800X for that matter).Archie2085 - Monday, June 19, 2017 - link
@BrokenCrayonsOops .. I did not realise how odd it looked.
On a different note . tom's hardware a sister site has done a balanced review including gaming benches.. Still looks like a rushed product :)
Intel has to work on that god awful "TIM"
AnandTechReader2017 - Tuesday, June 20, 2017 - link
Wouldn't trust toms hardware since that fiasco with only Intel chips recommended for everything when the R7 1700 was clearly better a better choice.lordken - Wednesday, July 19, 2017 - link
though they do include ryzen as of next update to their CPU recommend guide. They probably re-evaluated after that shitstorm in their comments :)btw how that fits into your perspective? If they are intel biased how that they did beat i9 quite nicely.
Though I was surprised also that AT didn't talk more about power and heat issues as I did first read Toms article http://www.tomshardware.com/reviews/-intel-skylake... and after I had good lols especially after reading this fabulous line
"Ultimately, we’re looking at power consumption numbers similar to some high-end graphics cards when we start messing with Skylake-X. AMD’s FX-9590X doesn’t even come close to these results"
I came here and was surprised to not read anything here, as thermals and heat looks to be pretty tragic...
If AMD would came up with such space heater it would be all over the place...but since its intel it seems to be no issue.
Kevin G - Monday, June 19, 2017 - link
I would be hesitate to indicate that the memory controller's size is tied the same size as a CPU core for tiling purposes. Intel could easily produce a double wide, half height memory controller and place them at the ends of a column. Intel could also start putting memory controllers on two routers to remove a hop-or-two to cut down on latencies on-die. Ditto for coherecy links and IO controllers. They don't have to be rectangular and the same size of a core for optimal placement.In your mock up of the 5x6 arrangement, there is a lot of wasted space that could be negated if Intel were to re-arrange the dimensions of the IO and memory controllers a bit. Your estimate of a 677 mm^2 is spot on with what you've gone but there is incredible pressure to reduce such huge dies to make them easier to manufacturer. There is simplicity in keeping IO and memory controllers the same size as a core for rapid construction of the entire die but I think the trade off would favor smaller die size here.
Communism - Monday, June 19, 2017 - link
If you are going to post "power consumption" and "power efficiency" graphs/analysis, you need to post the performance from the "power consumption" test itself, or else it's pretty pointless when comparing vastly different CPUs.You mentioned you tested power consumption with prime95.
I'd wager the intel has a hilariously high performance per watt in prime95 as it would likely be using avx2 instructions (and the massive memory bandwidth of the cache as well as the massive memory bandwidth of the main memory/IMC combination if you are using larger dataset option).
I wonder how many hundreds of pages of AMD shill posts that this post will be buried under within hours :P
Oh well, any actual readers should wait for a DigitalFoundry review whenever that happens to come out if you want useful game testing results anyways.