The Intel Kaby Lake-X i7 7740X and i5 7640X Review: The New Single-Threaded Champion, OC to 5GHz
by Ian Cutress on July 24, 2017 8:30 AM EST- Posted in
- CPUs
- Intel
- Kaby Lake
- X299
- Basin Falls
- Kaby Lake-X
- i7-7740X
- i5-7640X
Benchmarking Performance: CPU Office Tests
The office programs we use for benchmarking aren't specific programs per-se, but industry standard tests that hold weight with professionals. The goal of these tests is to use an array of software and techniques that a typical office user might encounter, such as video conferencing, document editing, architectural modeling, and so on and so forth.
All of our benchmark results can also be found in our benchmark engine, Bench.
Chromium Compile (v56)
Our new compilation test uses Windows 10 Pro, VS Community 2015.3 with the Win10 SDK to compile a nightly build of Chromium. We've fixed the test for a build in late March 2017, and we run a fresh full compile in our test. Compilation is the typical example given of a variable threaded workload - some of the compile and linking is linear, whereas other parts are multithreaded.
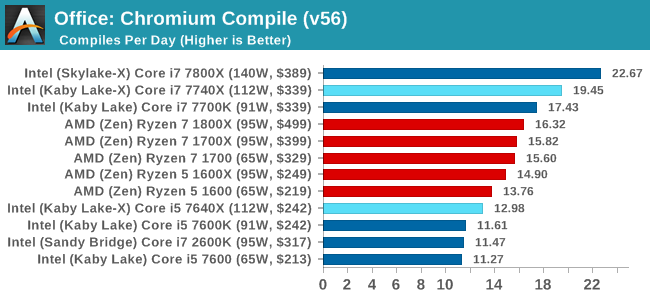
Our Chrome Compile test is a mix of load, but also loves L3 cache. We've seen before that the L3 victim cache on AMD can be a defecit here, but even then the Core i5 cannot overcome the 3:1 thread deficit to the Ryzen 5 CPUs. The Core i7-7740X hits the nail on the head for threads and single thread performance, although users that play in this space would look straight to the Core i7-7800X, and likely decide that +16.5% better performance is worth the +18.2% extra cost.
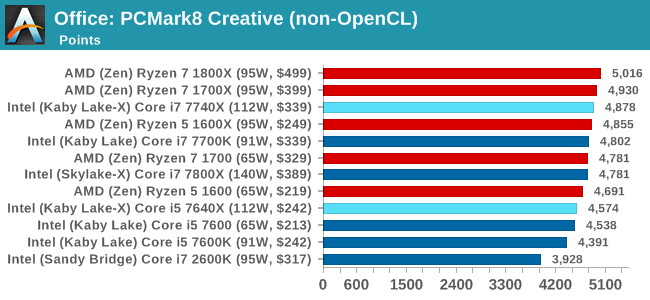
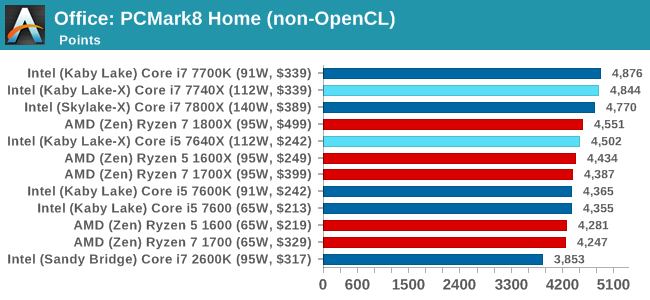
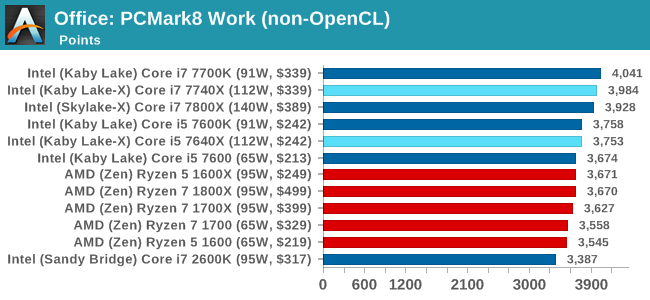
PCMark8: link
Despite originally coming out in 2008/2009, Futuremark has maintained PCMark8 to remain relevant in 2017. On the scale of complicated tasks, PCMark focuses more on the low-to-mid range of professional workloads, making it a good indicator for what people consider 'office' work. We run the benchmark from the commandline in 'conventional' mode, meaning C++ over OpenCL, to remove the graphics card from the equation and focus purely on the CPU. PCMark8 offers Home, Work and Creative workloads, with some software tests shared and others unique to each benchmark set.
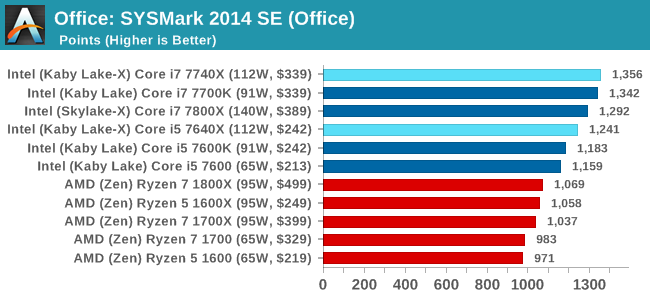
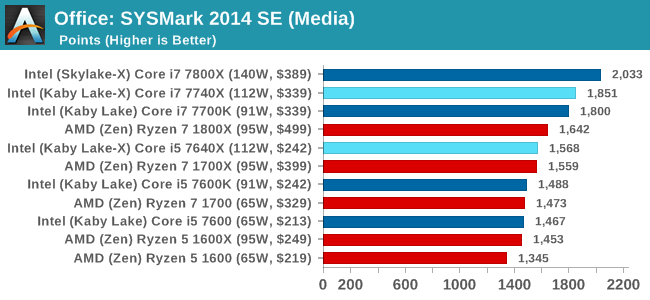
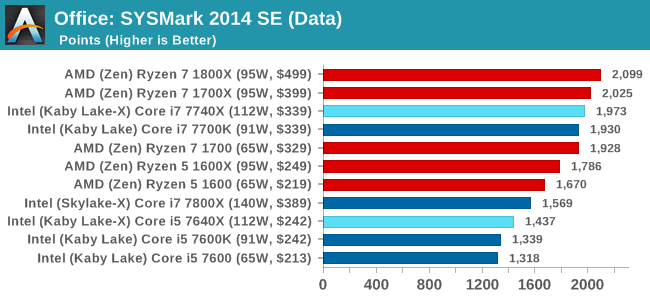
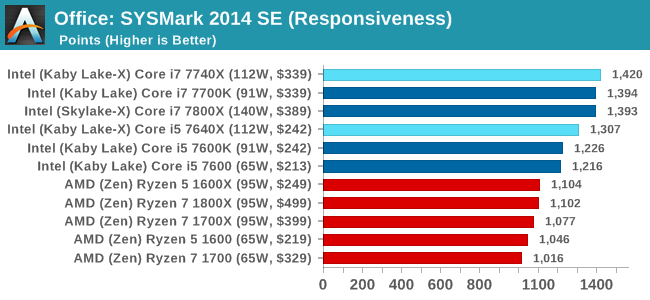
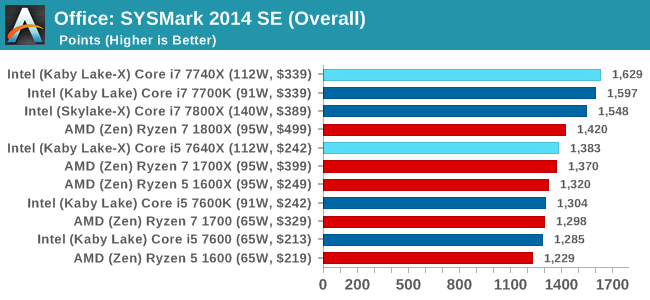
SYSmark 2014 SE: link
SYSmark is developed by Bapco, a consortium of industry CPU companies. The goal of SYSmark is to take stripped down versions of popular software, such as Photoshop and Onenote, and measure how long it takes to process certain tasks within that software. The end result is a score for each of the three segments (Office, Media, Data) as well as an overall score. Here a reference system (Core i3-6100, 4GB DDR3, 256GB SSD, Integrated HD 530 graphics) is used to provide a baseline score of 1000 in each test.
A note on context for these numbers. AMD left Bapco in the last two years, due to differences of opinion on how the benchmarking suites were chosen and AMD believed the tests are angled towards Intel processors and had optimizations to show bigger differences than what AMD felt was present. The following benchmarks are provided as data, but the conflict of opinion between the two companies on the validity of the benchmark is provided as context for the following numbers.


176 Comments
View All Comments
Ian Cutress - Monday, July 24, 2017 - link
In the way everyone has historically been reporting PCIe lanes, Ryzen only has 16 PCIe lanes intended for graphics, with the other four for the chipset and another four for storage as an SoC. We've repeated this over and over and over again. Same with Threadripper: 60, plus four for chipset. If we're going to start counting PCIe lanes for chipsets (and DMI equivalents) and SoC related PCIe lanes for storage and others, we'll have to go and rewrite the PCIe lane counts for the last several generations of Intel and AMD CPUs.Kalelovil - Monday, July 24, 2017 - link
If the category is PCIe lanes for graphics that is quite right.But by that token doesn't (non cut-down) Broadwell-E/Skylake-E only have 32 lanes intended for graphics, as the switching logic allows for 2x16 and 4x8 configurations.
Although this is getting quite in-the-weeds. Overall I really appreciate the time and effort put into PC component reviews by the Anandtech staff.
FreckledTrout - Monday, July 24, 2017 - link
I agree with Ian as 4 PCIe lanes are always taken since you are running Ryzen with a chipset with no real way around that. I also would agree with say Skylake-x reporting 4 less PCIe lanes for the DMI link.Trenteth - Wednesday, July 26, 2017 - link
except Ryzen has 16x GPU lanes, $x to the chipset and 4x diect to an NVMe or U.2 drive. it's 20 PCIe 3.0 lanes off the CPU usable.Notmyusualid - Tuesday, July 25, 2017 - link
I got 40 lanes on my E5-2690.I'm running 4x 1070s on that, and PCIe based storage, and I doubled my throughput by moving the SSD to a riser card (until the 4th GPU went in), which means its back on the m/b.
Though, you can't notice in everyday use. Oddly.
Trenteth - Wednesday, July 26, 2017 - link
Having the 4x PCIe 3.0 lanes for a NVMe drive is an advantage, it's connected directly to the CPU and bypasses the chipset link which allows more bandwidth for USB/PCIe 2.0 lanes and SATA. I don't agree with you on not counting them.Kalelovil - Monday, July 24, 2017 - link
Your charts seem to label the i7 7740X with a $329 MSRP.In contrast your first page (and Intel ARK) lists a $339-$350 MSRP.
I assume the former is a mistake?
Ian Cutress - Monday, July 24, 2017 - link
$339 is the 1k tray price - the one that Intel quotes in the price lists and applicable if you buy 1000 OEM CPUs. $350 is MSRP that retailers will apply from their stock from distributors. Add more if you want a cooler. The issue here is that sometimes Intel never quotes an MSRP for some OEM-only processors, and AMD never seem to quote tray/OEM prices for retail parts. I'll edit this and make it clearer.Kalelovil - Monday, July 24, 2017 - link
Oh, by former I was referring to the $329 in your charts not the $339 on ARKIan Cutress - Monday, July 24, 2017 - link
Oops, I misread the price and misread your comment. Graphs should be updated with a cache refresh.