The Intel Kaby Lake-X i7 7740X and i5 7640X Review: The New Single-Threaded Champion, OC to 5GHz
by Ian Cutress on July 24, 2017 8:30 AM EST- Posted in
- CPUs
- Intel
- Kaby Lake
- X299
- Basin Falls
- Kaby Lake-X
- i7-7740X
- i5-7640X
Rocket League
Hilariously simple pick-up-and-play games are great fun. I'm a massive fan of the Katamari franchise for that reason — passing start on a controller and rolling around, picking up things to get bigger, is extremely simple. Until we get a PC version of Katamari that I can benchmark, we'll focus on Rocket League.
Rocket League combines the elements of pick-up-and-play, allowing users to jump into a game with other people (or bots) to play football with cars with zero rules. The title is built on Unreal Engine 3, which is somewhat old at this point, but it allows users to run the game on super-low-end systems while still taxing the big ones. Since the release in 2015, it has sold over 5 million copies and seems to be a fixture at LANs and game shows. Users who train get very serious, playing in teams and leagues with very few settings to configure, and everyone is on the same level. Rocket League is quickly becoming one of the favored titles for e-sports tournaments, especially when e-sports contests can be viewed directly from the game interface.
Based on these factors, plus the fact that it is an extremely fun title to load and play, we set out to find the best way to benchmark it. Unfortunately for the most part automatic benchmark modes for games are few and far between. Partly because of this, but also on the basis that it is built on the Unreal 3 engine, Rocket League does not have a benchmark mode. In this case, we have to develop a consistent run and record the frame rate.
Read our initial analysis on our Rocket League benchmark on low-end graphics here.
With Rocket League, there is no benchmark mode, so we have to perform a series of automated actions, similar to a racing game having a fixed number of laps. We take the following approach: Using Fraps to record the time taken to show each frame (and the overall frame rates), we use an automation tool to set up a consistent 4v4 bot match on easy, with the system applying a series of inputs throughout the run, such as switching camera angles and driving around.
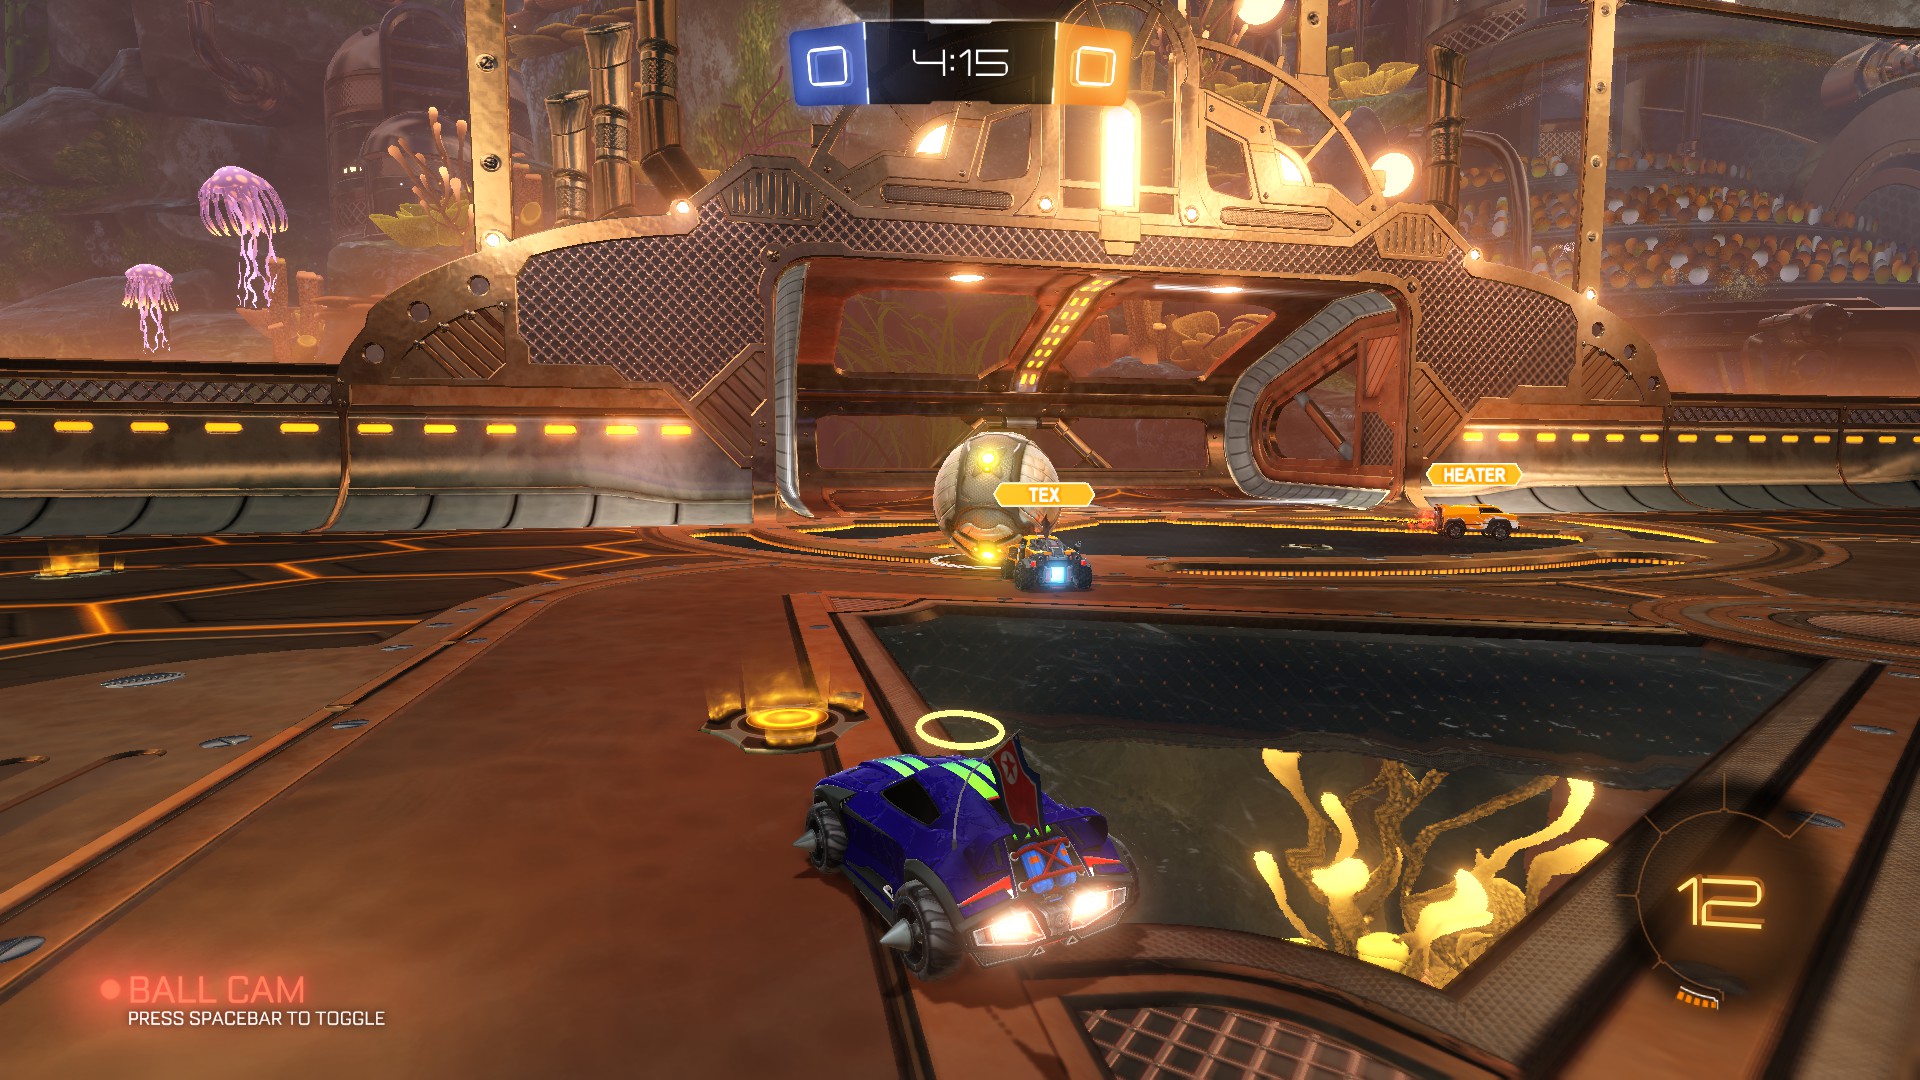
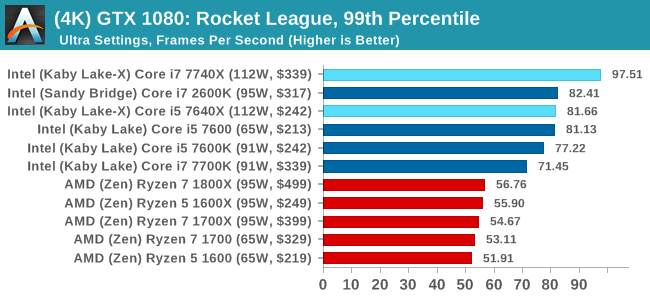
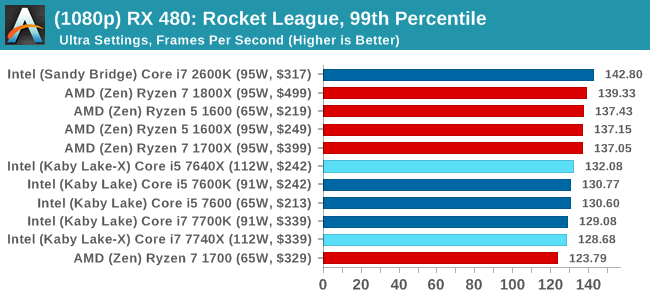
It turns out that this method is nicely indicative of a real bot match, driving up walls, boosting and even putting in the odd assist, save and/or goal, as weird as that sounds for an automated set of commands. To maintain consistency, the commands we apply are not random but time-fixed, and we also keep the map the same (Aquadome, known to be a tough map for GPUs due to water/transparency) and the car customization constant. We start recording just after a match starts, and record for 4 minutes of game time (think 5 laps of a DIRT: Rally benchmark), with average frame rates, 99th percentile and frame times all provided.
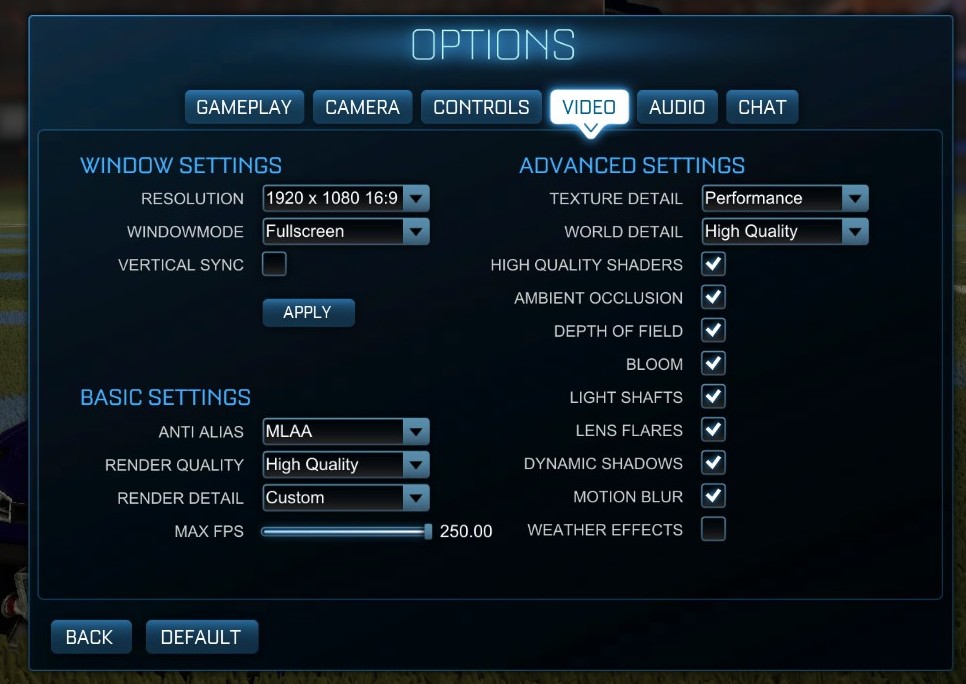
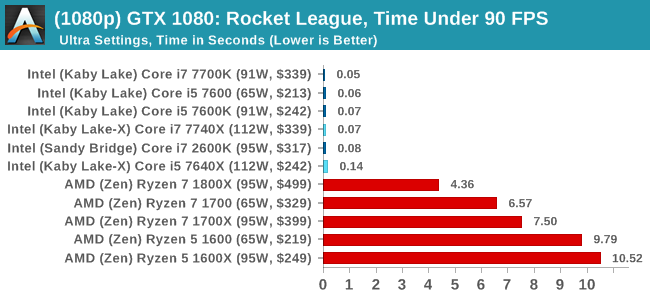
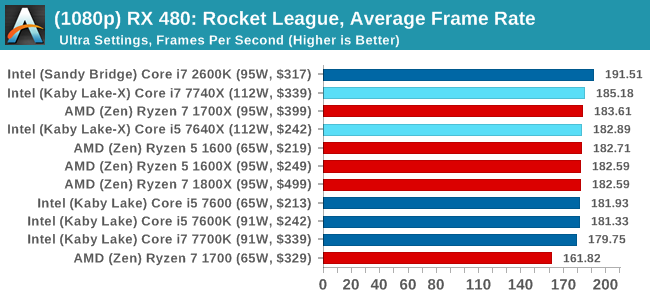
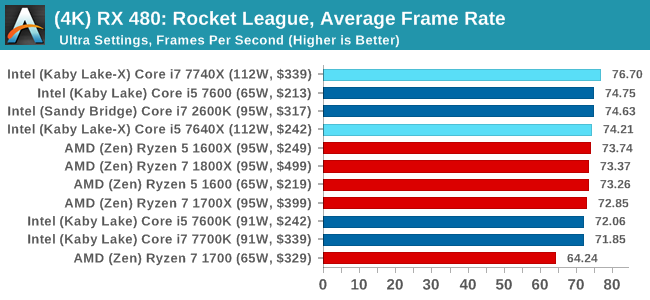
The graphics settings for Rocket League come in four broad, generic settings: Low, Medium, High and High FXAA. There are advanced settings in place for shadows and details; however, for these tests, we keep to the generic settings. For both 1920x1080 and 4K resolutions, we test at the High preset with an unlimited frame cap.
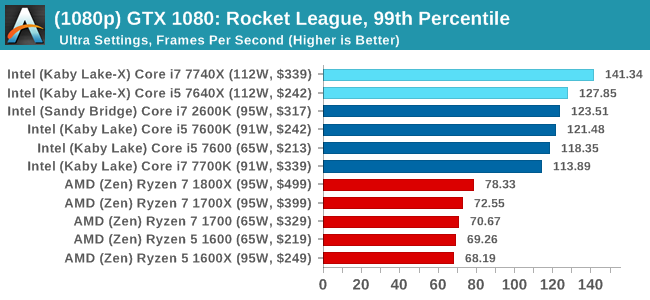
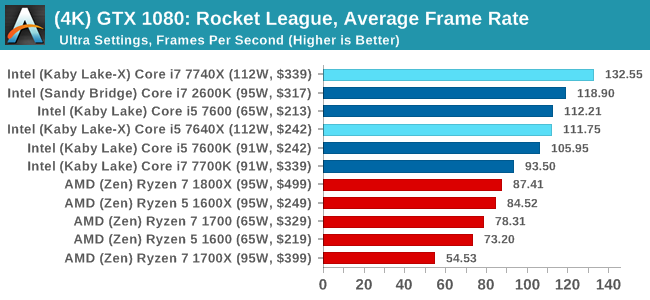
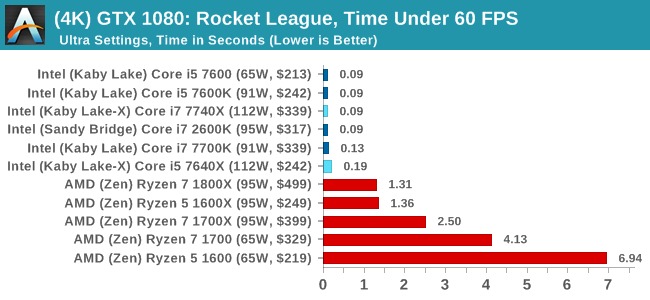
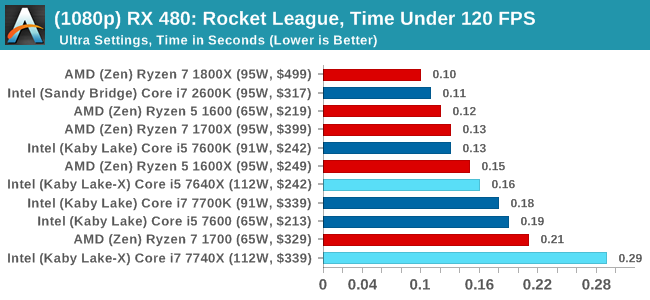
For all our results, we show the average frame rate at 1080p first. Mouse over the other graphs underneath to see 99th percentile frame rates and 'Time Under' graphs, as well as results for other resolutions. All of our benchmark results can also be found in our benchmark engine, Bench.
MSI GTX 1080 Gaming 8G Performance
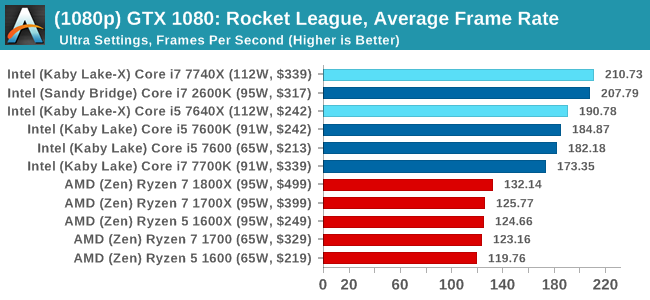
1080p
4K
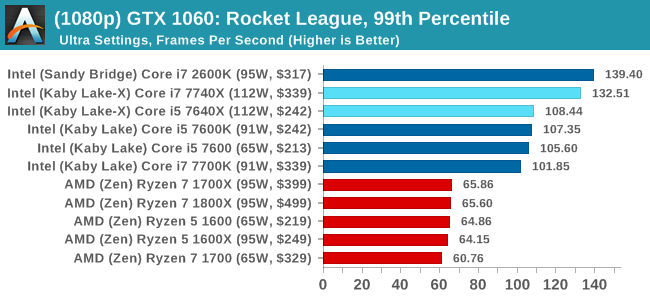
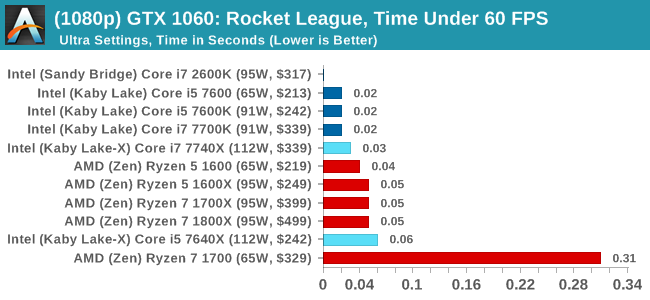
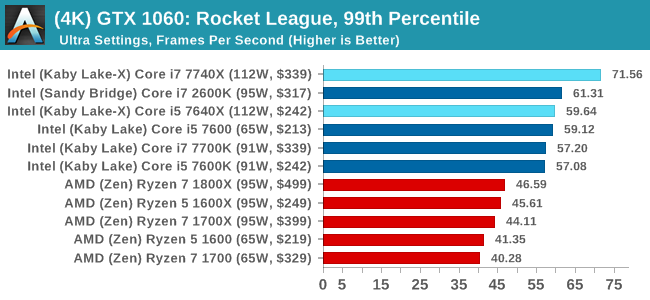
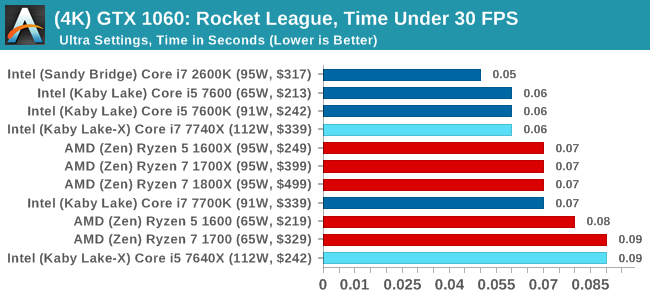
ASUS GTX 1060 Strix 6GB Performance
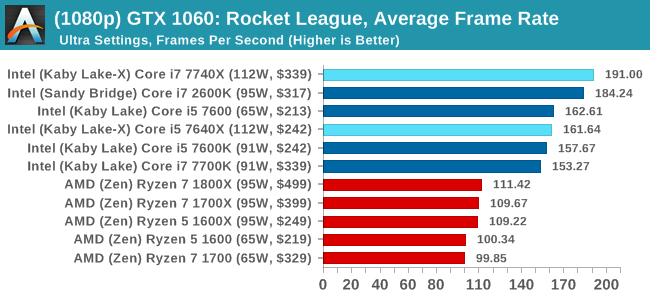
1080p
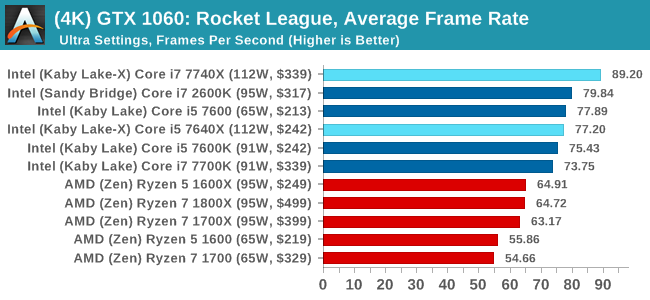
4K
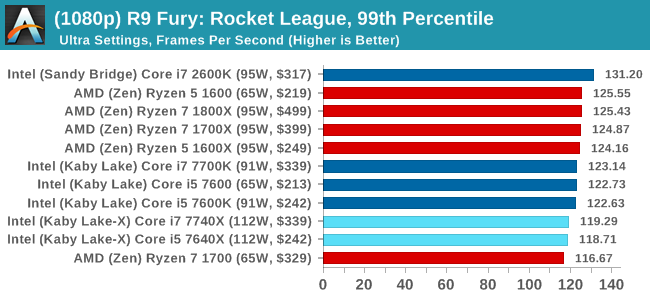
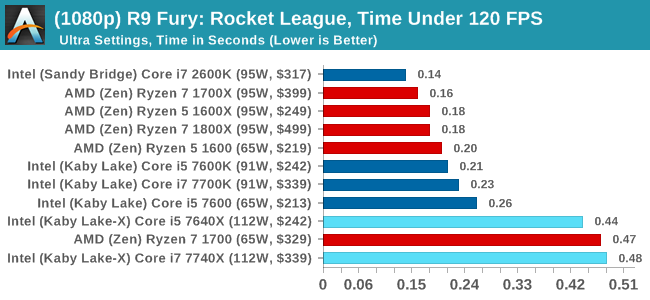
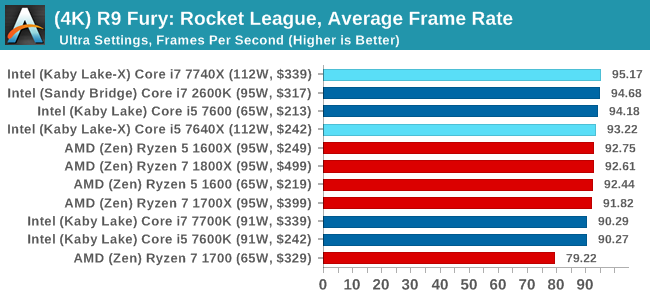
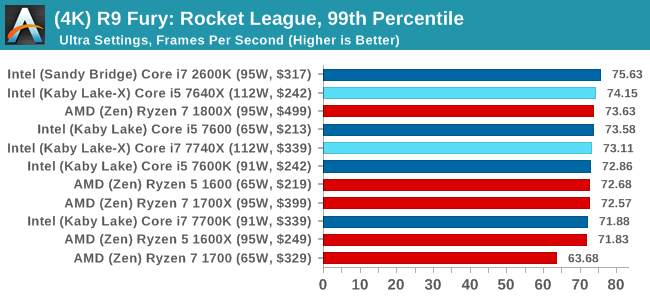
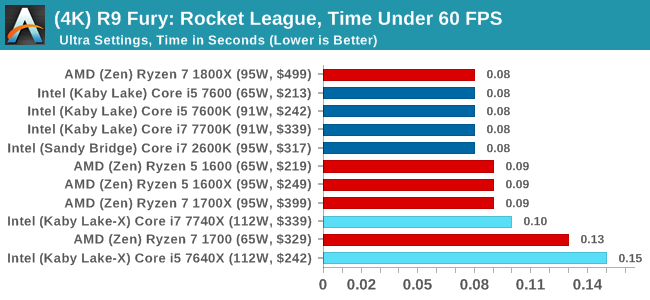
Sapphire R9 Fury 4GB Performance
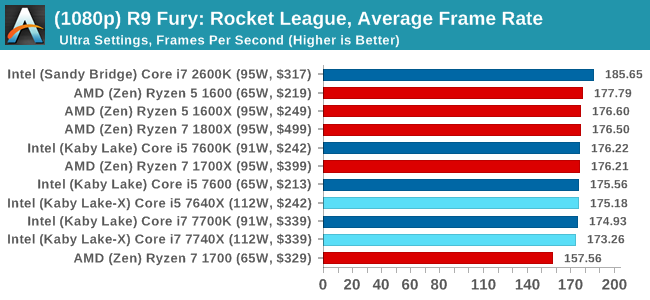
1080p
4K
Sapphire RX 480 8GB Performance
1080p
4K
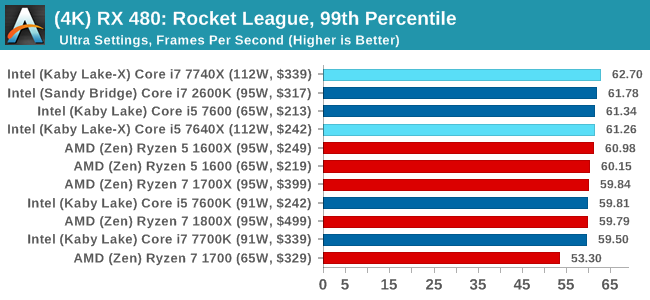
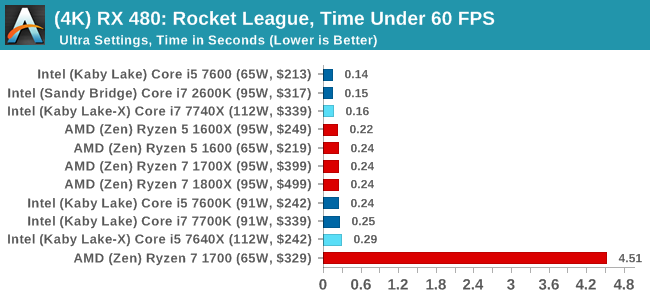
Rocket League Conclusions
The map we use in our testing, Aquadome, is known to be strenuous on a system, hence we see frame rates lower than what people expect for Rocket League - we're trying to cover the worst case scenario. But the results also show how AMD CPUs and NVIDIA GPUs do not seem to be playing ball with each other, which we've been told is likely related to drivers. The AMD GPUs work fine here regardless of resolution, and both AMD and Intel CPUs get in the mix.


176 Comments
View All Comments
Ian Cutress - Monday, July 24, 2017 - link
In the way everyone has historically been reporting PCIe lanes, Ryzen only has 16 PCIe lanes intended for graphics, with the other four for the chipset and another four for storage as an SoC. We've repeated this over and over and over again. Same with Threadripper: 60, plus four for chipset. If we're going to start counting PCIe lanes for chipsets (and DMI equivalents) and SoC related PCIe lanes for storage and others, we'll have to go and rewrite the PCIe lane counts for the last several generations of Intel and AMD CPUs.Kalelovil - Monday, July 24, 2017 - link
If the category is PCIe lanes for graphics that is quite right.But by that token doesn't (non cut-down) Broadwell-E/Skylake-E only have 32 lanes intended for graphics, as the switching logic allows for 2x16 and 4x8 configurations.
Although this is getting quite in-the-weeds. Overall I really appreciate the time and effort put into PC component reviews by the Anandtech staff.
FreckledTrout - Monday, July 24, 2017 - link
I agree with Ian as 4 PCIe lanes are always taken since you are running Ryzen with a chipset with no real way around that. I also would agree with say Skylake-x reporting 4 less PCIe lanes for the DMI link.Trenteth - Wednesday, July 26, 2017 - link
except Ryzen has 16x GPU lanes, $x to the chipset and 4x diect to an NVMe or U.2 drive. it's 20 PCIe 3.0 lanes off the CPU usable.Notmyusualid - Tuesday, July 25, 2017 - link
I got 40 lanes on my E5-2690.I'm running 4x 1070s on that, and PCIe based storage, and I doubled my throughput by moving the SSD to a riser card (until the 4th GPU went in), which means its back on the m/b.
Though, you can't notice in everyday use. Oddly.
Trenteth - Wednesday, July 26, 2017 - link
Having the 4x PCIe 3.0 lanes for a NVMe drive is an advantage, it's connected directly to the CPU and bypasses the chipset link which allows more bandwidth for USB/PCIe 2.0 lanes and SATA. I don't agree with you on not counting them.Kalelovil - Monday, July 24, 2017 - link
Your charts seem to label the i7 7740X with a $329 MSRP.In contrast your first page (and Intel ARK) lists a $339-$350 MSRP.
I assume the former is a mistake?
Ian Cutress - Monday, July 24, 2017 - link
$339 is the 1k tray price - the one that Intel quotes in the price lists and applicable if you buy 1000 OEM CPUs. $350 is MSRP that retailers will apply from their stock from distributors. Add more if you want a cooler. The issue here is that sometimes Intel never quotes an MSRP for some OEM-only processors, and AMD never seem to quote tray/OEM prices for retail parts. I'll edit this and make it clearer.Kalelovil - Monday, July 24, 2017 - link
Oh, by former I was referring to the $329 in your charts not the $339 on ARKIan Cutress - Monday, July 24, 2017 - link
Oops, I misread the price and misread your comment. Graphs should be updated with a cache refresh.