The Intel Kaby Lake-X i7 7740X and i5 7640X Review: The New Single-Threaded Champion, OC to 5GHz
by Ian Cutress on July 24, 2017 8:30 AM EST- Posted in
- CPUs
- Intel
- Kaby Lake
- X299
- Basin Falls
- Kaby Lake-X
- i7-7740X
- i5-7640X
Grand Theft Auto
The highly anticipated iteration of the Grand Theft Auto franchise hit the shelves on April 14th 2015, with both AMD and NVIDIA in tow to help optimize the title. GTA doesn’t provide graphical presets, but opens up the options to users and extends the boundaries by pushing even the hardest systems to the limit using Rockstar’s Advanced Game Engine under DirectX 11. Whether the user is flying high in the mountains with long draw distances or dealing with assorted trash in the city, when cranked up to maximum it creates stunning visuals but hard work for both the CPU and the GPU.
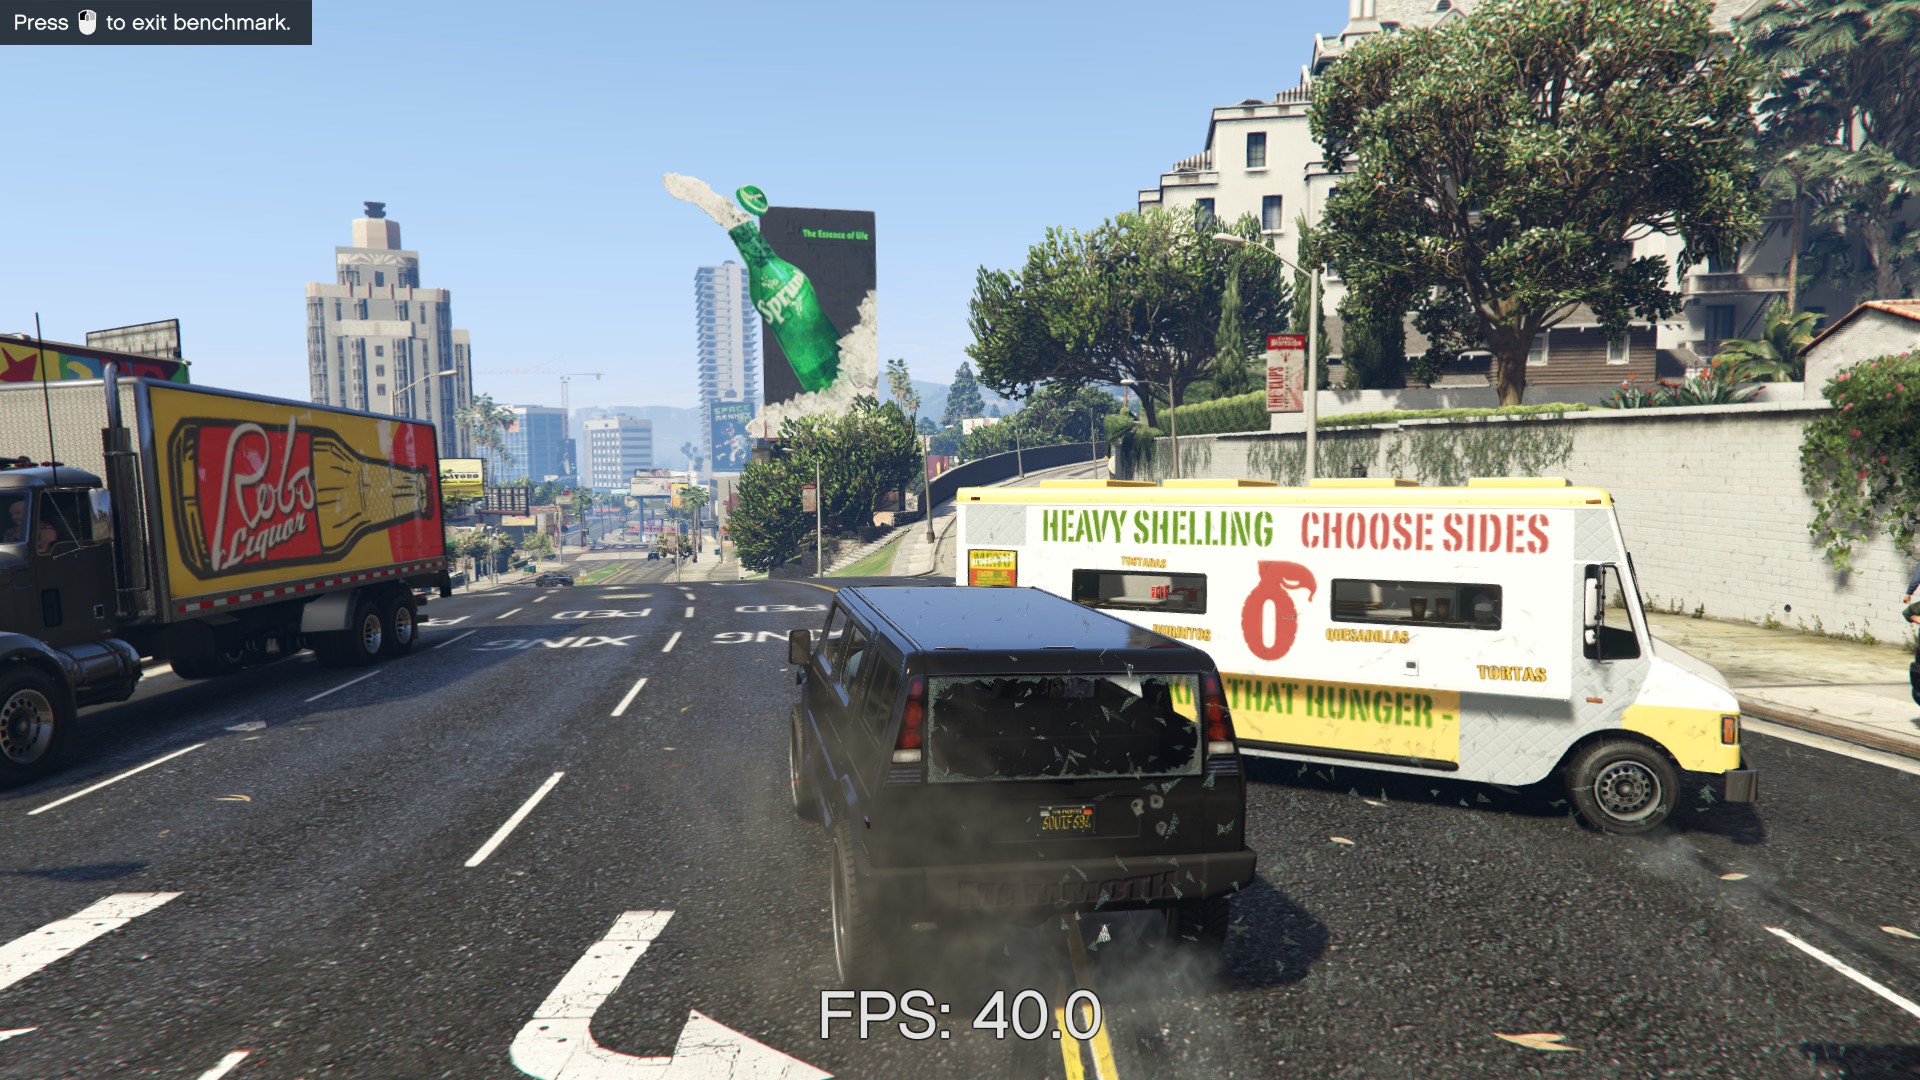
For our test we have scripted a version of the in-game benchmark. The in-game benchmark consists of five scenarios: four short panning shots with varying lighting and weather effects, and a fifth action sequence that lasts around 90 seconds. We use only the final part of the benchmark, which combines a flight scene in a jet followed by an inner city drive-by through several intersections followed by ramming a tanker that explodes, causing other cars to explode as well. This is a mix of distance rendering followed by a detailed near-rendering action sequence, and the title thankfully spits out frame time data.
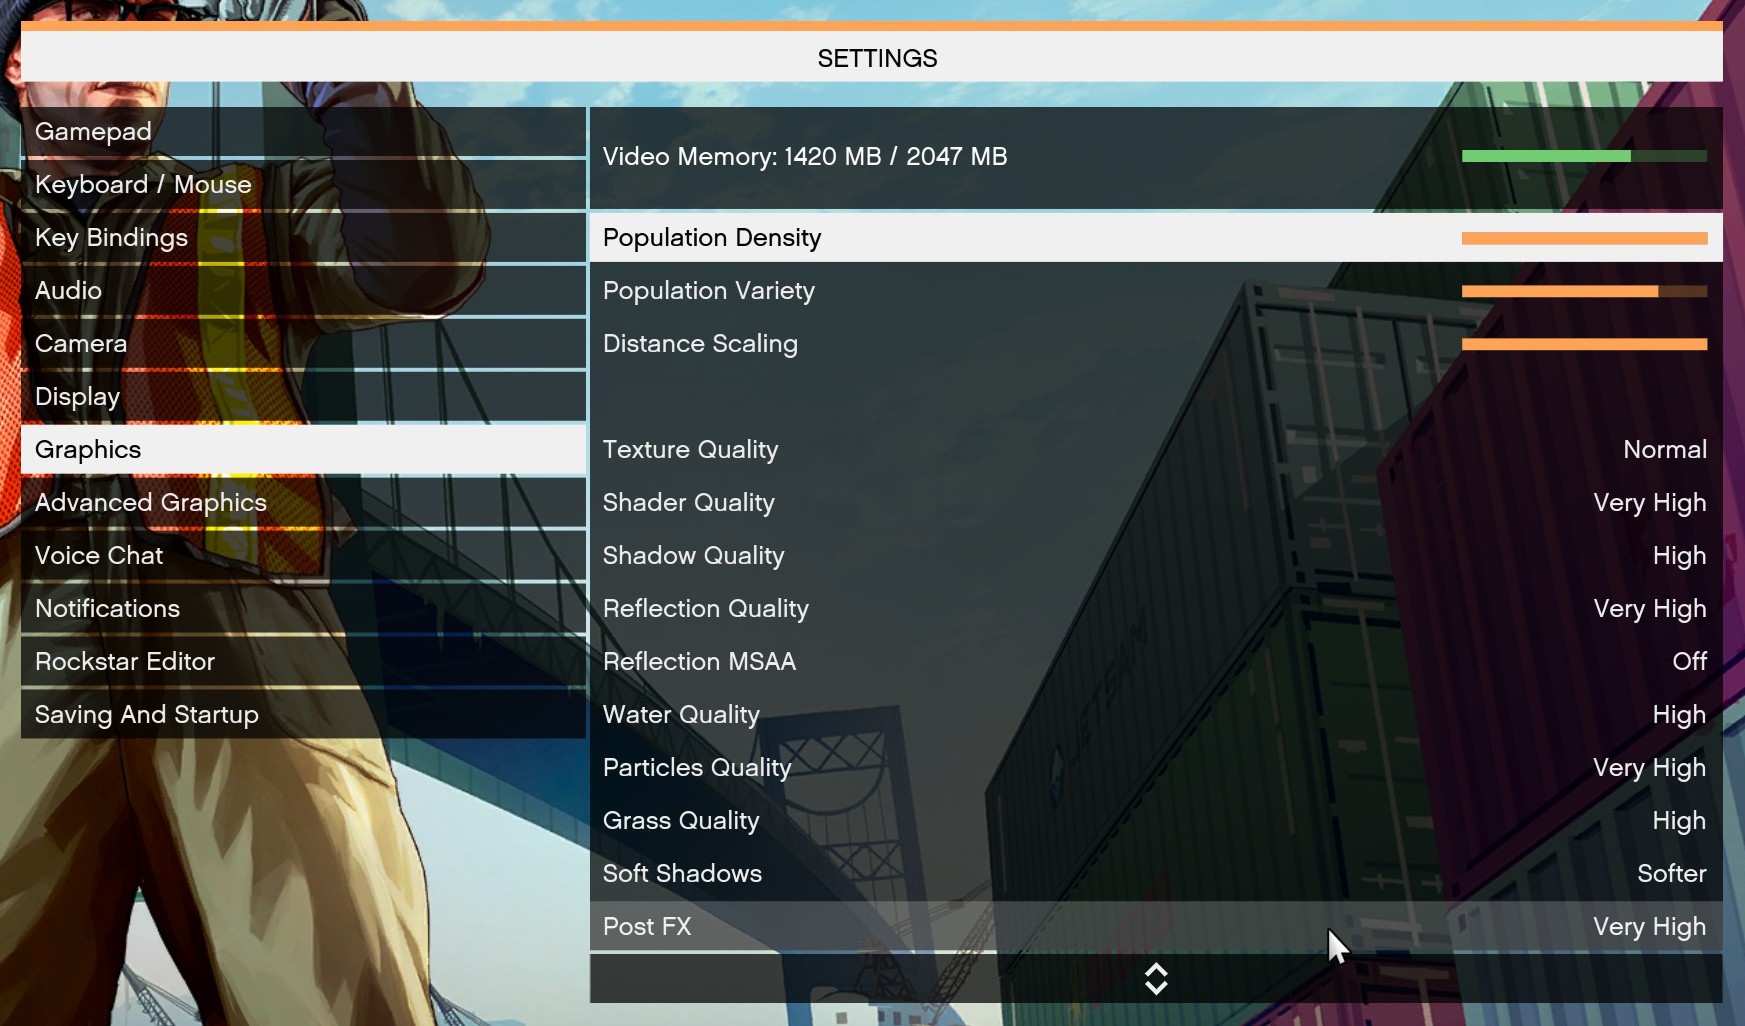
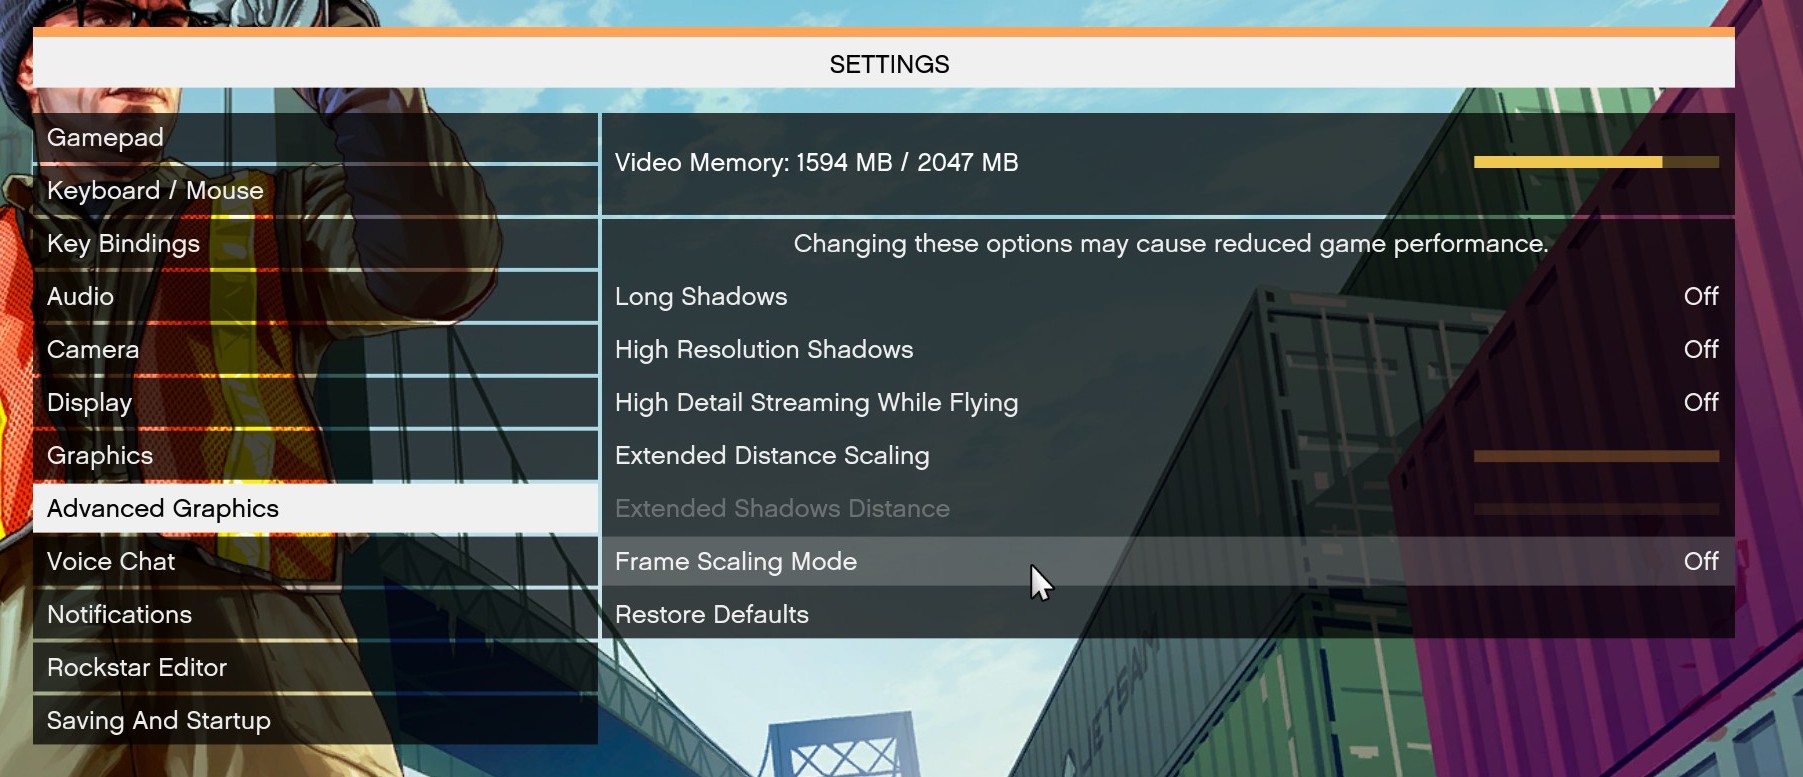
There are no presets for the graphics options on GTA, allowing the user to adjust options such as population density and distance scaling on sliders, but others such as texture/shadow/shader/water quality from Low to Very High. Other options include MSAA, soft shadows, post effects, shadow resolution and extended draw distance options. There is a handy option at the top which shows how much video memory the options are expected to consume, with obvious repercussions if a user requests more video memory than is present on the card (although there’s no obvious indication if you have a low end GPU with lots of GPU memory, like an R7 240 4GB).
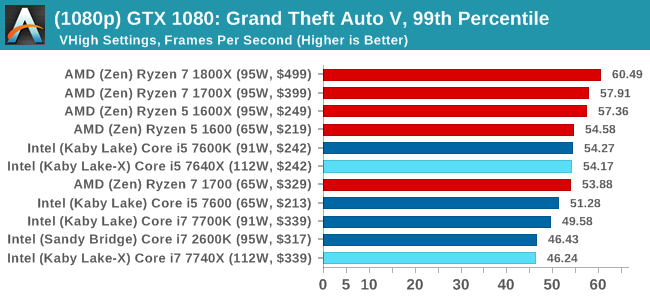
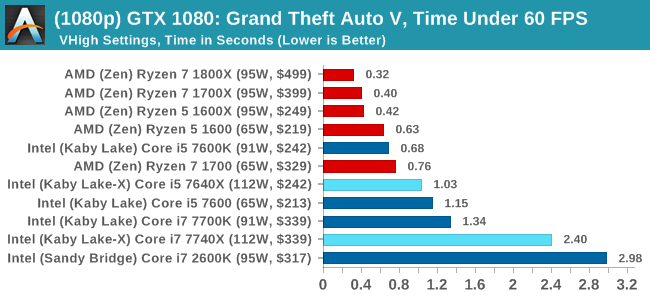
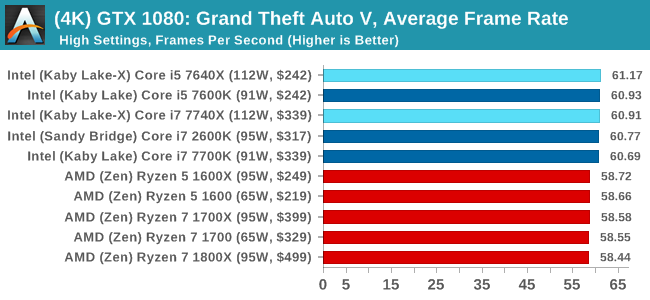
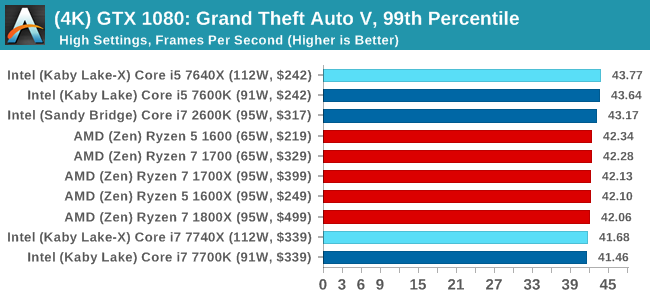
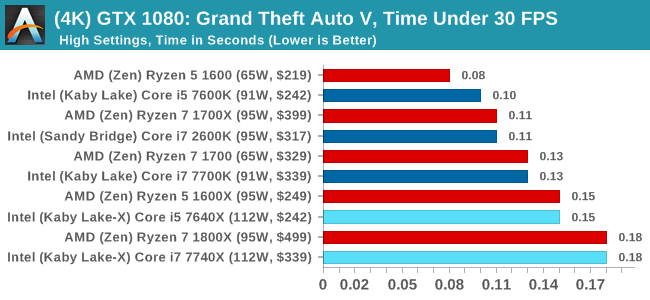
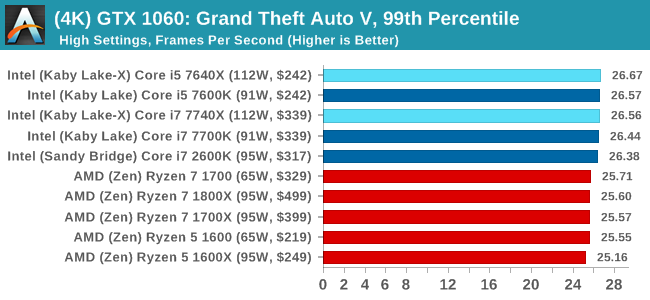
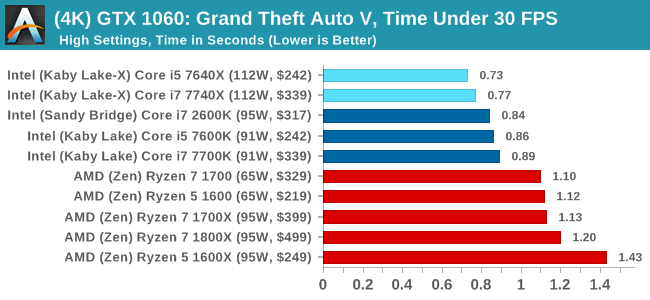
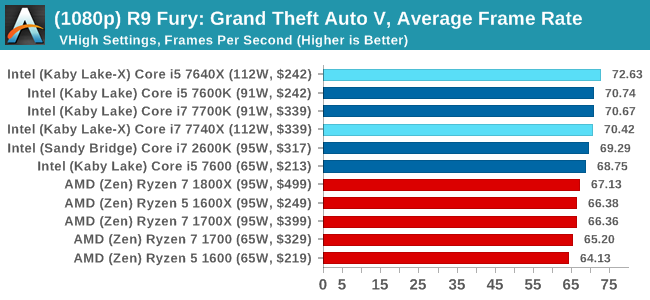
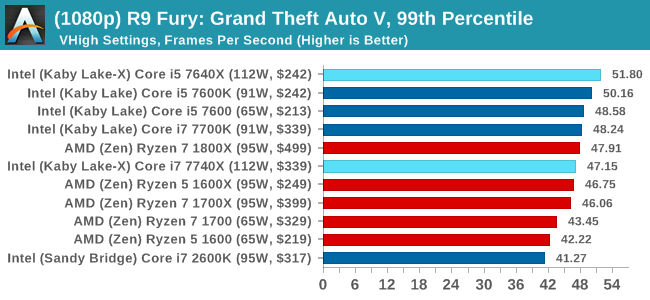
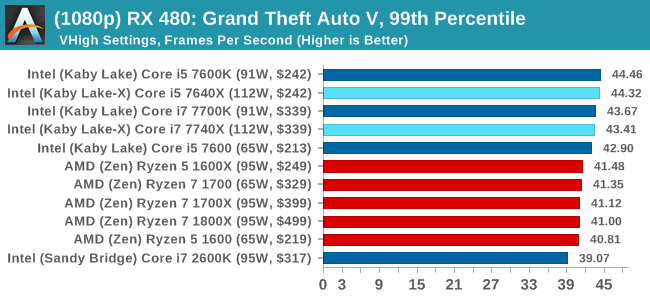
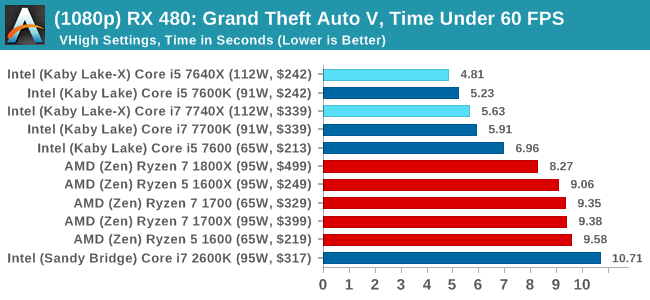
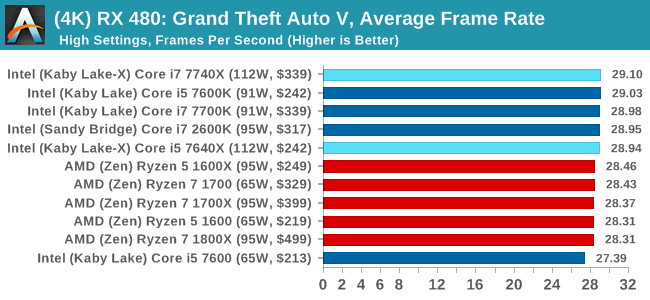
To that end, we run the benchmark at 1920x1080 using an average of Very High on the settings, and also at 4K using High on most of them. We take the average results of four runs, reporting frame rate averages, 99th percentiles, and our time under analysis.
For all our results, we show the average frame rate at 1080p first. Mouse over the other graphs underneath to see 99th percentile frame rates and 'Time Under' graphs, as well as results for other resolutions. All of our benchmark results can also be found in our benchmark engine, Bench.
MSI GTX 1080 Gaming 8G Performance
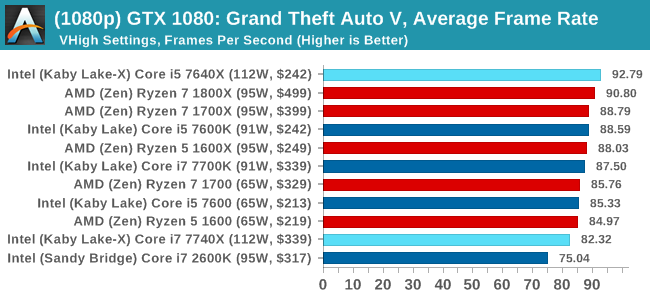
1080p
4K
ASUS GTX 1060 Strix 6GB Performance

1080p
4K
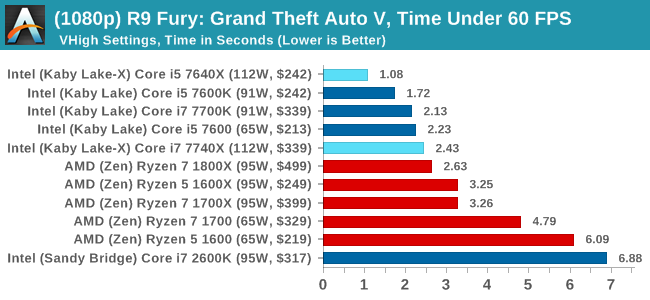
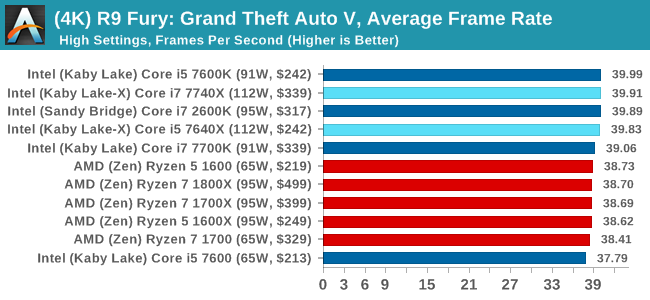
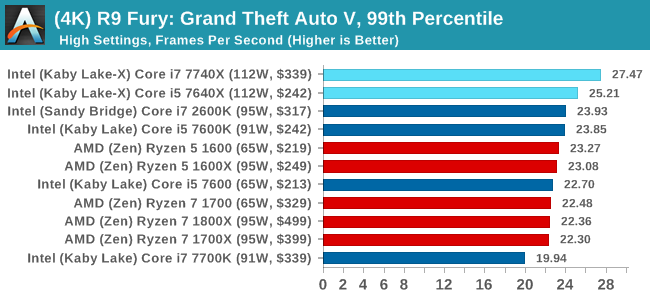
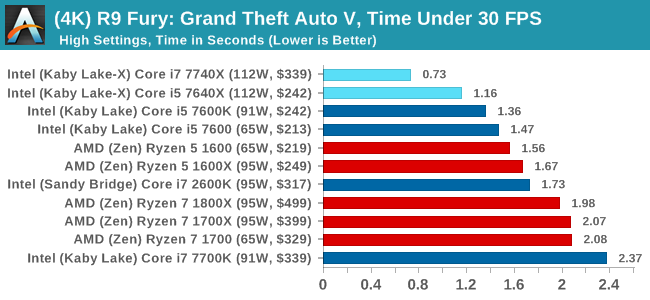
Sapphire R9 Fury 4GB Performance
1080p
4K
Sapphire RX 480 8GB Performance
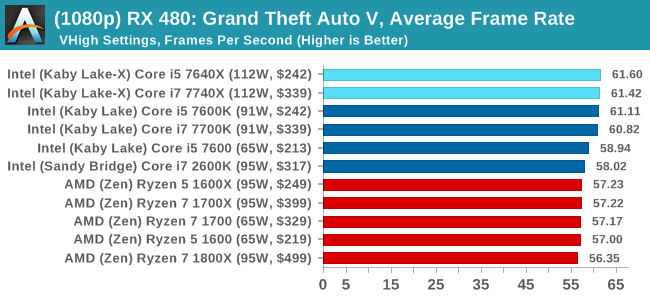
1080p
4K
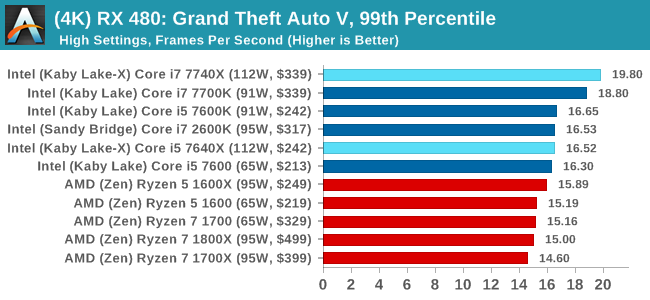
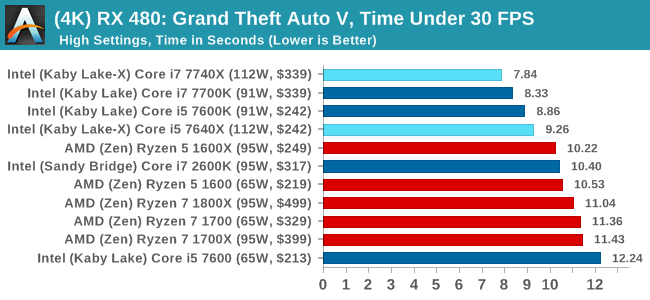
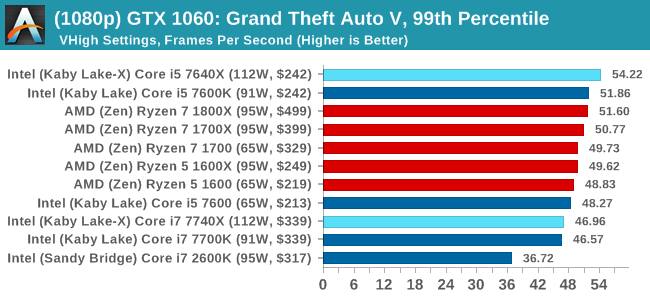
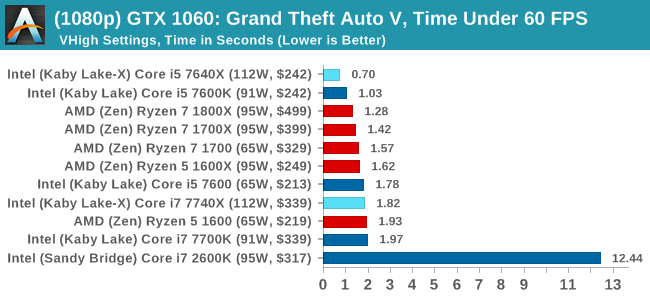
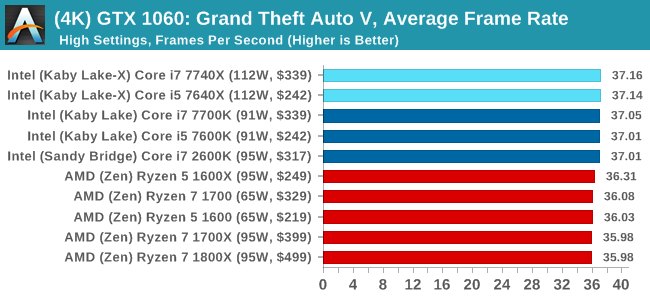
Grand Theft Auto Conclusions
Looking through the data, there seems to be a difference when looking at the results with an AMD GPU and an NVIDIA GPU. With the GTX 1080, there's a mix of AMD and Intel results there, but Intel takes a beating in the Time Under analysis at 1080p. The GTX 1060 is a mix at 1080p, but Intel takes the lead at 4K. When an AMD GPU is paired to the processor, all flags fly Intel.


176 Comments
View All Comments
Gulagula - Wednesday, July 26, 2017 - link
Can anyone explain to me how the 7600k and in some cases the 7600 beating the 7700k almost consistenly. I don't doubt the Ryzen results but the Intel side of results confuses the heck out of me.PeterSun - Wednesday, July 26, 2017 - link
7800x is missing in LuxMark CPU OpenCL benchmark?kgh00007 - Thursday, July 27, 2017 - link
Hi, thanks for the great review. Are you guys still using OCCT to check your overclock stability?If so what version do you use and which test do you guys use? Is it the CPU OCCT or the CPU Linpack with AVX and for how long before you consider it stable?
Thanks, I'm trying to work on my own 7700k overclock at the minute!
fattslice - Thursday, July 27, 2017 - link
I hate to say, but there is clearly something very wrong with your 7700K test system. Using the same settings for Tomb Raider, a GTX 1080 11Gbps, and a 7700k set at stock settings I am seeing about 40-50% better fps than you are getting on all three benchmarks--213 avg for Mountain Peak, 163 for Syria, and 166 for Geothermal Valley. This likely is not limited to just RotTR, as your other games have impossible results--technically the i5s cannot beat their respective i7s as they are slower and have less cache. How this was not caught is quite disturbing.welbot - Tuesday, August 1, 2017 - link
The test was run with a 1080, not a 1080ti. Depending on resolution, ti's can outperform the 1080 by 30%+. Could well be why you see such a big difference.Funyim - Thursday, August 10, 2017 - link
No. I'm pretty sure the 7700k used was broken. It worries me as well this was posted without further investigation. Basically invalidates all benchmarks.