The Intel Kaby Lake-X i7 7740X and i5 7640X Review: The New Single-Threaded Champion, OC to 5GHz
by Ian Cutress on July 24, 2017 8:30 AM EST- Posted in
- CPUs
- Intel
- Kaby Lake
- X299
- Basin Falls
- Kaby Lake-X
- i7-7740X
- i5-7640X
Civilization 6
First up in our CPU gaming tests is Civilization 6. Originally penned by Sid Meier and his team, the Civ series of turn-based strategy games are a cult classic, and many an excuse for an all-nighter trying to get Gandhi to declare war on you due to an integer overflow. Truth be told I never actually played the first version, but every edition from the second to the sixth, including the fourth as voiced by the late Leonard Nimoy, it a game that is easy to pick up, but hard to master.

Benchmarking Civilization has always been somewhat of an oxymoron – for a turn based strategy game, the frame rate is not necessarily the important thing here and even in the right mood, something as low as 5 frames per second can be enough. With Civilization 6 however, Firaxis went hardcore on visual fidelity, trying to pull you into the game. As a result, Civilization can taxing on graphics and CPUs as we crank up the details, especially in DirectX 12.
Perhaps a more poignant benchmark would be during the late game, when in the older versions of Civilization it could take 20 minutes to cycle around the AI players before the human regained control. The new version of Civilization has an integrated ‘AI Benchmark’, although it is not currently part of our benchmark portfolio yet, due to technical reasons which we are trying to solve. Instead, we run the graphics test, which provides an example of a mid-game setup at our settings.
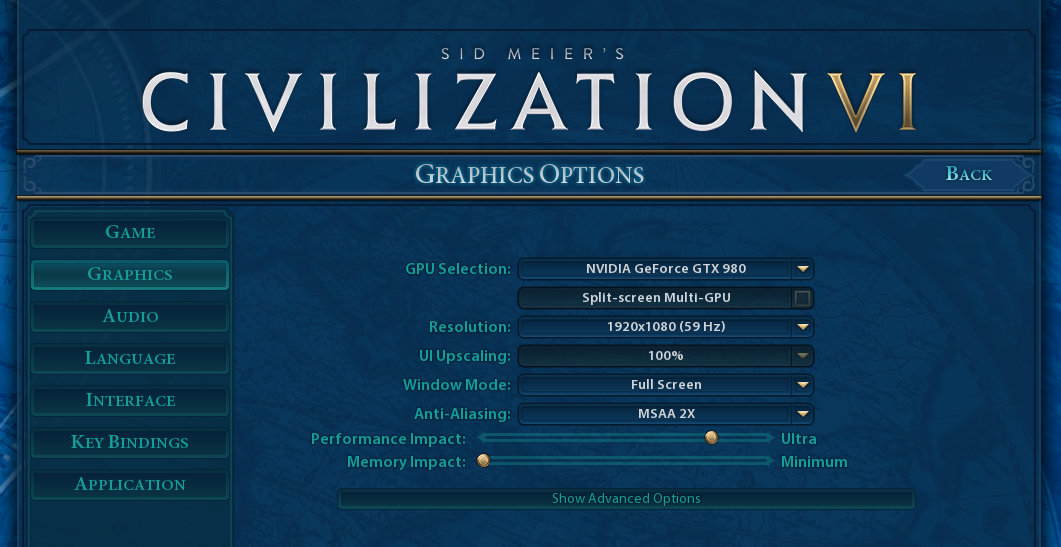
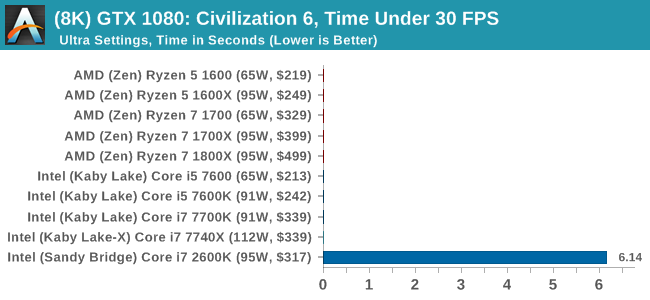
At both 1920x1080 and 4K resolutions, we run the same settings. Civilization 6 has sliders for MSAA, Performance Impact and Memory Impact. The latter two refer to detail and texture size respectively, and are rated between 0 (lowest) to 5 (extreme). We run our Civ6 benchmark in position four for performance (ultra) and 0 on memory, with MSAA set to 2x.
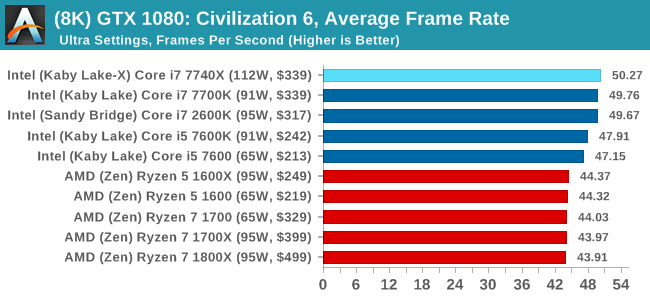
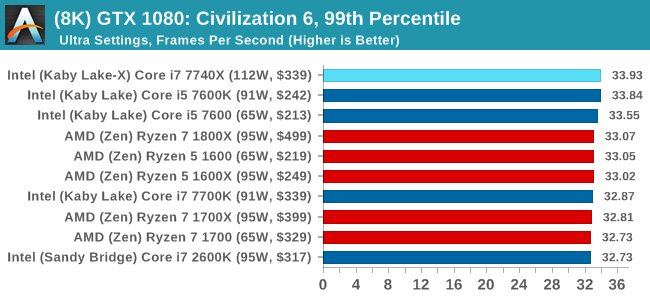
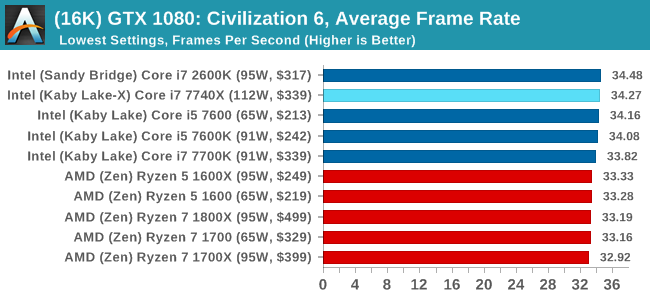
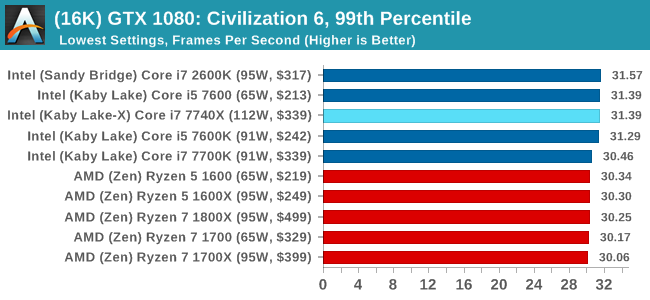
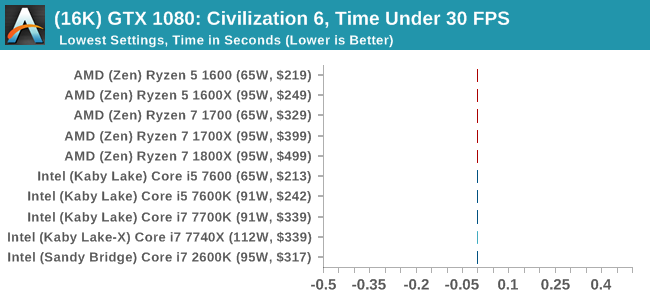
For reviews where we include 8K and 16K benchmarks (Civ6 allows us to benchmark extreme resolutions on any monitor) on our GTX 1080, we run the 8K tests similar to the 4K tests, but the 16K tests are set to the lowest option for Performance.
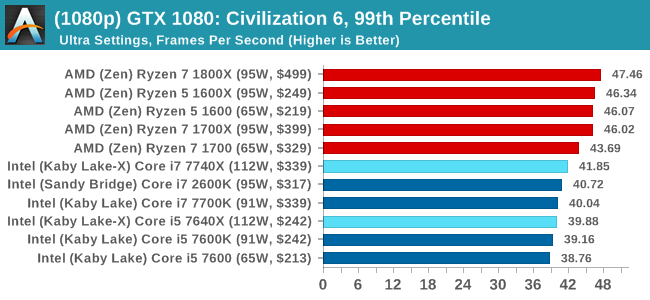
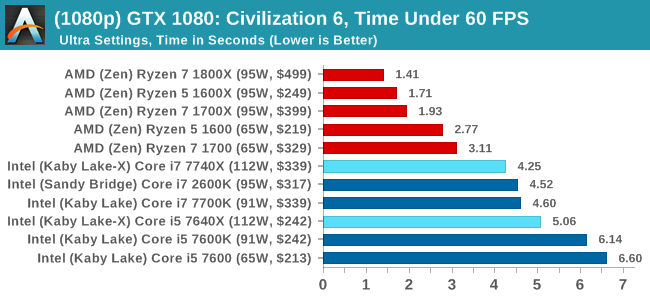
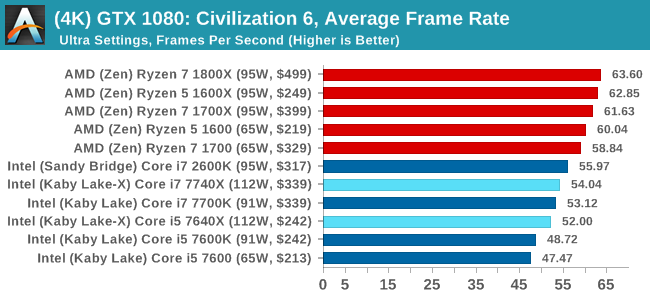
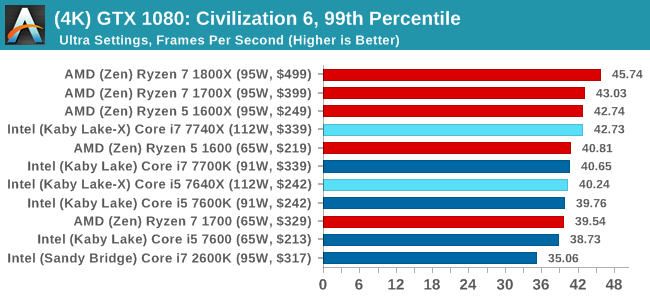
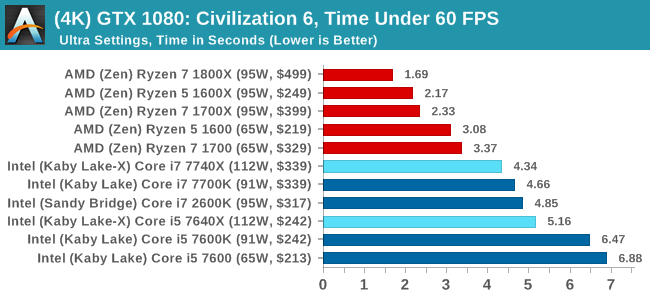
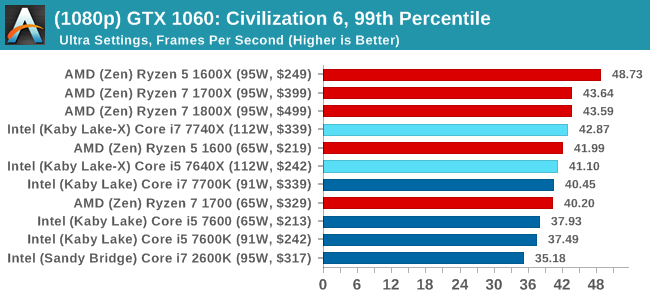
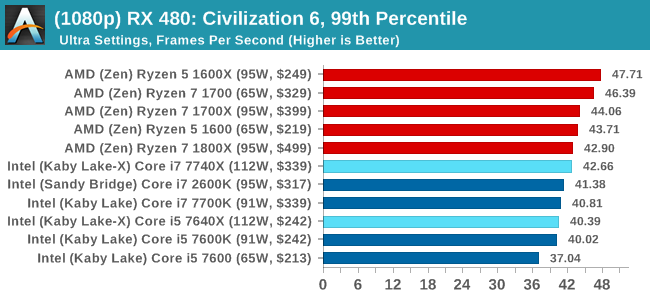
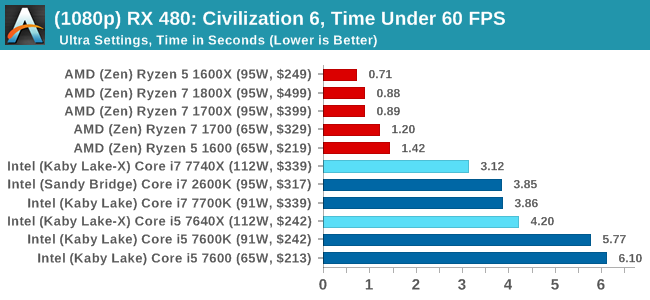
For all our results, we show the average frame rate at 1080p first. Mouse over the other graphs underneath to see 99th percentile frame rates and 'Time Under' graphs, as well as results for other resolutions. All of our benchmark results can also be found in our benchmark engine, Bench.
MSI GTX 1080 Gaming 8G Performance

1080p
4K
8K
16K
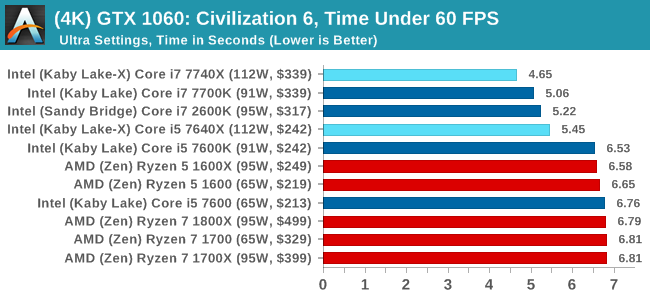
ASUS GTX 1060 Strix 6GB Performance

1080p
4K
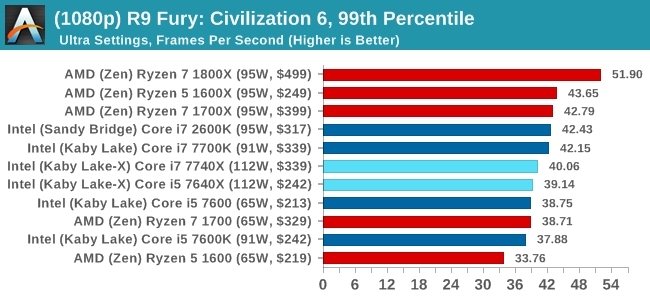
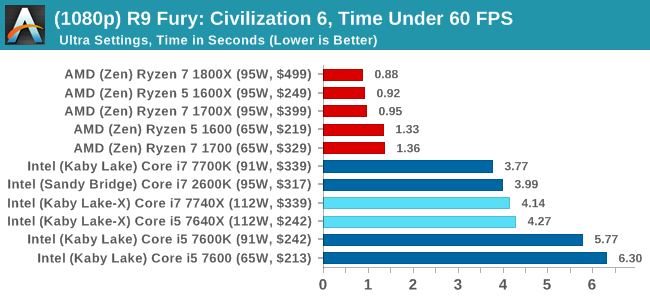
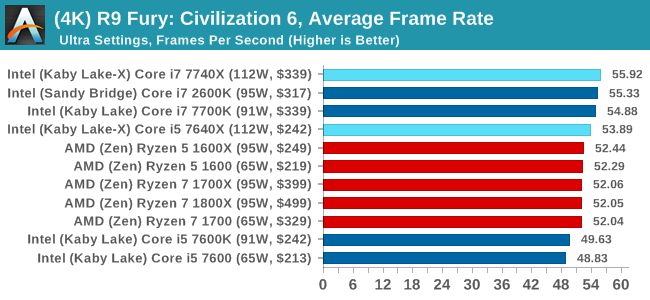
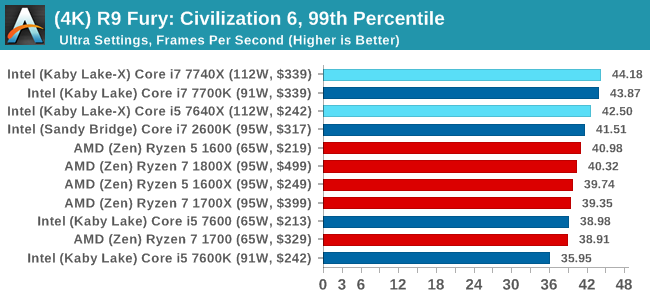
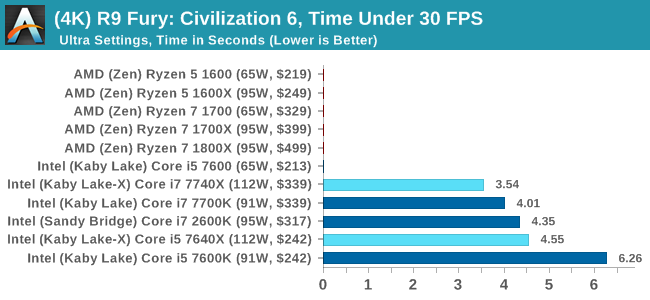
Sapphire R9 Fury 4GB Performance
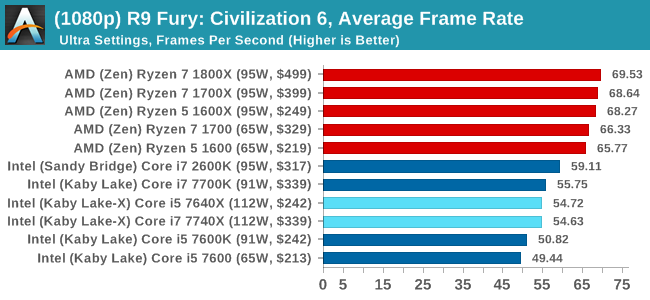
1080p
4K
Sapphire RX 480 8GB Performance
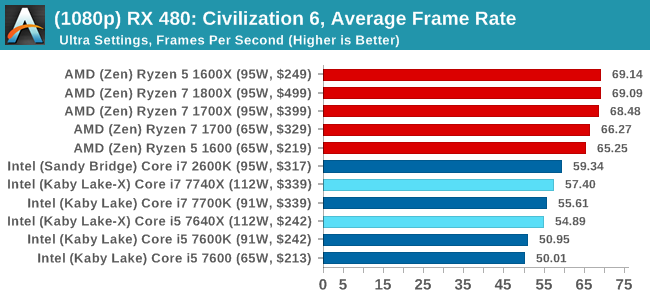
1080p
4K
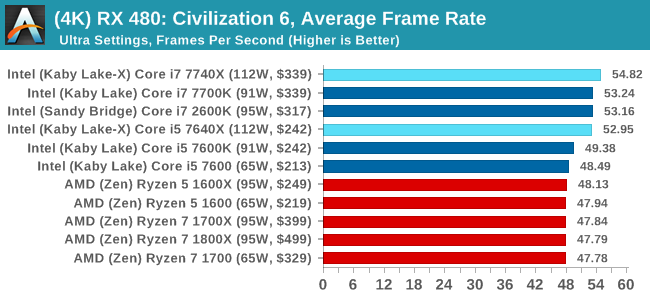
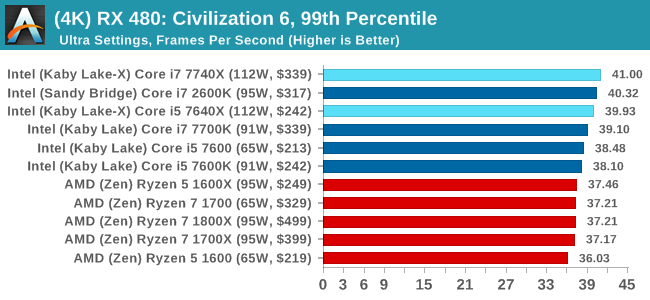
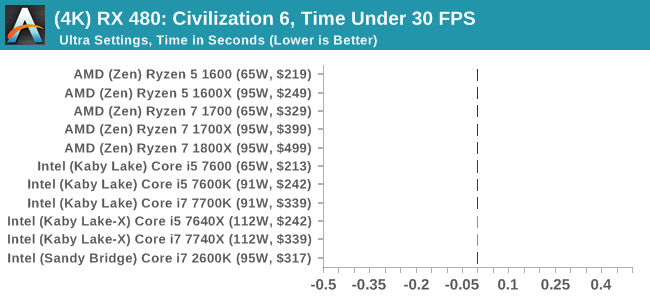
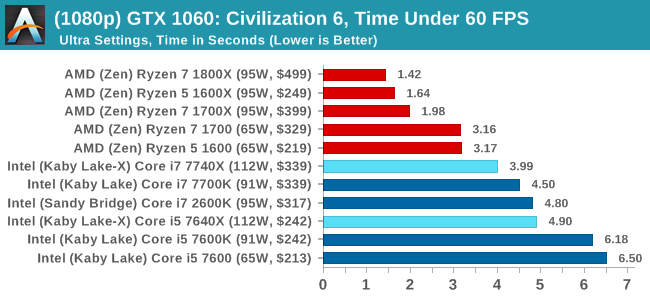
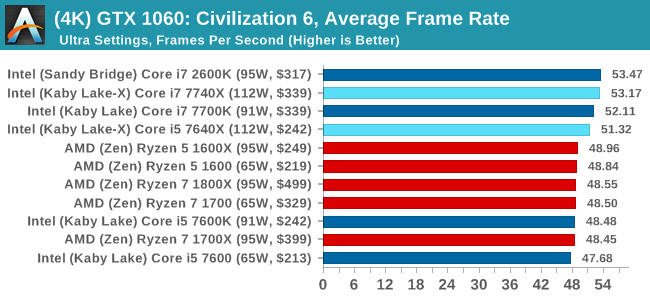
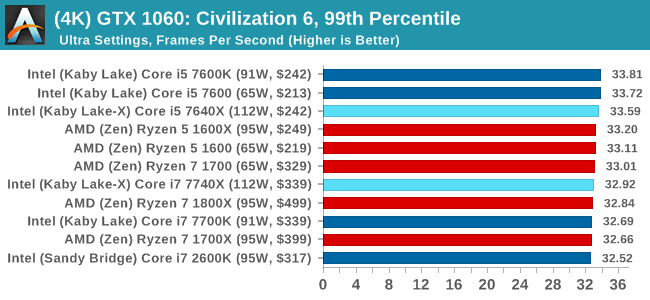
Civilization 6 Conclusion
In all our testing scenarios, AMD wins at 1080p with minor margins on the frame rates but considerable gains in the time under analysis. Intel pushes ahead in almost all of the 4K results, except with the time under analysis at 4K using an R9 Fury, perhaps indicating that AMD is offering a steadier range in its frame rate, despite the average being lower.


176 Comments
View All Comments
Gulagula - Wednesday, July 26, 2017 - link
Can anyone explain to me how the 7600k and in some cases the 7600 beating the 7700k almost consistenly. I don't doubt the Ryzen results but the Intel side of results confuses the heck out of me.PeterSun - Wednesday, July 26, 2017 - link
7800x is missing in LuxMark CPU OpenCL benchmark?kgh00007 - Thursday, July 27, 2017 - link
Hi, thanks for the great review. Are you guys still using OCCT to check your overclock stability?If so what version do you use and which test do you guys use? Is it the CPU OCCT or the CPU Linpack with AVX and for how long before you consider it stable?
Thanks, I'm trying to work on my own 7700k overclock at the minute!
fattslice - Thursday, July 27, 2017 - link
I hate to say, but there is clearly something very wrong with your 7700K test system. Using the same settings for Tomb Raider, a GTX 1080 11Gbps, and a 7700k set at stock settings I am seeing about 40-50% better fps than you are getting on all three benchmarks--213 avg for Mountain Peak, 163 for Syria, and 166 for Geothermal Valley. This likely is not limited to just RotTR, as your other games have impossible results--technically the i5s cannot beat their respective i7s as they are slower and have less cache. How this was not caught is quite disturbing.welbot - Tuesday, August 1, 2017 - link
The test was run with a 1080, not a 1080ti. Depending on resolution, ti's can outperform the 1080 by 30%+. Could well be why you see such a big difference.Funyim - Thursday, August 10, 2017 - link
No. I'm pretty sure the 7700k used was broken. It worries me as well this was posted without further investigation. Basically invalidates all benchmarks.