The Intel Kaby Lake-X i7 7740X and i5 7640X Review: The New Single-Threaded Champion, OC to 5GHz
by Ian Cutress on July 24, 2017 8:30 AM EST- Posted in
- CPUs
- Intel
- Kaby Lake
- X299
- Basin Falls
- Kaby Lake-X
- i7-7740X
- i5-7640X
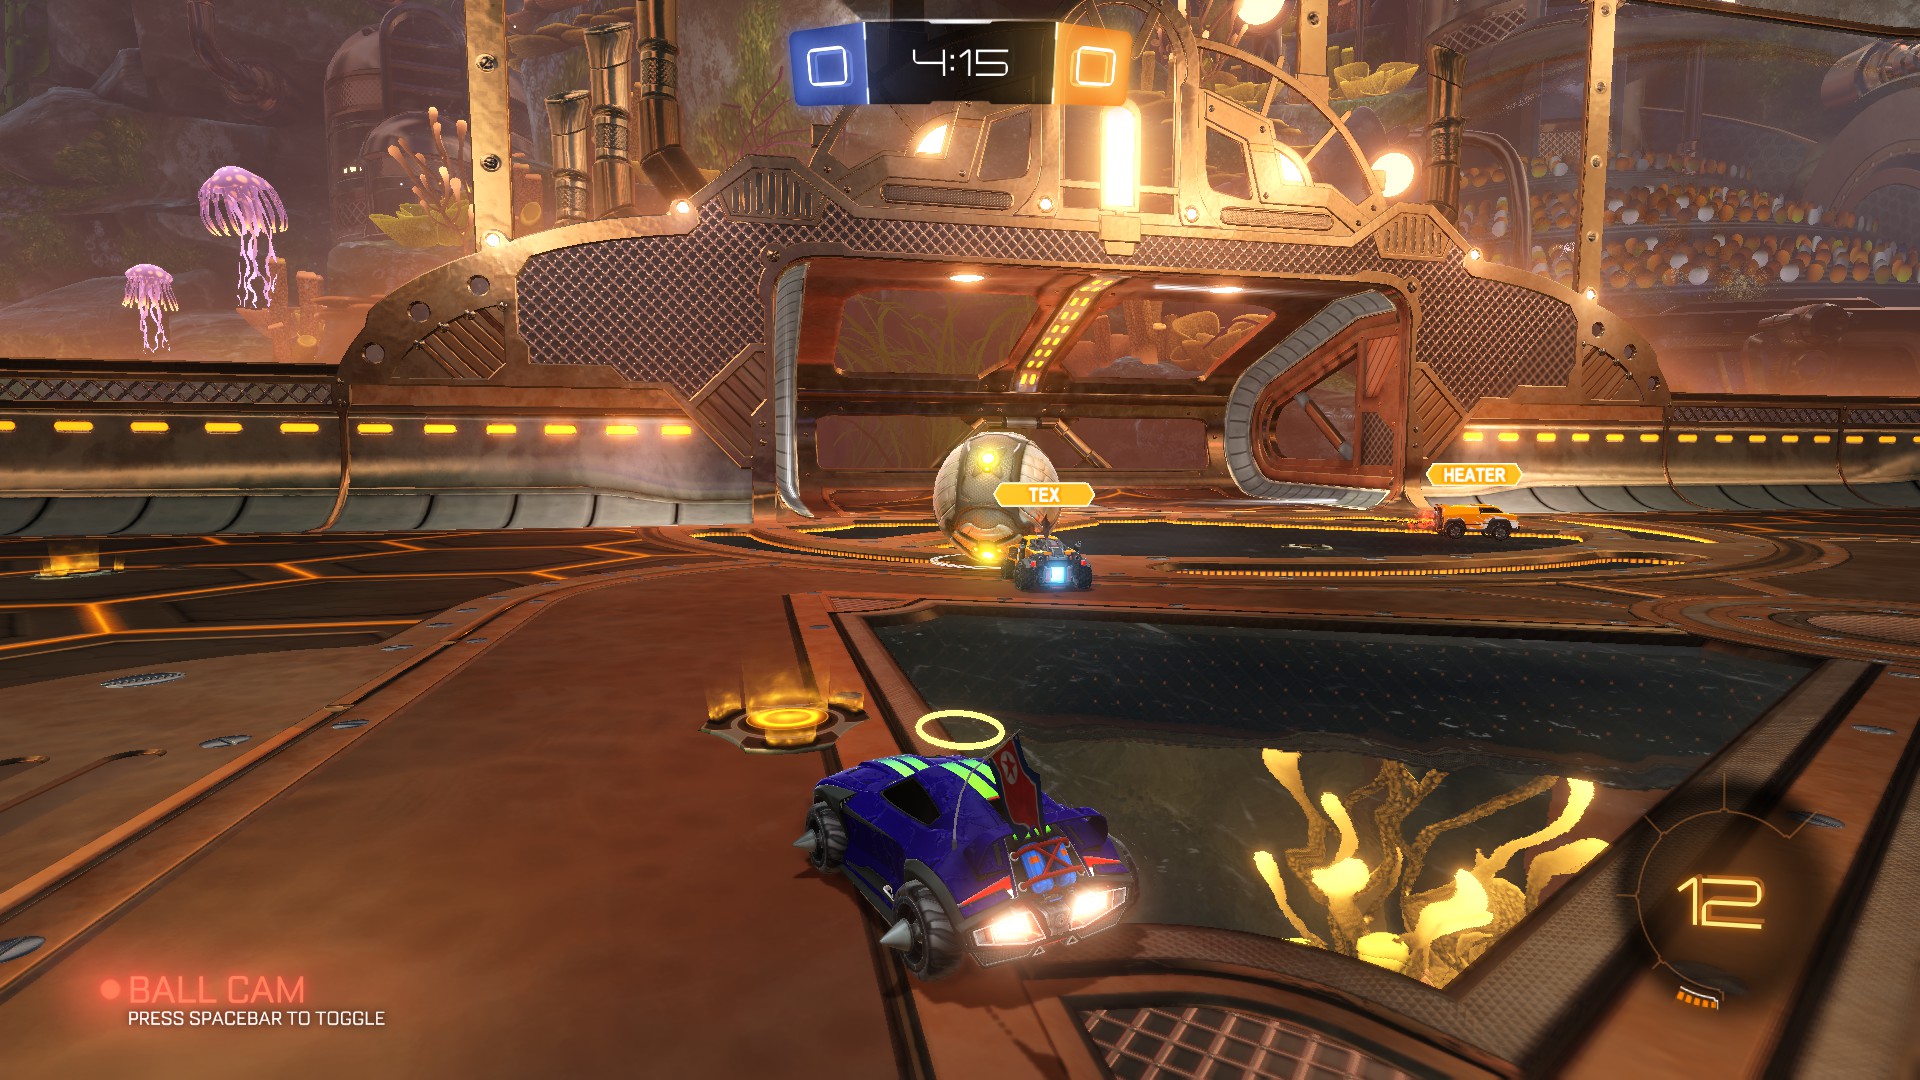
Rocket League
Hilariously simple pick-up-and-play games are great fun. I'm a massive fan of the Katamari franchise for that reason — passing start on a controller and rolling around, picking up things to get bigger, is extremely simple. Until we get a PC version of Katamari that I can benchmark, we'll focus on Rocket League.
Rocket League combines the elements of pick-up-and-play, allowing users to jump into a game with other people (or bots) to play football with cars with zero rules. The title is built on Unreal Engine 3, which is somewhat old at this point, but it allows users to run the game on super-low-end systems while still taxing the big ones. Since the release in 2015, it has sold over 5 million copies and seems to be a fixture at LANs and game shows. Users who train get very serious, playing in teams and leagues with very few settings to configure, and everyone is on the same level. Rocket League is quickly becoming one of the favored titles for e-sports tournaments, especially when e-sports contests can be viewed directly from the game interface.
Based on these factors, plus the fact that it is an extremely fun title to load and play, we set out to find the best way to benchmark it. Unfortunately for the most part automatic benchmark modes for games are few and far between. Partly because of this, but also on the basis that it is built on the Unreal 3 engine, Rocket League does not have a benchmark mode. In this case, we have to develop a consistent run and record the frame rate.
Read our initial analysis on our Rocket League benchmark on low-end graphics here.
With Rocket League, there is no benchmark mode, so we have to perform a series of automated actions, similar to a racing game having a fixed number of laps. We take the following approach: Using Fraps to record the time taken to show each frame (and the overall frame rates), we use an automation tool to set up a consistent 4v4 bot match on easy, with the system applying a series of inputs throughout the run, such as switching camera angles and driving around.
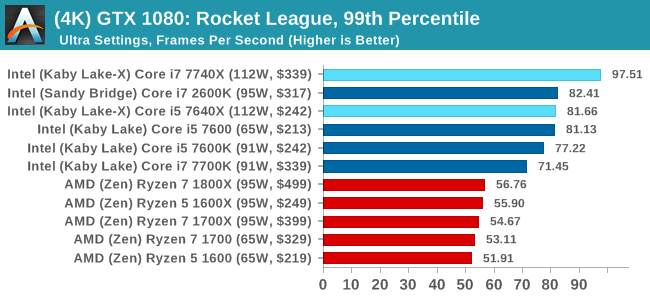
It turns out that this method is nicely indicative of a real bot match, driving up walls, boosting and even putting in the odd assist, save and/or goal, as weird as that sounds for an automated set of commands. To maintain consistency, the commands we apply are not random but time-fixed, and we also keep the map the same (Aquadome, known to be a tough map for GPUs due to water/transparency) and the car customization constant. We start recording just after a match starts, and record for 4 minutes of game time (think 5 laps of a DIRT: Rally benchmark), with average frame rates, 99th percentile and frame times all provided.
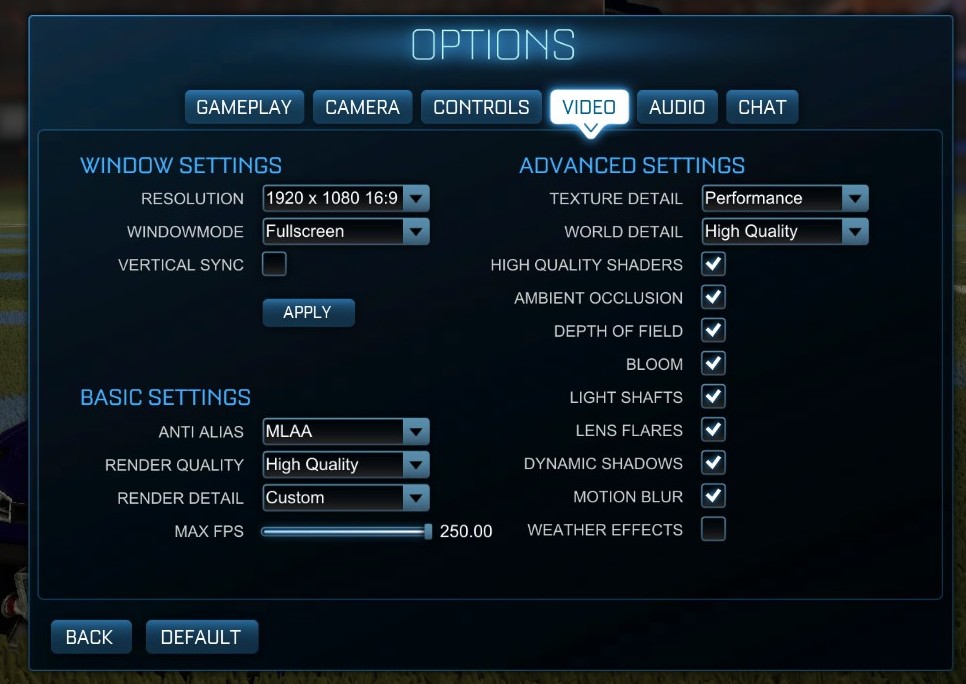
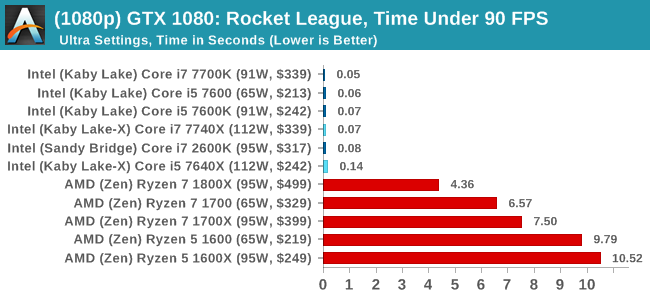
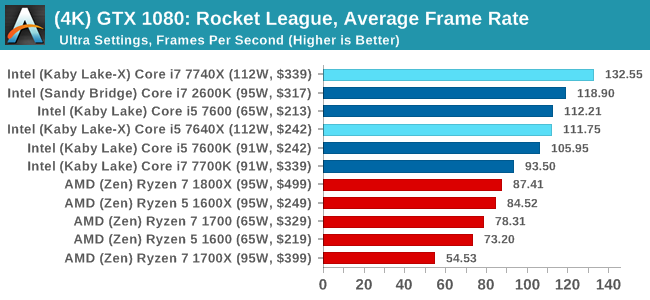
The graphics settings for Rocket League come in four broad, generic settings: Low, Medium, High and High FXAA. There are advanced settings in place for shadows and details; however, for these tests, we keep to the generic settings. For both 1920x1080 and 4K resolutions, we test at the High preset with an unlimited frame cap.
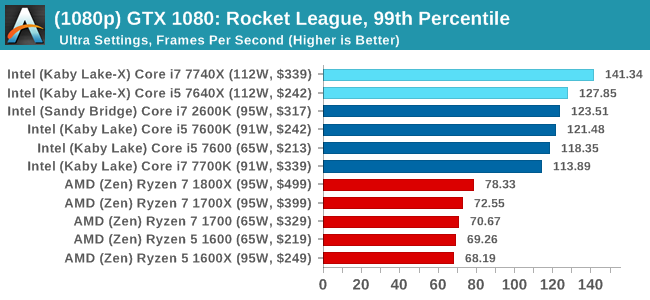
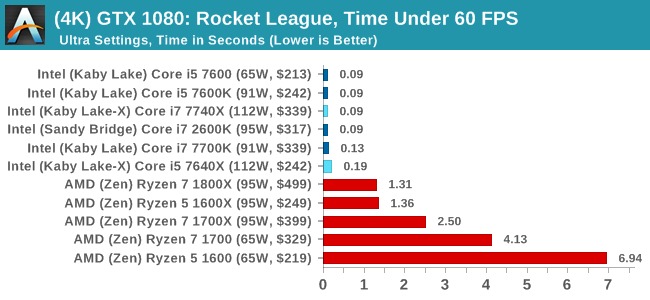
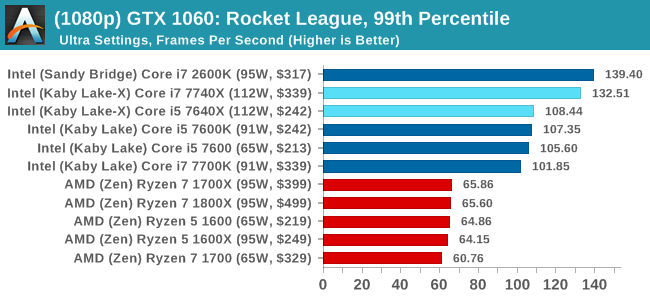
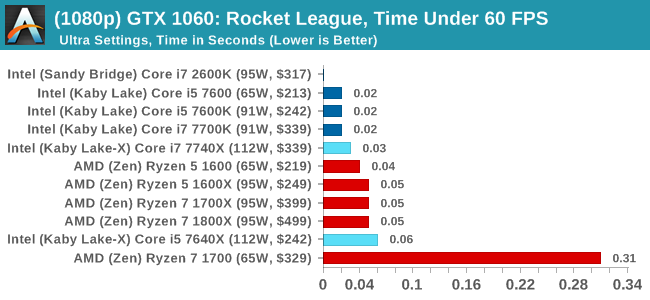
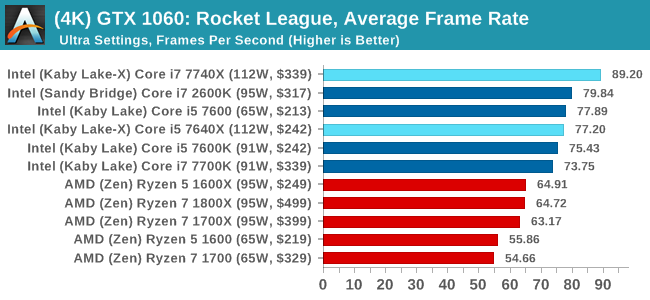
For all our results, we show the average frame rate at 1080p first. Mouse over the other graphs underneath to see 99th percentile frame rates and 'Time Under' graphs, as well as results for other resolutions. All of our benchmark results can also be found in our benchmark engine, Bench.
MSI GTX 1080 Gaming 8G Performance
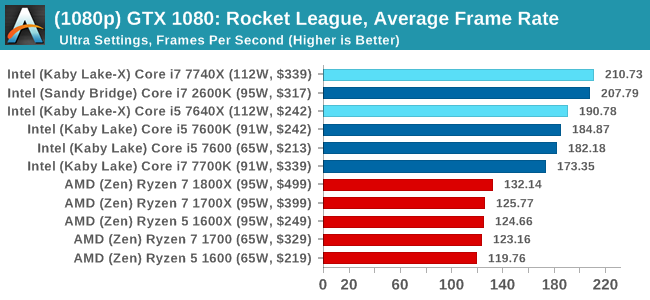
1080p
4K
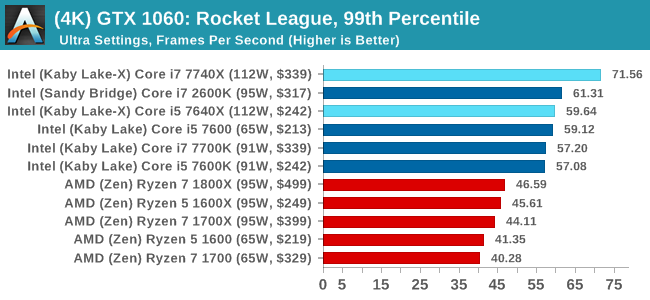
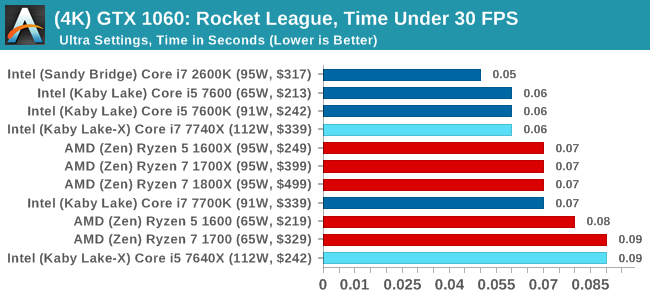
ASUS GTX 1060 Strix 6GB Performance
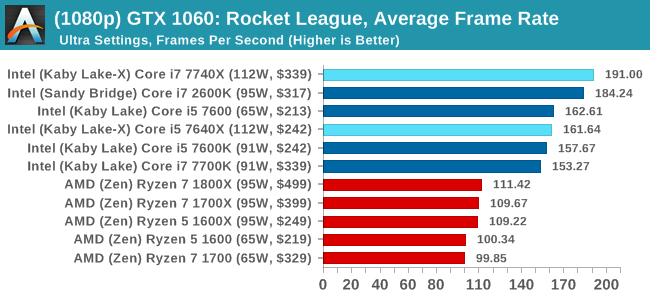
1080p
4K
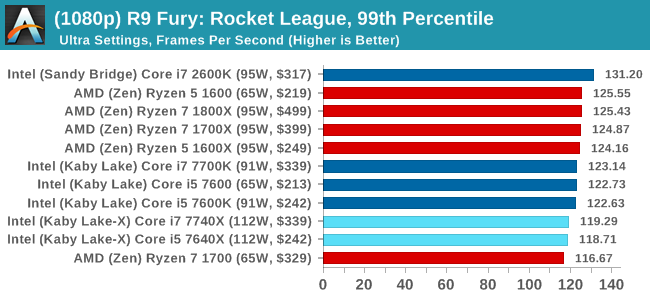
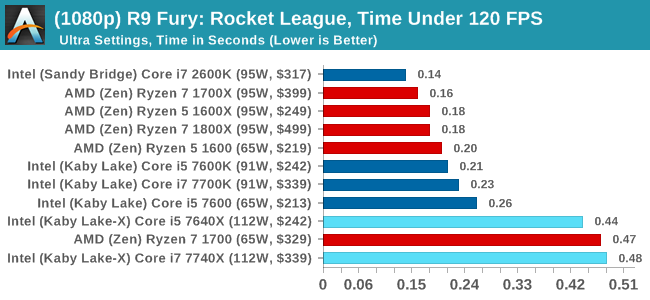
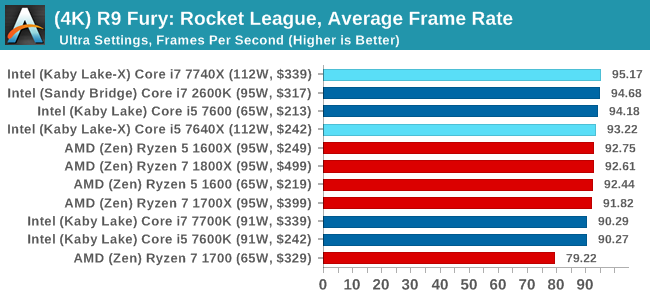
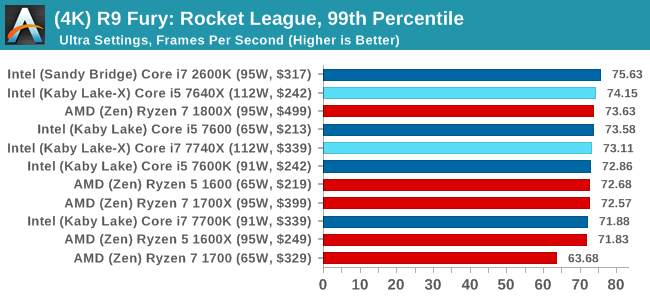
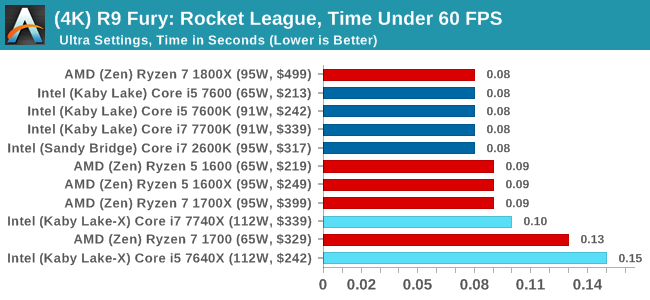
Sapphire R9 Fury 4GB Performance
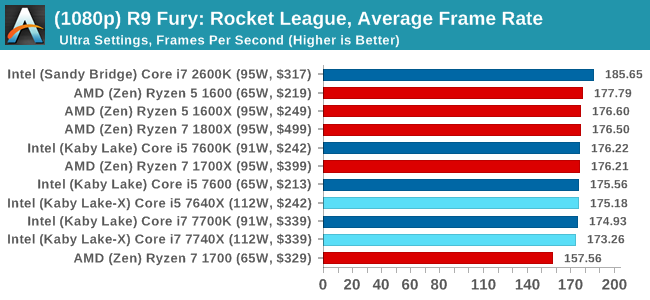
1080p
4K
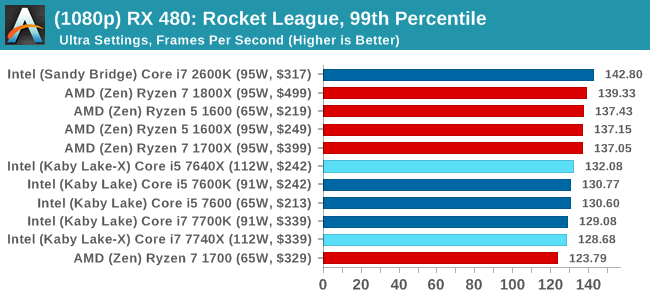
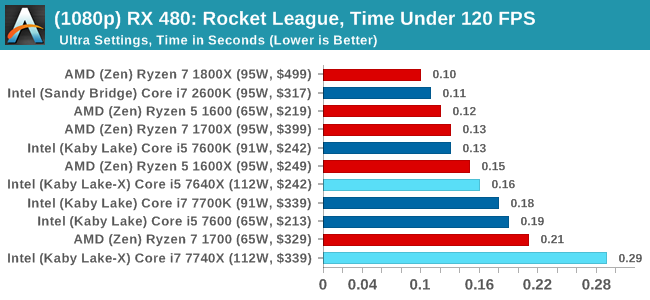
Sapphire RX 480 8GB Performance
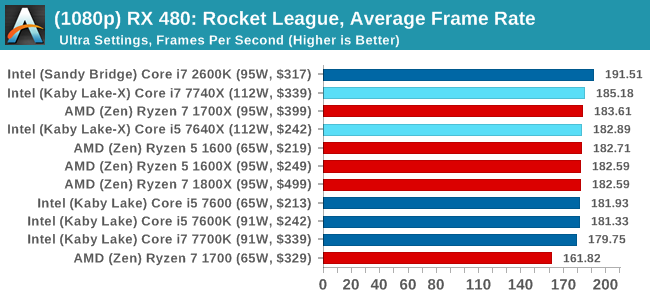
1080p
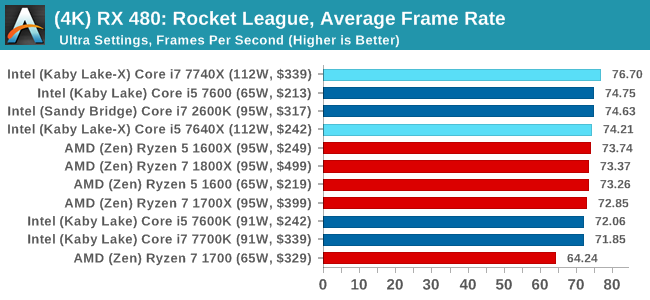
4K
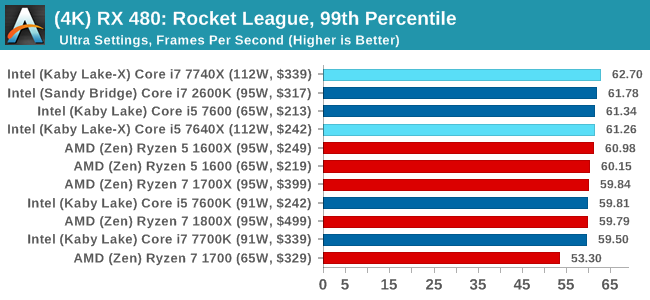
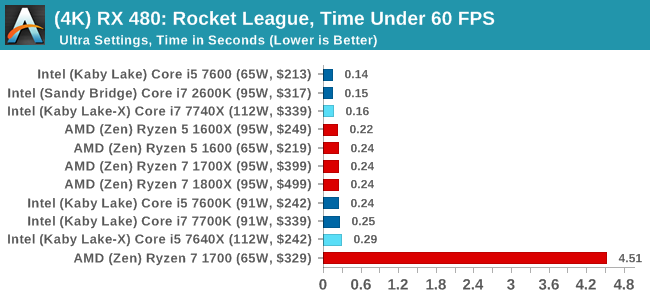
Rocket League Conclusions
The map we use in our testing, Aquadome, is known to be strenuous on a system, hence we see frame rates lower than what people expect for Rocket League - we're trying to cover the worst case scenario. But the results also show how AMD CPUs and NVIDIA GPUs do not seem to be playing ball with each other, which we've been told is likely related to drivers. The AMD GPUs work fine here regardless of resolution, and both AMD and Intel CPUs get in the mix.


176 Comments
View All Comments
MrSpadge - Monday, July 24, 2017 - link
> realize that overclocking may not be appropriate for these workloadsThat's going too far. Just don't overclock as far for heavy AVX usage.
MrSpadge - Monday, July 24, 2017 - link
Kind of agreed. Ian, you should log the clock speeds during benchmark runs and check for anomalies. The chip or mainboard could throttle, or your 4.0 GHz AVX clock could just be way too low. What's the default AVX clock? Maybe 4.4 GHz? That would pretty much match the 10% performance degradation.Ian Cutress - Monday, July 24, 2017 - link
I need to do a performance scaling piece, I know. It's on the to-do listKvaern1 - Monday, July 24, 2017 - link
As already mentioned it's heavy AVX workloads which makes it throttle when OC'ed. The same thing happens on OC'ed Skylakes.arh2o - Monday, July 24, 2017 - link
Something seems wrong with the 7700k results vs the 7600k results. How is the 7600k beating the 7700k so handily in all the games? Are you sure the graphs are not swapped? ROTR shows the 7600k beating the 7700k by 20 FPS which seems impossible considering most reviews on this game have the 7700k on top of the 7600k.ydeer - Monday, July 24, 2017 - link
I would have liked to see some idle power consumption numbers because my PC is always on.Ro_Ja - Monday, July 24, 2017 - link
This was an interesting read. Thank you!Marnox - Monday, July 24, 2017 - link
According to Intel (https://ark.intel.com/products/97129/Intel-Core-i7... the Turbo speed for the 7700K is the same as the 7740X.mapesdhs - Monday, July 24, 2017 - link
Is the Max Turbo for one core or two? Always bugged me that Intel doesn't list the individual core/bin levels.versesuvius - Monday, July 24, 2017 - link
It will be interesting to see how many of these CPUs Intel will actually produce (collect ?) and bring to the market.