The AMD Ryzen 5 1600X vs Core i5 Review: Twelve Threads vs Four at $250
by Ian Cutress on April 11, 2017 9:00 AM ESTBenchmarking Performance: CPU Rendering Tests
Rendering tests are a long-time favorite of reviewers and benchmarkers, as the code used by rendering packages is usually highly optimized to squeeze every little bit of performance out. Sometimes rendering programs end up being heavily memory dependent as well - when you have that many threads flying about with a ton of data, having low latency memory can be key to everything. Here we take a few of the usual rendering packages under Windows 10, as well as a few new interesting benchmarks.
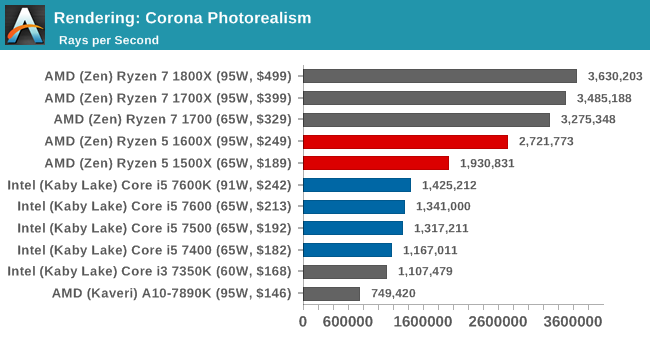
Corona 1.3
Corona is a standalone package designed to assist software like 3ds Max and Maya with photorealism via ray tracing. It's simple - shoot rays, get pixels. OK, it's more complicated than that, but the benchmark renders a fixed scene six times and offers results in terms of time and rays per second. The official benchmark tables list user submitted results in terms of time, however I feel rays per second is a better metric (in general, scores where higher is better seem to be easier to explain anyway). Corona likes to pile on the threads, so the results end up being very staggered based on thread count.
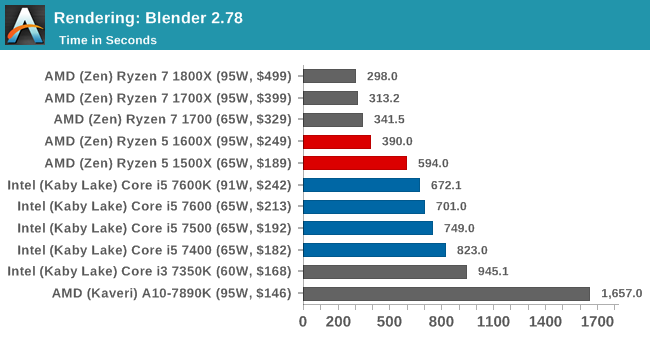
Blender 2.78
For a render that has been around for what seems like ages, Blender is still a highly popular tool. We managed to wrap up a standard workload into the February 5 nightly build of Blender and measure the time it takes to render the first frame of the scene. Being one of the bigger open source tools out there, it means both AMD and Intel work actively to help improve the codebase, for better or for worse on their own/each other's microarchitecture.
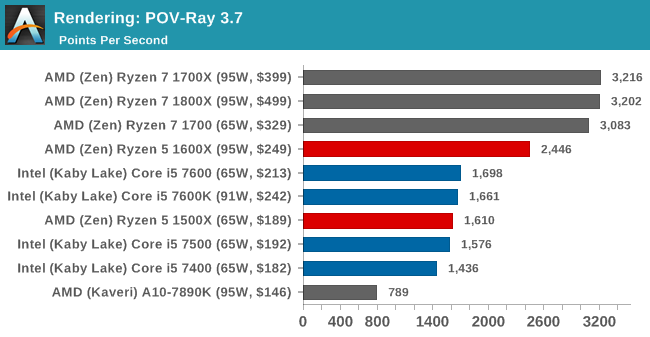
POV-Ray 3.7.1
Another regular benchmark in most suites, POV-Ray is another ray-tracer but has been around for many years. It just so happens that during the run up to AMD's Ryzen launch, the code base started to get active again with developers making changes to the code and pushing out updates. Our version and benchmarking started just before that was happening, but given time we will see where the POV-Ray code ends up and adjust in due course.
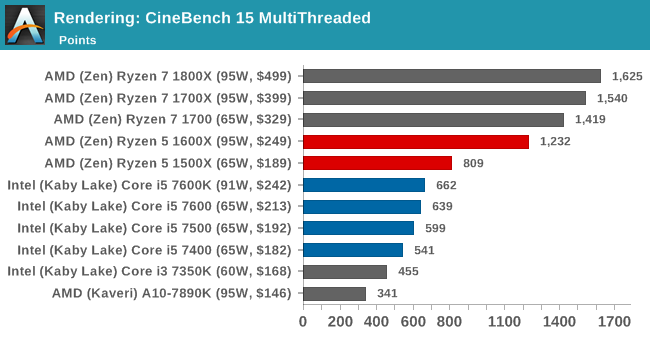
Cinebench R15
The latest version of CineBench has also become one of those 'used everywhere' benchmarks, particularly as an indicator of single thread performance. High IPC and high frequency gives performance in ST, whereas having good scaling and many cores is where the MT test wins out.


254 Comments
View All Comments
Lord-Bryan - Tuesday, April 11, 2017 - link
Ummmm Achaios, i don’t Anandtech is the right place, for all that sleazy fan war.ultima_trev - Tuesday, April 11, 2017 - link
My 1800X gets 2,062 in Passmark single thread. Not that Passmark is the lone dictator of IPC.rarson - Tuesday, April 11, 2017 - link
According to your data, Haswell IPC is equal to Kaby Lake IPC.Meteor2 - Wednesday, April 12, 2017 - link
Um, you need to divide by frequency to get IPC. Clue's in the name.Ammaross - Wednesday, April 12, 2017 - link
So, you're saying that your 4770K beat out a 7700K in single threaded. And now you argue "IPC" with this benchmark? Go home, you're drunk.zeeBomb - Tuesday, April 11, 2017 - link
This is good. This is great...this is AWESOMEsor - Tuesday, April 11, 2017 - link
This is pretty great. When Ryzen is behind, it is not often and not far. When it is ahead, it is far ahead.TadzioPazur - Tuesday, April 11, 2017 - link
"Looking at the results, it’s hard to notice the effect that 12 threads has on multithreaded CPU tests."(..)it's hard NOT to notice(...)"?
bmasumian - Tuesday, April 11, 2017 - link
Your Amazon link to Ryzen 5 isn't working.AndrewJacksonZA - Tuesday, April 11, 2017 - link
Page 5 - FCAT - Graph Heading/Text ErrorThe text says "For our test, we take a 90-second clip of the Rise of the Tomb Raider benchmark running on a GTX 980 Ti at 1440p"
but the graph heading says "System: FCAT Processing ROTR 1440p GTX1080 Data"