The AMD Ryzen 5 1600X vs Core i5 Review: Twelve Threads vs Four at $250
by Ian Cutress on April 11, 2017 9:00 AM ESTBenchmarking Performance: CPU Rendering Tests
Rendering tests are a long-time favorite of reviewers and benchmarkers, as the code used by rendering packages is usually highly optimized to squeeze every little bit of performance out. Sometimes rendering programs end up being heavily memory dependent as well - when you have that many threads flying about with a ton of data, having low latency memory can be key to everything. Here we take a few of the usual rendering packages under Windows 10, as well as a few new interesting benchmarks.
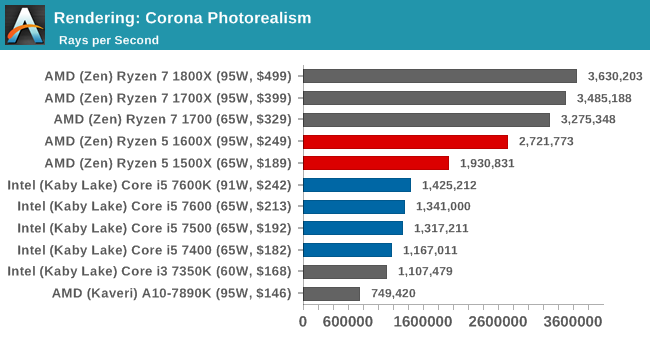
Corona 1.3
Corona is a standalone package designed to assist software like 3ds Max and Maya with photorealism via ray tracing. It's simple - shoot rays, get pixels. OK, it's more complicated than that, but the benchmark renders a fixed scene six times and offers results in terms of time and rays per second. The official benchmark tables list user submitted results in terms of time, however I feel rays per second is a better metric (in general, scores where higher is better seem to be easier to explain anyway). Corona likes to pile on the threads, so the results end up being very staggered based on thread count.
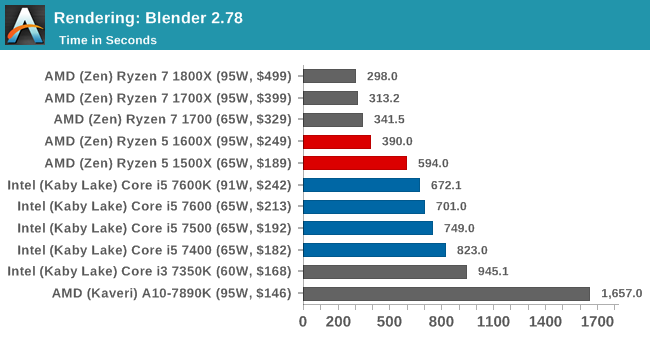
Blender 2.78
For a render that has been around for what seems like ages, Blender is still a highly popular tool. We managed to wrap up a standard workload into the February 5 nightly build of Blender and measure the time it takes to render the first frame of the scene. Being one of the bigger open source tools out there, it means both AMD and Intel work actively to help improve the codebase, for better or for worse on their own/each other's microarchitecture.
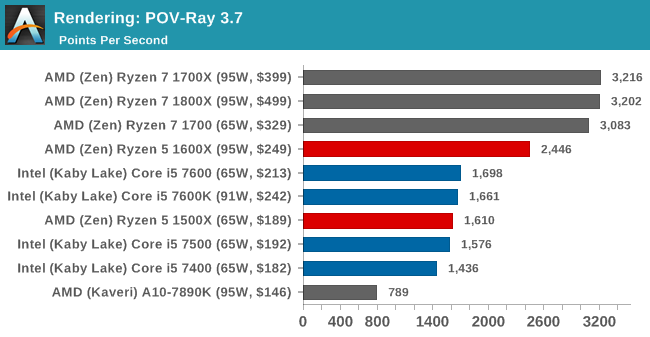
POV-Ray 3.7.1
Another regular benchmark in most suites, POV-Ray is another ray-tracer but has been around for many years. It just so happens that during the run up to AMD's Ryzen launch, the code base started to get active again with developers making changes to the code and pushing out updates. Our version and benchmarking started just before that was happening, but given time we will see where the POV-Ray code ends up and adjust in due course.
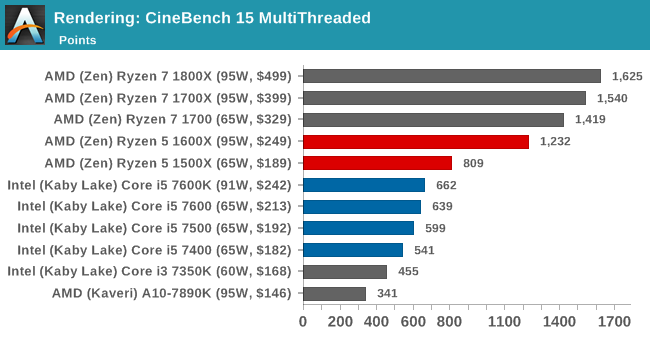
Cinebench R15
The latest version of CineBench has also become one of those 'used everywhere' benchmarks, particularly as an indicator of single thread performance. High IPC and high frequency gives performance in ST, whereas having good scaling and many cores is where the MT test wins out.


254 Comments
View All Comments
Shadowmaster625 - Tuesday, April 11, 2017 - link
The main reason to buy a 7600K over Ryzen is so you can actually go above 4.1GHz. Given how easy it is to clock a 7600K at 4.7GHz or even higher, it is highly disingenuous to not include overclocked results on the graphs.sor - Tuesday, April 11, 2017 - link
I think the overclocking niche is aware that they can do better. I agree that more data is better, but I certainly don't think there's any responsibility for Anandtech to provide overclocking results for either platform.Maybe they'll follow up with a comparison on how Ryzen 5 overclocked compared to the competition.
Meteor2 - Wednesday, April 12, 2017 - link
How much does OC'ing help? Presumably not at all with gaming unless you're on a 1080 or higher, and how does it help multi-threaded production workloads?Notmyusualid - Tuesday, April 18, 2017 - link
My thoughts exactly - my buddies' 7600K runs 24/7 @ 5GHz, on a 240mm closed loop rad.It was the snappiest computer I've yet used...
dhotay - Tuesday, April 11, 2017 - link
*shoo-inhttps://www.merriam-webster.com/dictionary/shoo-in
Achaios - Tuesday, April 11, 2017 - link
"We have already shown in previous reviews that the Zen microarchitecture from AMD is around the equivalent of Intel’s Broadwell microarchitecture"I don't think so, Ian. Case in point:
1. Intel Core i7-7700K @ 4.20GHz- 4.50 GHz Turbo (KABY LAKE): 2,595 MARKS PASSMARK SINGLE THREADED
2. Intel Core i7-6950X @ 3.00GHz- 3.50 GHz Turbo (BROADWELL): 2,135 MARKS PASSMARK SINGLE THREADED
3. AMD 1800X 3.6 GHz - 4.0 GHz Turbo(RYZEN): 1,952 MARKS PASSMARK SINGLE THREADED
Out of curiosity, I benched my own 4770k at 4.5 GHZ, the frequency I game on:
4. Intel 4770K 3.50 GHz - 4.53 GHz OC (HASWELL): 2610 MARKS PASSMARK SINGLE THREADED
http://imgur.com/FrHmYlG
It's not even the bloody equivalent of Haswell, man, much less that of Broadwell.
sor - Tuesday, April 11, 2017 - link
No, you're cherry picking. It's pretty well documented that IPC is about broadwell level, if you want to get into a benchmark posting war you'll run out of material far sooner. I can even find huge wins for Ryzen, but I'm not going to cherry pick those to try to show a big discrepancy.Achaios - Tuesday, April 11, 2017 - link
How about you go ahead and cherrypick to prove me wrong on Single Threaded performance. Oh now wait, you can't b/c Ryzen is slow as molasses in January.https://www.cpubenchmark.net/singleThread.html
MrSpadge - Tuesday, April 11, 2017 - link
Apart from WinrAR 5.2 that's pretty slippery molasses:http://www.zolkorn.com/en/amd-ryzen-7-1800x-vs-int...
fanofanand - Tuesday, April 11, 2017 - link
And the cherry picking continues."How about you go ahead and cherrypick to prove me wrong on Single Threaded performance"