The AMD Ryzen 5 1600X vs Core i5 Review: Twelve Threads vs Four at $250
by Ian Cutress on April 11, 2017 9:00 AM ESTBenchmarking Performance: CPU Web Tests
One of the issues when running web-based tests is the nature of modern browsers to automatically install updates. This means any sustained period of benchmarking will invariably fall foul of the 'it's updated beyond the state of comparison' rule, especially when browsers will update if you give them half a second to think about it. Despite this, we were able to find a series of commands to create an un-updatable version of Chrome 56 for our 2017 test suite. While this means we might not be on the bleeding edge of the latest browser, it makes the scores between CPUs comparable.
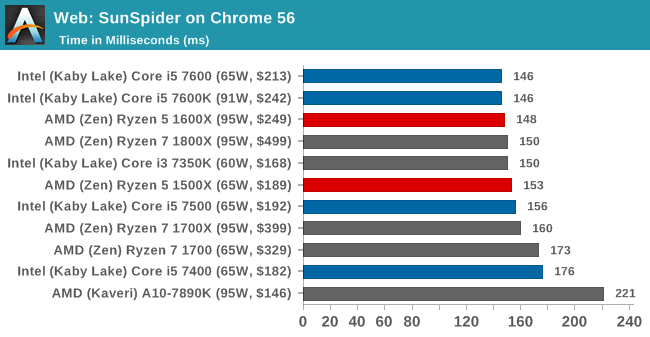
SunSpider 1.0.2 [link]
The oldest web-based benchmark in this portion of our test is SunSpider. This is a very basic javascript algorithm tool, and ends up being more a measure of IPC and latency than anything else, with most high performance CPUs scoring around about the same. The basic test is looped 10 times and the average taken. We run the basic test 4 times.
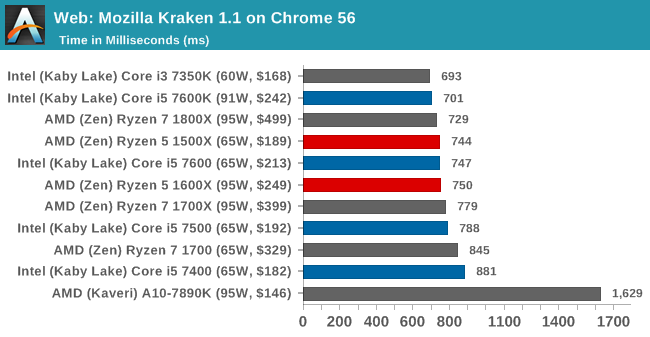
Mozilla Kraken 1.1 [link]
Kraken is another Javascript based benchmark, using the same test harness as SunSpider, but focusing on more stringent real-world use cases and libraries, such as audio processing and image filters. Again, the basic test is looped ten times, and we run the basic test four times.
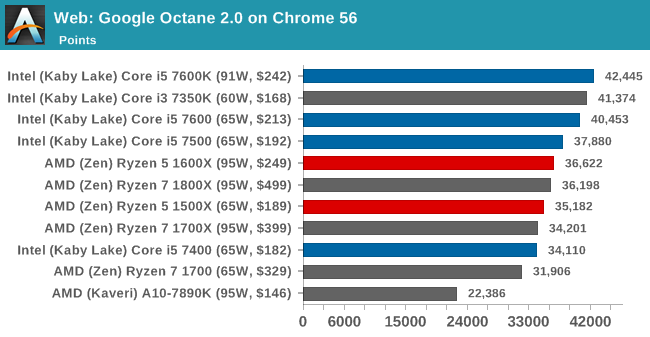
Google Octane 2.0 [link]
Along with Mozilla, as Google is a major browser developer, having peak JS performance is typically a critical asset when comparing against the other OS developers. In the same way that SunSpider is a very early JS benchmark, and Kraken is a bit newer, Octane aims to be more relevant to real workloads, especially in power constrained devices such as smartphones and tablets.
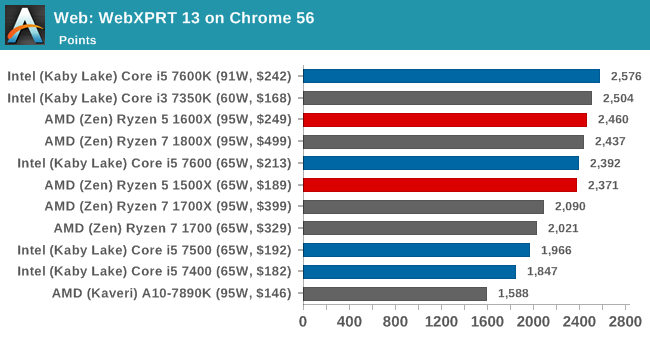
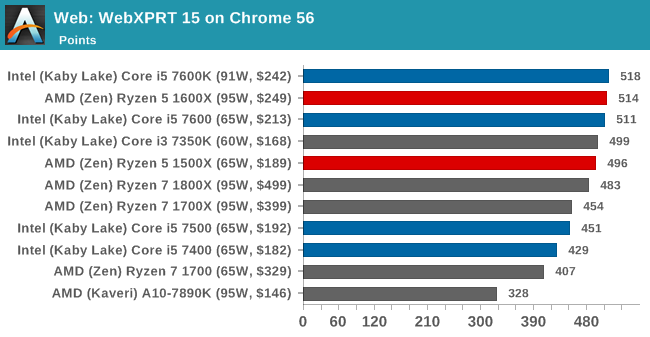
WebXPRT 2013 and 2015 [link]
While the previous three benchmarks do calculations in the background and represent a score, WebXPRT is designed to be a better interpretation of visual workloads that a professional user might have, such as browser based applications, graphing, image editing, sort/analysis, scientific analysis and financial tools. Web2013 is the older tool, superceded by Web2015, however both still are highly relevant for high-performance web applications today.


254 Comments
View All Comments
Phiro69 - Tuesday, April 11, 2017 - link
Thank you Ian!Maybe at some point as part of your benchmark description you have a url to a page showing basic (e.g. exactly the level of information you provided above but not step by step hand holding) benchmark setup instructions. I know I wonder if I've configured my builds correctly when I put together new systems; I buy the parts based on benchmarks but I don't ever really validate they perform at that level/I have things set correctly.
qupada - Tuesday, April 11, 2017 - link
I was curious about this too. Obviously a direct comparison between your Windows test and my Linux one is going to be largely meaningless but I felt the need to try anyway. Since Linux is all I have, this is what we get.My Haswell-EP Xeon E5-1660v3 - approximately an i7-5960X with ECC RAM, and that CPU seems to be oft-compared to the 1800X you have put in your results - clocks in at 78:36 to compile Chromium (59.0.3063.4), or 18.31 compiles per day (hoorah for the pile of extra money I spent on it resulting in such a small performance margin). However that's for the entire process, from unpacking the tarball, compiling, then tarring and compressing the compiled result. My machine is running Gentoo, it was 'time emerge -OB chromium' (I didn't feel like doing it manually to get just the compile). Am I reading right you've used the result of timing the 'ninja' compile step only?
I only ask because there definitely could be other factors in play for this one - for the uninitiated reading this comment, Chromium is a fairly massive piece of software, the source tar.xz file for the version I tried is 496MB (decompressing to 2757MB), containing around 28,000 directories and a shade under 210,000 files. At that scale, filesystem cache is definitely going to come into play, I would probably expect a slightly different result for a freshly rebooted machine versus one where the compile was timed immediately after unpacking the source code and it was still in RAM (obviously less of a difference on an SSD, but probably still not none).
It is an interesting test metric though, and again I haven't done this on WIndows, but there is a chunk in the middle of the process that seems to be single-threaded on a Linux compile (probably around 10% of the total wall clock time), so it is actually quite nice that it will benefit from both multi-core and single-core performance and boost clocks.
Also with a heavily multi-threaded process of that sort of duration, probably a great test of how long you get before thermal throttling starts to hurt you. I have to admit I'm cheating a bit by watercooling mine (not overclocked though) so it'll happily run 3.3GHz on a base clock of 3.0 across all eight cores for hours on end at around ~45°C/115°F.
rarson - Tuesday, April 11, 2017 - link
14393.969 was released March 20th, any reason you didn't use that build?Ian Cutress - Friday, April 14, 2017 - link
Because my OS is already locked down for the next 12-18 months of testing.Konobi - Tuesday, April 11, 2017 - link
I don't know what's up with those FPS number in rocket league 1080p. I have ye olde FX-8350 @ 4.8GHz and a GTX 1070 @ 2.1GHz and I get 244fps max and 230FPS average at 1080p Ultra.Ian Cutress - Tuesday, April 11, 2017 - link
I'm running a 4x4 bot match on Aquadome. Automated inputs to mimic gameplay and camera switching / tricks, FRAPS over 4 minutes of a match.jfmonty2 - Wednesday, April 12, 2017 - link
Why Aquadome specifically? It's been criticized for performance issues compared to most of the other maps in the game, although the most recent update has improved that.Ian Cutress - Friday, April 14, 2017 - link
On the basis that it's the most strenuous map to test on. Lowest common denominator and all that.Adam Saint - Tuesday, April 11, 2017 - link
"Looking at the results, it’s hard to notice the effect that 12 threads has on multithreaded CPU tests"Perhaps you mean *not* hard to notice? :)
coder543 - Tuesday, April 11, 2017 - link
I agree. That was also confusing.