HiSilicon Kirin 960: A Closer Look at Performance and Power
by Matt Humrick on March 14, 2017 7:00 AM EST- Posted in
- Smartphones
- Mobile
- SoCs
- HiSilicon
- Cortex A73
- Kirin 960
Memory Performance
ARM made several improvements to the A73’s memory system. Both L1 caches see an increase in size, with the I-cache growing from 48KB (A72) to 64KB and the D-cache doubling in size to 64KB. The A73 includes several other changes, such as enhanced prefetching, that should improve cache performance too.
The A73 still has 2 AGUs like the A72, but they are now capable of both load and store operations instead of having each AGU dedicated to a single operation like in the A72, which should improve the issue rate into main system memory.
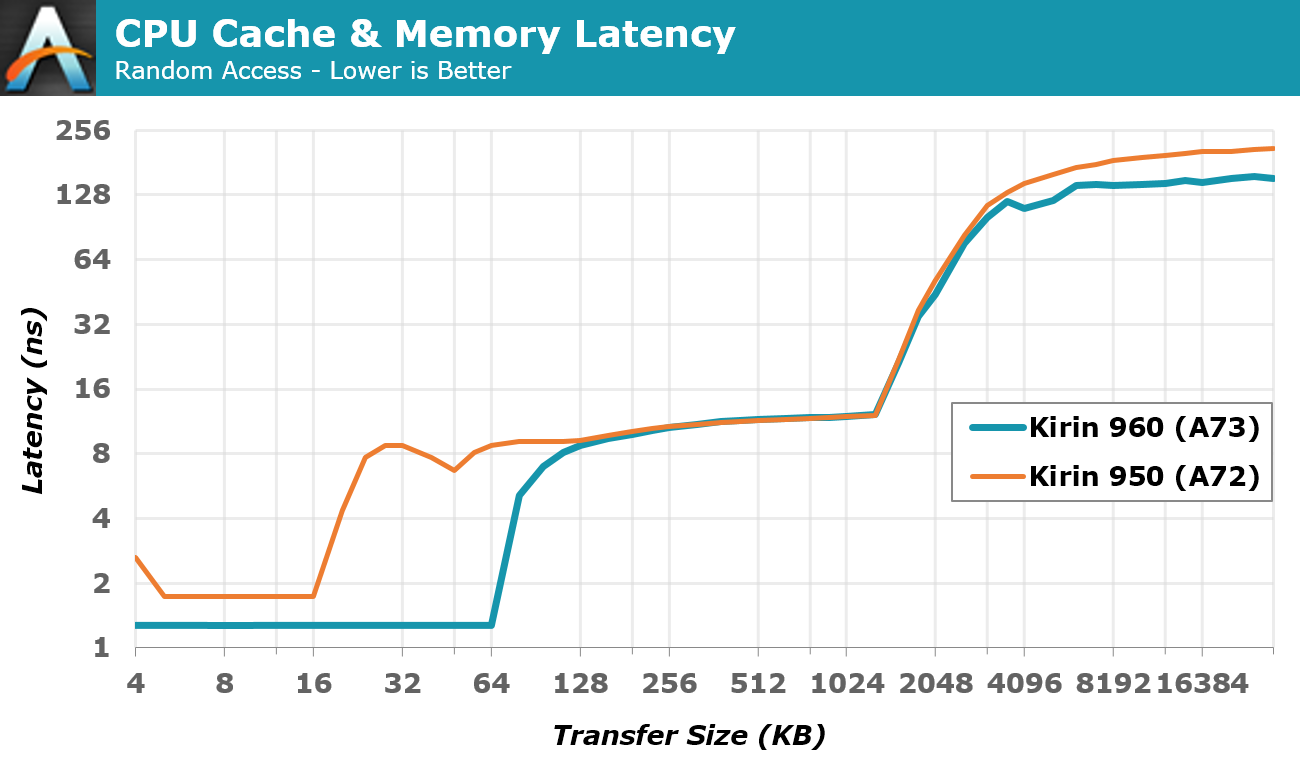
The Kirin 960’s larger 64KB L1 cache maintains a steady latency of 1.27ns versus 1.74ns for the Kirin 950, a 27% improvement that far exceeds the 2.6% difference in CPU frequency, highlighting the A73’s L1 cache improvements. L2 cache latency is essentially the same, but Kirin 960 again shows a 27% latency improvement over Kirin 950 when accessing main memory, which should be beneficial for the latency sensitive CPUs.
Memory bandwidth results are less definitive, however. The Kirin 960 shows up to a 30% improvement in L1 read bandwidth over the Kirin 950 depending on the access pattern used, although L1 write bandwidth is lower by nearly the same amount. The 960’s L2 cache bandwidth is also lower for both read and write by up to about 30%.
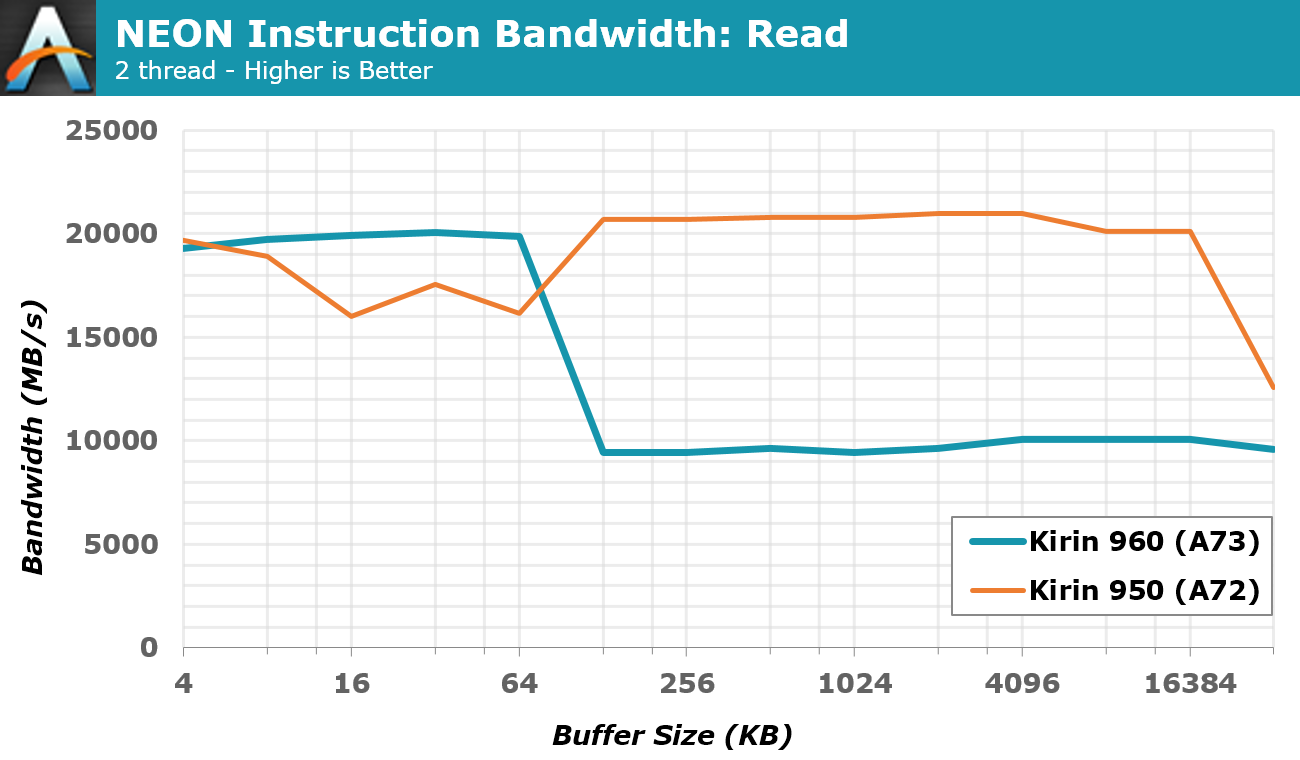
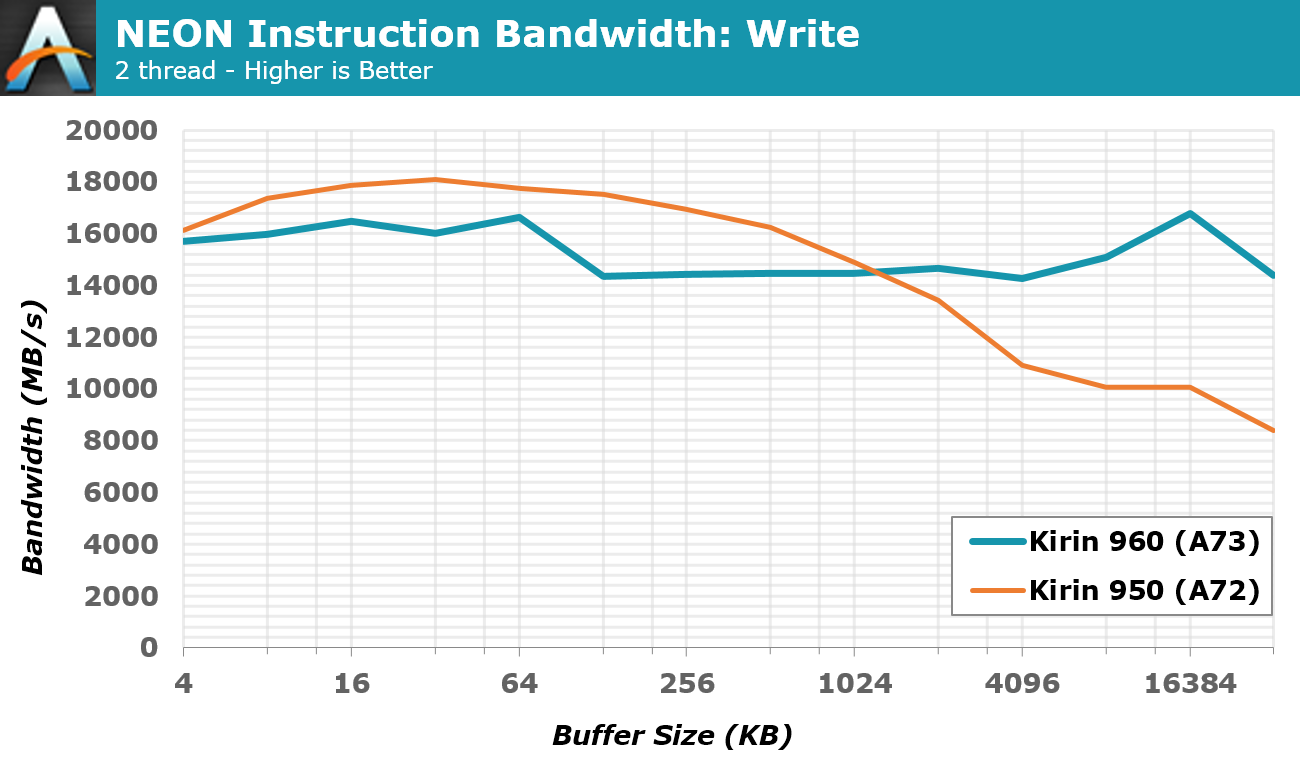
The two graphs above, which show reading and writing NEON instructions using two threads, help to illustrate Kirin 960’s memory bandwidth. When reading instructions, Kirin 960’s L1 cache outperforms the 950’s, but bandwidth drops once it hits the L2 cache. The Kirin 950 outpaces the 960 when writing to both L1 and L2, only falling below the 960’s bandwidth when writing to system memory. This reduction in cache bandwidth could help explain the Kirin 960’s performance regression in several of Geekbench 4’s floating-point tests.
| Geekbench 4 - Memory Performance Single Threaded |
||||
| Kirin 960 | Kirin 950 (% Advantage) |
Exynos 7420 (% Advantage) |
Snapdragon 821 (% Advantage) |
|
| Memory Copy | 4.55 GB/s | 3.67 GB/s (23.87%) |
3.61 GB/s (26.04%) |
7.82 GB/s (-41.84%) |
| Memory Latency | 12.1 Mops/s | 9.6 Mops/s (25.39%) |
5.6 Mops/s (115.67%) |
6.6 Mops/s (81.82%) |
| Memory Bandwidth | 15.5 GB/s | 9.2 GB/s (69.28%) |
7.5 GB/s (105.84%) |
13.5 GB/s (14.53%) |
While the Kirin 960’s L1/L2 cache performance is mixed, it holds a clear advantage over the Kirin 950 when using system memory. Memory latency improves by 25%, about the same amount our internal testing shows, and memory bandwidth improves by 69%. The A73’s two load/store AGUs are likely responsible for a large chunk of the additional memory bandwidth, with the Mate 9’s higher memory bus frequency helping some too.
System Performance
Now it’s time to see how Kirin 960’s lower-level CPU and memory results translate into real-world performance, keeping in mind that OEMs can influence the balance between performance and battery life in a number of ways, including adjusting thermal limits and parameters that govern CPU scheduler and DVFS behavior, which is one reason why two devices with the same SoC can perform differently.
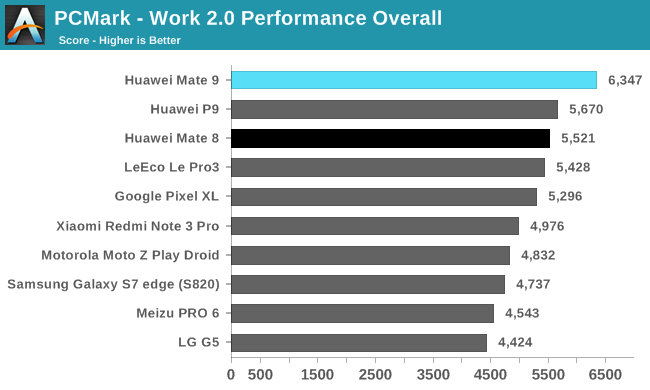
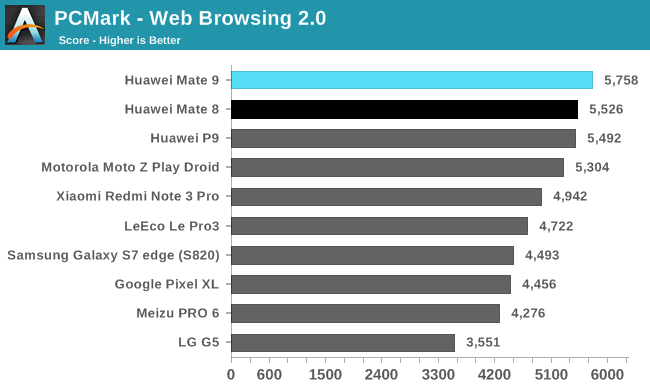
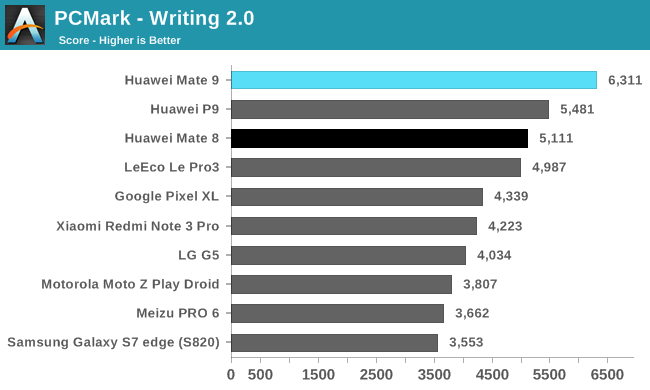
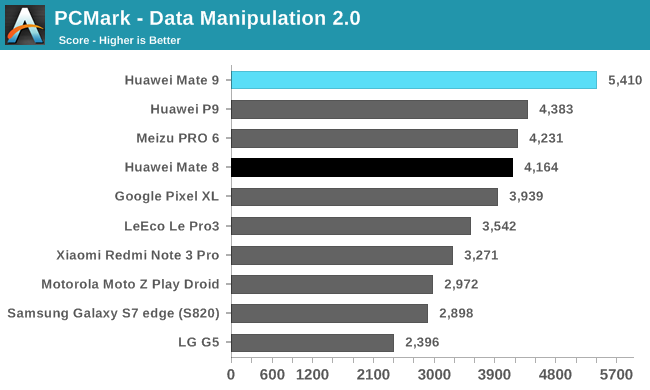
PCMark includes several realistic workloads that stress the CPU, GPU, RAM, and NAND storage using Android API calls many common apps use. The Mate 9 and its Kirin 960 SoC land at the top of each chart, outpacing the Mate 8 and its Kirin 950 by 15% overall and the top-performing Snapdragon 821 phones by up to 20%.
The Mate 9’s advantage over the Mate 8 is only 4% in the Web Browsing test, but it’s still the fastest phone we’ve tested so far. Integer performance is not the Kryo CPU’s strength, and in this integer-heavy test all of the Snapdragon 820/821 phones fall behind SoCs using ARM’s A72 and A73 CPUs, with LeEco’s Le Pro3, the highest performing Snapdragon 821 phone, finishing 18% slower than the Mate 9.
The Writing test performs a variety of operations, including PDF processing and file encryption (both integer workloads), along with some memory operations and even reading and writing some files to internal NAND, and it tends to generate frequent, short bursts of activity on the big CPU cores. This seems to suit the Mate 9 just fine, because it extends its performance advantage over the Mate 8 to 23%. There’s a pretty big spread between the Snapdragon 820/821 phones; the LeEco Le Pro3, the best performer in the family, is 40% faster than the Galaxy S7 edge, a prime example of how other hardware components and OEM software tinkering can affect the overall user experience.
The Data Manipulation test is another primarily integer workload that measures how long it takes to parse chunks of data from several different file types and then records the frame rate while interacting with dynamic charts. In this test, the Mate 9 is 30% faster than the Mate 8 and 37% faster than the Pixel XL.
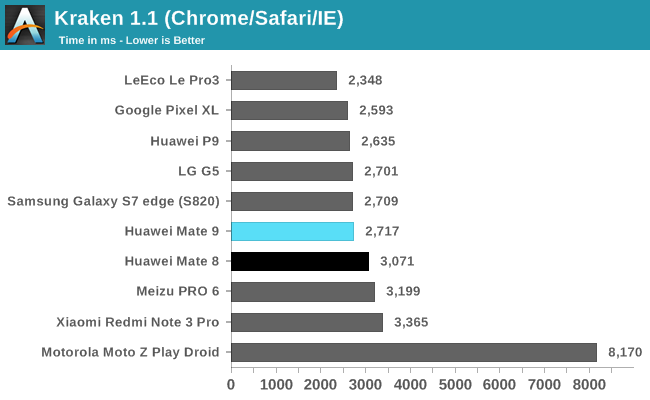
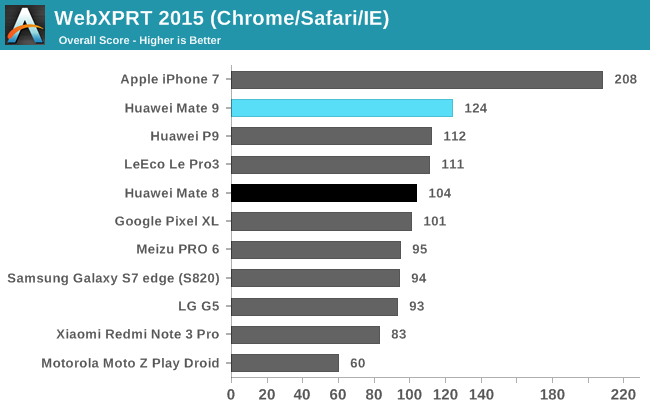
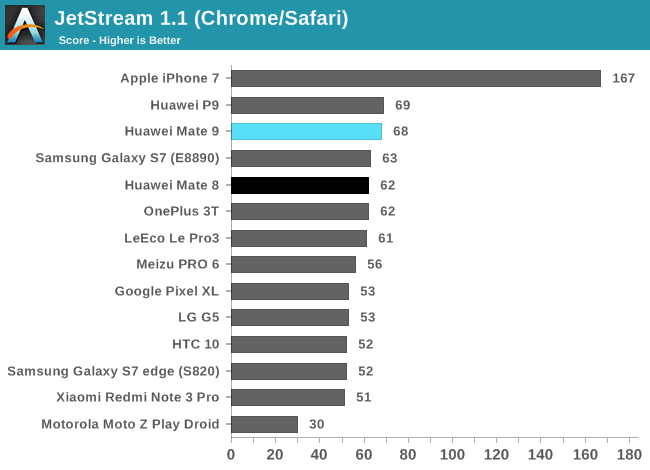
All of the Snapdragon 820/821 phones perform well in the Kraken JavaScript test, pulling ahead of the Mate 9 by a small margin. The P9 uses Kirin 955’s 7% CPU frequency advantage to help it keep up with the Mate 9 in Kraken and JetStream. The Mate 9 still pulls ahead by 11% in WebXPRT 2015, though, and outperforms the Mate 8 by 10% to 19% in all three tests. The Moto Z Play Droid, the only phone in the charts to use an octa-core A53 CPU configuration, cannot even manage half the performance of the Mate 9, which is similar to what our integer IPC tests show.
The Kirin 960 showed mixed results in our lower-level CPU and memory testing, pulling ahead of the Kirin 950 in some areas while falling behind in others. But when looking at system level tests using real-world workloads, the Mate 9 and its Kirin 960 are the clear winners. There are many hardware and software layers between you and the SoC, which is why it’s important not to use an SoC benchmark to test system performance and a system benchmark, such as PCMark, to test CPU performance.


86 Comments
View All Comments
MajGenRelativity - Tuesday, March 14, 2017 - link
I'm a dunce sometimes. I totally missed that. Thank you Ian!fanofanand - Tuesday, March 14, 2017 - link
I love that you have begun moderating (to a degree) the comments section! It's nice to have someone with so much knowledge there to dispel the FUD! Not saying his question was bad, but I really do like that you are getting in the mud with us plebs :)MajGenRelativity - Tuesday, March 14, 2017 - link
My question wasn't bad, just stupid :P Should have read that page a little more closely.fanofanand - Tuesday, March 14, 2017 - link
I didn't mean to imply your question was bad at all, and I certainly wasn't lumping you in with those spreading FUD, but Ian has become a growing presence in the comments section and I for one like what he's doing. The comments section in nearly every tech article has become ugly, and having a calming, logical, rational presence like Ian only helps to contribute to a more polite atmosphere where disagreement can be had without presuming that the person with an opposing viewpoint is Hitler.MajGenRelativity - Tuesday, March 14, 2017 - link
I thought this was the Internet, where the opposing viewpoint is always Hitler? :Pfanofanand - Tuesday, March 14, 2017 - link
Hitler has become omnipresent, now the Barrista who underfoams your latte must be Hitler!lilmoe - Tuesday, March 14, 2017 - link
Shouldn't this provide you with even more evidence that max frequency workloads are super artificial, and are completely unrepresentative of normal, day-to-day workloads? This further supports my claim in earlier article comments that chip designers are targeting a certain performance target, and optimizing efficiency for that point in particular.I keep saying this over and over (like a broken record at this point), but I do firmly believe that the benchmarking methodology for mobile parts of the entire blogsphere is seriously misleading. You're testing these processors the same way you would normally do for workstation processors. The author even said it himself, but the article contradicts his very statement. I believe further research/investigations should be done as to where that performance target is. It definitely defers from year to year, with different popular app trends, and from OS upgrade to another.
Spec, Geekbench and browser benchmarks, if tested in context of same device, same OS upgrades, are a good indication of what the chip can artificially achieve. But the real test, I believe, is launching a website, using facebook, snapchat, etc., and comparing power draw of various chips, since that's what these chips were designed to run.
There's also the elephant in the room that NO ONE is accounting for when testing and benchmarking, and that's touch input overhead. Most user interaction is through touch. I don't know about iOS, but everyone knows that Android ramps up the clock when the touchscreen detects input to reduce lag and latency. Your browser battery test DO NOT account for that, further reducing its potential credibility as a valid representation of actual usage.
I mention touch input clock ramps in particular because I believe this is the clock speed that OEMs believe it delivers optimal efficiency on the performance curve for a given SoC, at least for the smaller cluster. A better test would be logging the CPU clocks of certain workloads, and taking the average, then calculating the power draw of the CPU on that particular average clock.
This is where I believe Samsung's SoCs shine the most. I believe they deliver the best efficiency for common workloads, evident in the battery life of their devices after normalization of screen size/resolution to battery capacity.
Worth investigating IMO.
fanofanand - Tuesday, March 14, 2017 - link
If you can come up with a methodology where opening snapchat is a repeatable scientific test, send your hypothesis to Ryan, I'm sure he will indulge your fantasy.lilmoe - Tuesday, March 14, 2017 - link
Yea, we all love fantasies. Thing is, in the last couple of paragraphs, Matt literally said that the entirety of the review does not match with the actual real-world performance and battery life of the Mate 9.But sure, go ahead and keep testing mobile devices using these "scientific" conventional anyway, since it makes readers like fanofanand happy.
close - Tuesday, March 14, 2017 - link
That is, of course, an awesome goal. Now imagine the next review the battery life varies between 10 and 18 hours even on the same phone. Now judge for yourself if this kind of result is more useful to determine which phone has a better battery life. Not only is your real world usage vastly different from mine (thus irrelevant) but you yourself can't even get through 2 days with identical battery life or identical usage. If you can't determine one phone's battery life properly how do you plan on comparing that figure to the ones I come up with?If you judged your comment by the same standards you judge the article you wouldn't have posted it. You implicitly admit there's no good way of testing in the manner you suggest (by refusing or being unable to provide a clearly better methodology) but still insisted on posting it. I will join the poster above in asking you to suggest something better. And don't skimp on the details. I'm sure that if you have a reasonable proposal it will be taken into consideration not for your benefit but for all of ours.
Some of these benchmarks try to simulate a sort of average real world usage (a little bit of everything) in a reproducible manner in order to be used in a comparison. That won't be 100% relevant but there is a good overlap and it's the best comparative tool we've got. Your generic suggestion would most likely provide even less relevant figures unless you come up with that better scenario that you insist on keeping to yourself.