The NVIDIA GeForce GTX 1080 & GTX 1070 Founders Editions Review: Kicking Off the FinFET Generation
by Ryan Smith on July 20, 2016 8:45 AM ESTRise of the Tomb Raider
Starting things off in our benchmark suite is the built-in benchmark for Rise of the Tomb Raider, the latest iteration in the long-running action-adventure gaming series. One of the unique aspects of this benchmark is that it’s actually the average of 4 sub-benchmarks that fly through different environments, which keeps the benchmark from being too weighted towards a GPU’s performance characteristics under any one scene.
To kick things off then, while I picked the benchmark order before collecting the performance results, it’s neat that Rise of the Tomb Raider ends up being a fairly consistent representation of how the various video cards compare to each other. The end result, as you might expect, puts the GTX 1080 and GTX 1070 solidly in the lead. And truthfully there’s no reason for it to be anything but this; NVIDIA does not face any competition from AMD at the high-end at this point, so the two GP104 cards are going to be unrivaled. It’s not a question of who wins, but by how much.
Overall we find the GTX 1080 ahead of its predecessor, the GTX 980, by anywhere between 60% and 78%, with the lead increasing with the resolution. The GTX 1070’s lead isn’t quite as significant though, ranging from 53% to 60#. This is consistent with the fact that the GTX 1070 is specified to trail the GTX 1080 by more than we saw with the 980/970 in 2014, which means that in general the GTX 1070 won’t see quite as much uplift.
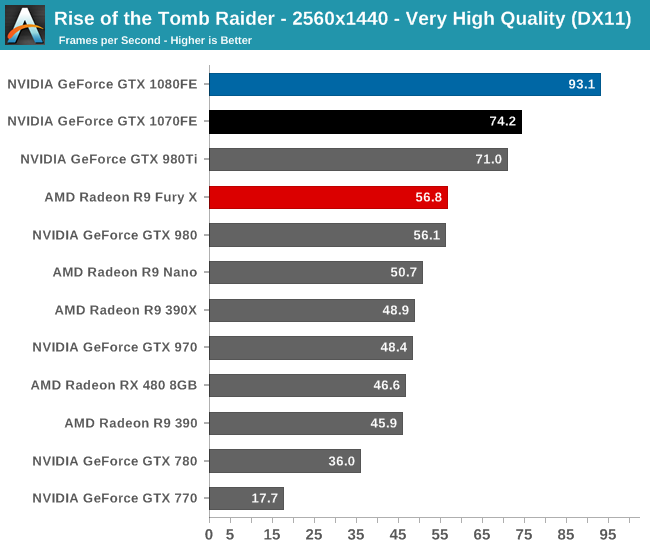
What we do get however is confirmation that the GTX 1070FE is a GTX 980 Ti and more. The performance of what was NVIDIA’s $650 flagship can now be had in a card that costs $450, and with any luck will get cheaper still as supplies improve. For 1440p gamers this should hit a good spot in terms of performance.
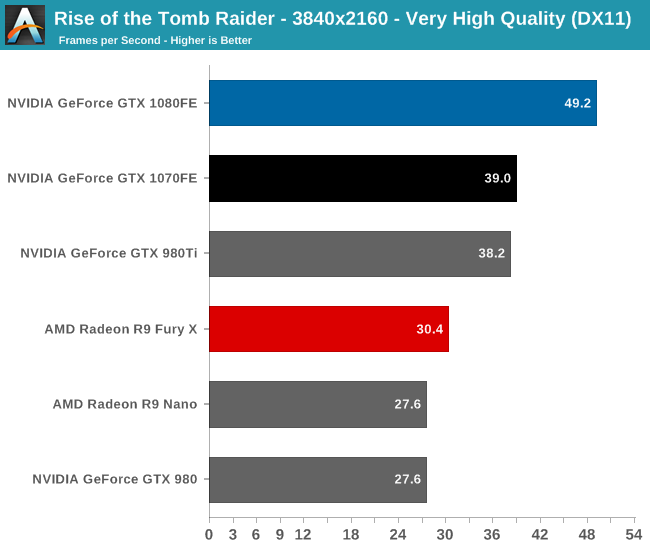
Otherwise when it comes to 4K gaming, NVIDIA has made a lot of progress thanks to GTX 1080, but even their latest and greatest card isn’t quite going to crack 60fps here. We haven’t yet escaped having to made quality tradeoffs for 4K at this time, and it’s likely that future games will drive that point home even more.
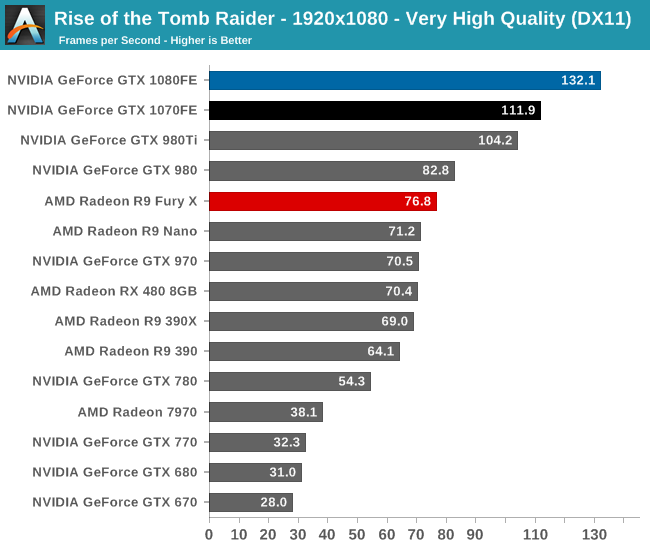
Finally, 1080p is admittedly here largely for the sake of including much older cards like the GTX 680, to show what kind of progress NVIDIA has made since their first 28nm high-end card. The result? A 4.25x performance increase over the GTX 680.


200 Comments
View All Comments
TestKing123 - Wednesday, July 20, 2016 - link
Then you're woefully behind the times since other sites can do this better. If you're not able to re-run a benchmark for a game with a pretty significant patch like Tomb Raider, or a high profile game like Doom with a significant performance patch like Vulcan that's been out for over a week, then you're workflow is flawed and this site won't stand a chance against the other crop. I'm pretty sure you're seeing this already if you have any sort of metrics tracking in place.TheinsanegamerN - Wednesday, July 20, 2016 - link
So question, if you started this article on may 14th, was their no time in the over 2 months to add one game to that benchmark list?nathanddrews - Wednesday, July 20, 2016 - link
Seems like an official addendum is necessary at some point. Doom on Vulkan is amazing. Dota 2 on Vulkan is great, too (and would be useful in reviews of low end to mainstream GPUs especially). Talos... not so much.Eden-K121D - Thursday, July 21, 2016 - link
Talos Principle was a proof of conceptajlueke - Friday, July 22, 2016 - link
http://www.pcgamer.com/doom-benchmarks-return-vulk...Addendum complete.
mczak - Wednesday, July 20, 2016 - link
The table with the native FP throughput rates isn't correct on page 5. Either it's in terms of flops, then gp104 fp16 would be 1:64. Or it's in terms of hw instruction throughput - then gp100 would be 1:1. (Interestingly, the sandra numbers for half-float are indeed 1:128 - suggesting it didn't make any use of fp16 packing at all.)Ryan Smith - Wednesday, July 20, 2016 - link
Ahh, right you are. I was going for the FLOPs rate, but wrote down the wrong value. Thanks!As for the Sandra numbers, they're not super precise. But it's an obvious indication of what's going on under the hood. When the same CUDA 7.5 code path gives you wildly different results on Pascal, then you know something has changed...
BurntMyBacon - Thursday, July 21, 2016 - link
Did nVidia somehow limit the ability to promote FP16 operations to FP32? If not, I don't see the point in creating such a slow performing FP16 mode in the first place. Why waste die space when an intelligent designer can just promote the commands to get normal speeds out of the chip anyways? Sure you miss out on speed doubling through packing, but that is still much better than the 1/128 (1/64) rate you get using the provided FP16 mode.Scali - Thursday, July 21, 2016 - link
I think they can just do that in the shader compiler. Any FP16 operation gets replaced by an FP32 one.Only reading from buffers and writing to buffers with FP16 content should remain FP16. Then again, if their driver is smart enough, it can even promote all buffers to FP32 as well (as long as the GPU is the only one accessing the data, the actual representation doesn't matter. Only when the CPU also accesses the data, does it actually need to be FP16).
owan - Wednesday, July 20, 2016 - link
Only 2 months late and published the day after a different major GPU release. What happened to this place?