The NVIDIA GeForce GTX 1080 & GTX 1070 Founders Editions Review: Kicking Off the FinFET Generation
by Ryan Smith on July 20, 2016 8:45 AM ESTOverclocking
For our final evaluation of the GTX 1080 and GTX 1070 Founders Edition cards, let’s take a look a overclocking.
Whenever I review an NVIDIA reference card, I feel it’s important to point out that while NVIDIA supports overclocking – why else would they include fine-grained controls like GPU Boost 3.0 – they have taken a hard stance against true overvolting. Overvolting is limited to NVIDIA’s built in overvoltage function, which isn’t so much a voltage control as it is the ability to unlock 1-2 more boost bins and their associated voltages. Meanwhile TDP controls are limited to whatever value NVIDIA believes is safe for that model card, which can vary depending on its GPU and its power delivery design.
For GTX 1080FE and its 5+1 power design, we have a 120% TDP limit, which translates to an absolute maximum TDP of 216W. As for GTX 1070FE and its 4+1 design, this is reduced to a 112% TDP limit, or 168W. Both cards can be “overvolted” to 1.093v, which represents 1 boost bin. As such the maximum clockspeed with NVIDIA’s stock programming is 1911MHz.
| GeForce GTX 1080FE Overclocking | ||||
| Stock | Overclocked | |||
| Core Clock | 1607MHz | 1807MHz | ||
| Boost Clock | 1734MHz | 1934MHz | ||
| Max Boost Clock | 1898MHz | 2088MHz | ||
| Memory Clock | 10Gbps | 11Gbps | ||
| Max Voltage | 1.062v | 1.093v | ||
| GeForce GTX 1070FE Overclocking | ||||
| Stock | Overclocked | |||
| Core Clock | 1506MHz | 1681MHz | ||
| Boost Clock | 1683MHz | 1858MHz | ||
| Max Boost Clock | 1898MHz | 2062MHz | ||
| Memory Clock | 8Gbps | 8.8Gbps | ||
| Max Voltage | 1.062v | 1.093v | ||
Both cards ended up overclocking by similar amounts. We were able to take the GTX 1080FE another 200MHz (+12% boost) on the GPU, and another 1Gbps (+10%) on the memory clock. The GTX 1070 could be pushed another 175MHz (+10% boost) on the GPU, while memory could go another 800Mbps (+10%) to 8.8Gbps.
Both of these are respectable overclocks, but compared to Maxwell 2 where our reference cards could do 20-25%, these aren’t nearly as extreme. Given NVIDIA’s comments on the 16nm FinFET voltage/frequency curve being steeper than 28nm, this could be first-hand evidence of that. It also indicates that NVIDIA has pushed GP104 closer to its limit, though that could easily be a consequence of the curve.
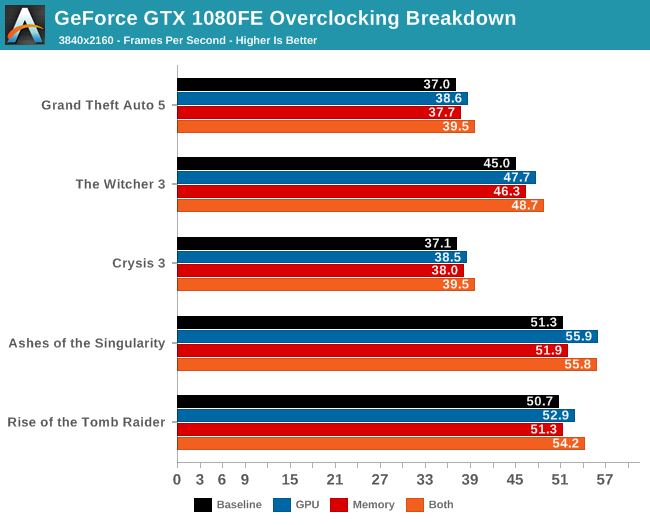
Given that this is our first look at Pascal, before diving into overall performance, let’s first take a look at an overclocking breakdown. NVIDIA offers 4 knobs to adjust when overclocking: overvolting (unlocking additional boost bins), increasing the power/temperature limits, the memory clock, and the GPU clock. Though all 4 will be adjusted for a final overclock, it’s often helpful to see whether it’s GPU overclocking or memory overclocking that delivers the greater impact, especially as it can highlight where the performance bottlenecks are on a card.
To examine this, we’ve gone ahead and benchmarked the GTX 1080 4 times: once with overvolting and increased power/temp limits (to serve as a baseline), once with the memory overclocked added, once with GPU overclock added, and finally with both the GPU and memory overclocks added.
| GeForce GTX 1080 Overclocking Performance | ||||||
| Power/Temp Limit (+20%) | Core (+12%) | Memory (+10%) | Cumulative | |||
| Tomb Raider |
+3%
|
+4%
|
+1%
|
+10%
|
||
| Ashes |
+1%
|
+9%
|
+1%
|
+10%
|
||
| Crysis 3 |
+4%
|
+4%
|
+2%
|
+11%
|
||
| The Witcher 3 |
+2%
|
+6%
|
+3%
|
+10%
|
||
| Grand Theft Auto V |
+1%
|
+4%
|
+2%
|
+8%
|
||
Across all 5 games, the results are clear and consistent: GPU overclocking contributes more to performance than memory overclocking. To be sure, both contribute, but even after compensating for the fact that the GPU overclock was a bit greater than the memory overclock (12% vs 10%), we still end up with the GPU more clearly contributing. Though I am a bit surprised that increasing the power/temperature limit didn't have more of an effect.
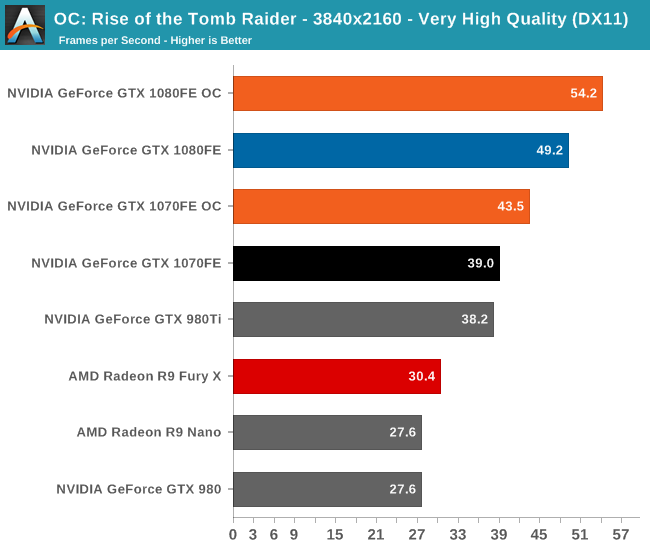
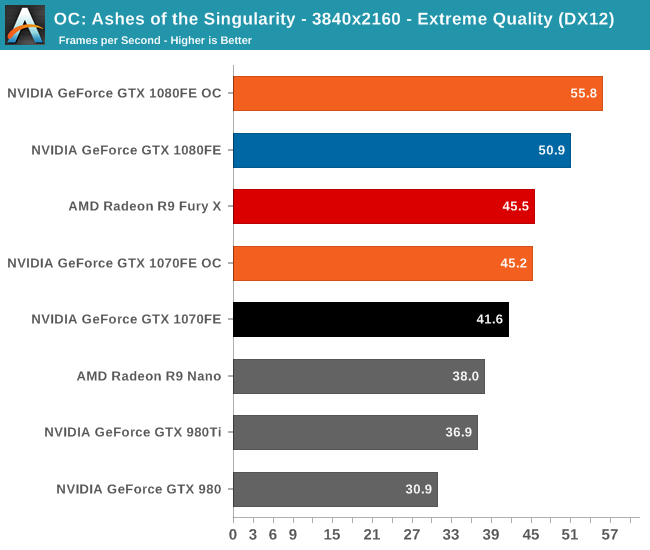

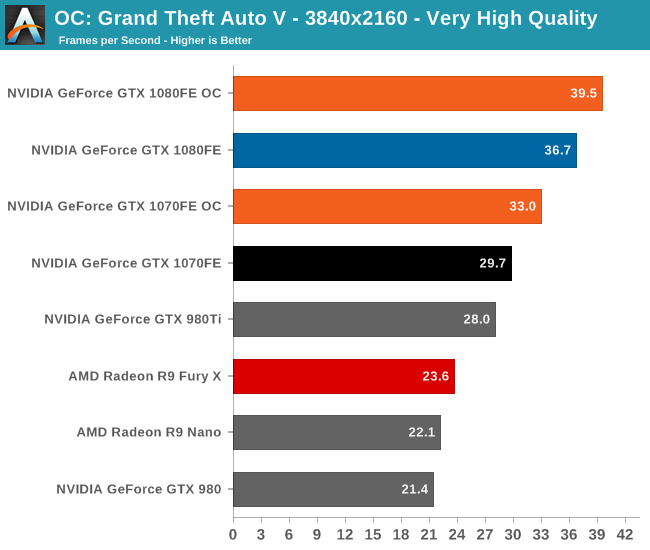
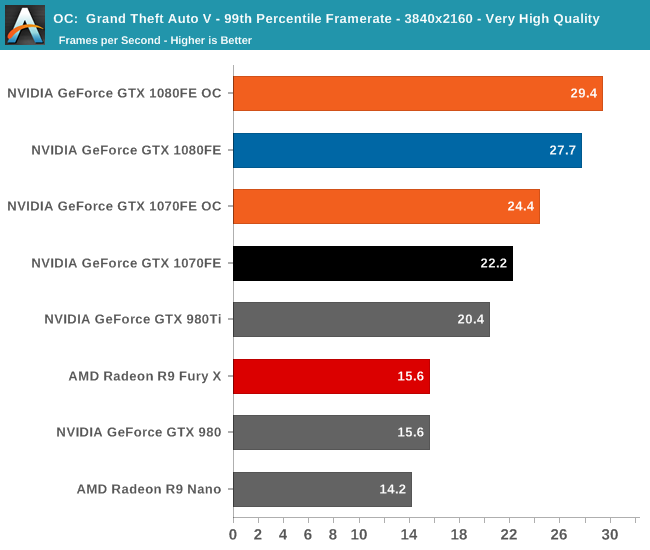
Overall we’re looking at an 8%-10% increase in performance from overclocking. It’s enough to further stretch the GTX 1080FE and GTX 1070FE’s leads, but it won’t radically alter performance.
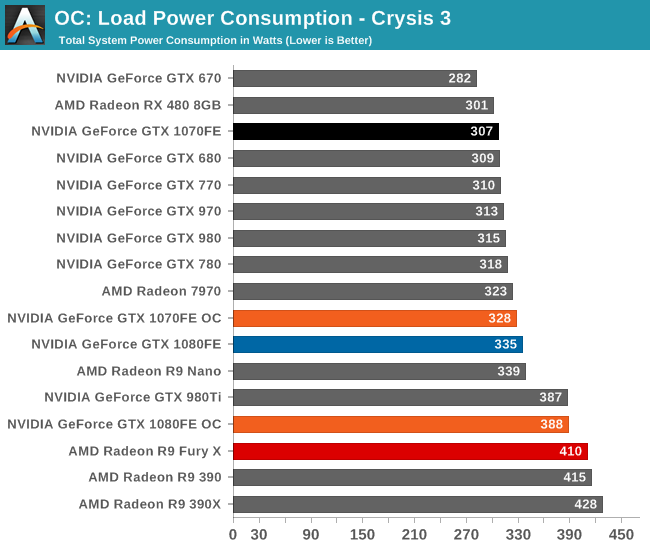
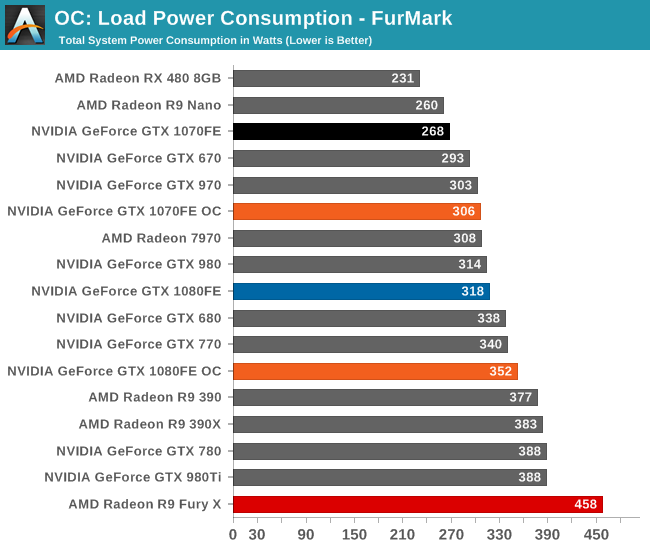
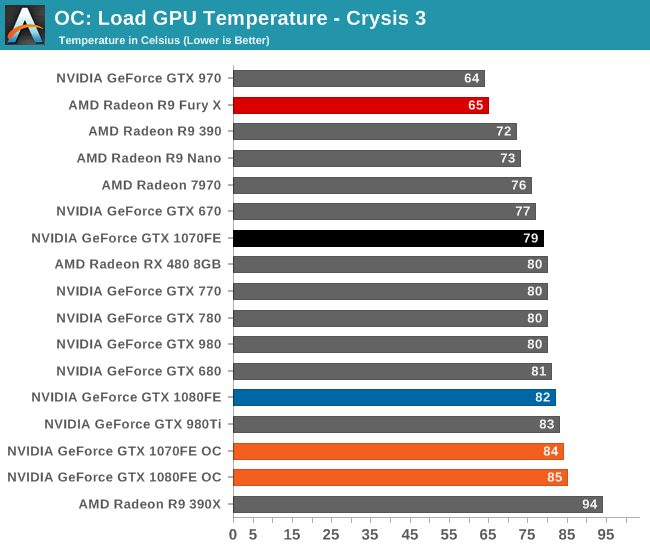
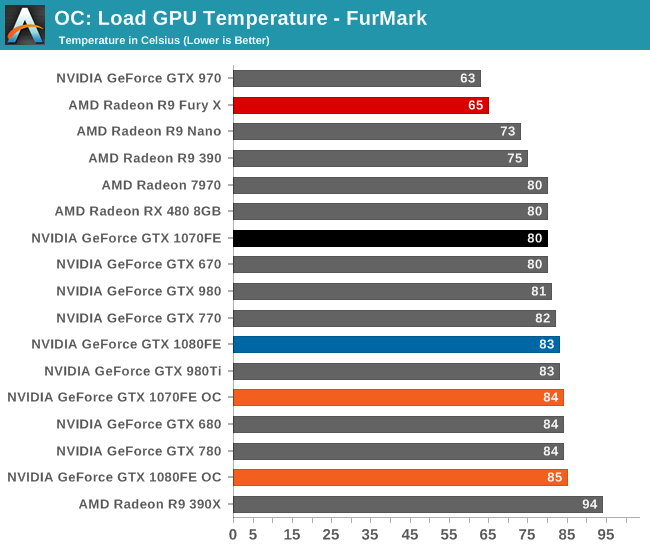
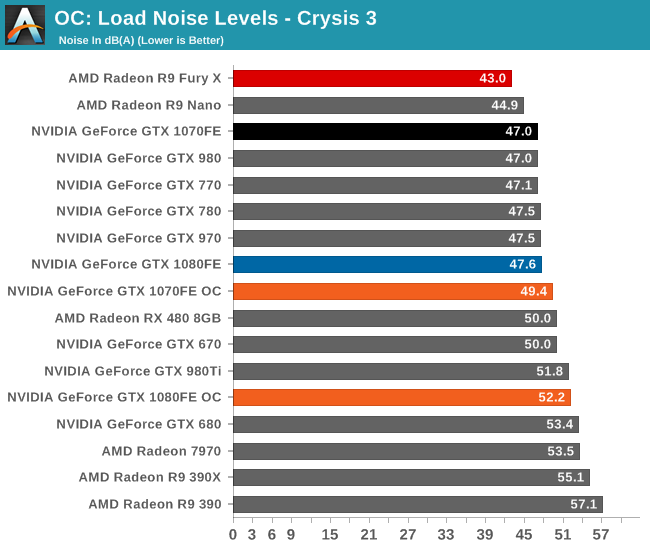
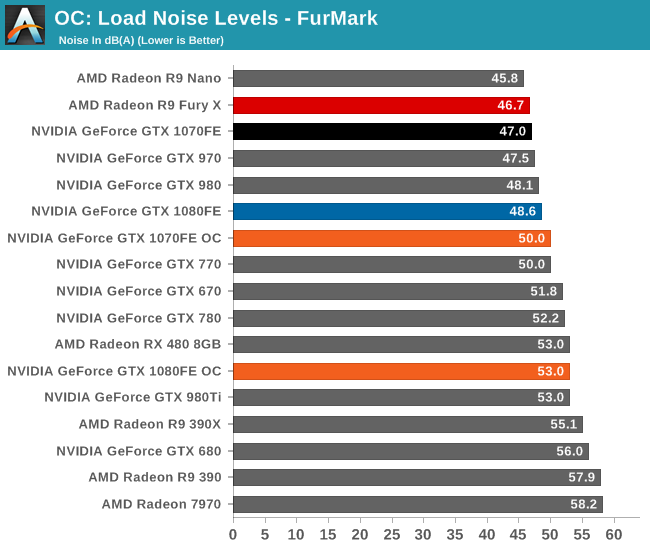
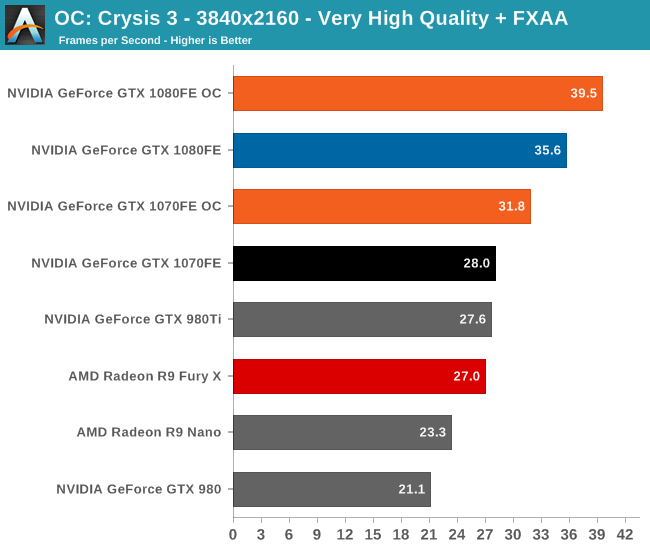
Finally, let’s see the cost of overclocking in terms of power, temperature, and noise. For the GTX 1080FE, the power cost at the wall proves to be rather significant. An 11% Crysis 3 performance increase translates into a 60W increase in power consumption at the wall, essentially moving GTX 1080FE into the neighborhood of NVIDIA’s 250W cards like the GTX 980 Ti. The noise cost is also not insignificant, as GTX 1080FE has to ramp up to 52.2dB(A), a 4.6dB(A) increase in noise. Meanwhile FurMark essentially confirms these findings, with a smaller power increase but a similar increase in noise.
As for the GTX 1070FE, neither the increase in power consumption nor noise is quite as high as GTX 1080FE, though the performance uplift is also a bit smaller. The power penalty is just 21W at the wall for Crysis 3 and 38W for FurMark. This translates to a 2-3dB(A) increase in noise, topping out at 50.0dB for FurMark.


200 Comments
View All Comments
Eidigean - Wednesday, July 20, 2016 - link
Excellent article Ryan.Will you be writing a followup article with tests of two GTX 1080's in SLI with the new high-bandwidth dual bridge?
Looking specifically for these tests in SLI:
3840x2160
2560x1440
3x 2560x1440 (7680x1440)
3x 1920x1080 (5760x1080)
Hoping the latter two tests would include with and without multi-projection optimizations.
Thanks!
Ryan Smith - Wednesday, July 20, 2016 - link
"Will you be writing a followup article with tests of two GTX 1080's in SLI with the new high-bandwidth dual bridge?"It's on the schedule. But not in the near term, unfortunately. GPU Silly Season is in full swing right now.
big dom - Wednesday, July 20, 2016 - link
I agree with the previous reviewers. It's fine and dandy to be a "day one" breakthrough reviewer and believe me I read and enjoyed 20 of those other day 1 reviews as well. But... IMO no one writes such an in depth, technical, and layman-enjoyable review like Anandtech. Excellent review fellas!This is coming from a GTX 1070 FE owner, and I am also the other of the original Battleship Mtron SSD article.
Regards,
Dominick
big dom - Wednesday, July 20, 2016 - link
*authorjase240 - Wednesday, July 20, 2016 - link
I don't understand why in your benchmarks the framerates are so low. For example I have a 1070 and am able to play GTAV at very high settings and achieve 60fps constant at 4K.(No MSAA obviously)Even other reviewers have noted much higher framerates. Listing the 1080 as a true 4K card and the 1070 as a capable 4K card too.
Ryan Smith - Wednesday, July 20, 2016 - link
It depends on the settings.The way I craft these tests is settings centric. I pick the settings and see where the cards fall. Some other sites have said that they see what settings a card performs well at (e.g. where it gets 60fps) and then calibrate around that.
The end result is that the quality settings I test are most likely higher than the sites you're comparing this article to.
jase240 - Wednesday, July 20, 2016 - link
Ah now I see why, you have the advanced graphics settings turned up also. These are not turned on by default in GTAV since they cause great performance loss.Extended Distance Scaling, Extended Shadows Distance, Long Shadows, High Resolution Shadows, High Detail Streaming While Flying.
They eat a lot of VRAM and perform terribly at higher resolutions.
sonicmerlin - Thursday, July 21, 2016 - link
And I'm guessing add very little to overall picture quality.Mat3 - Wednesday, July 20, 2016 - link
I think there's something wrong with your Fury X in a couple of your compute tests. How's it losing to a Nano?masouth - Wednesday, July 20, 2016 - link
I know the article was posted today but when was it actually written? NewEgg has been having the dual fan Gigabyte GTX 1070 at $399 for a couple weeks now. Yes, it's still $20 over the MSRP and frequently sells out as quick as they show up but it's still a fair deal cheaper than $429.