Why an Overclockable Core i3 Might Not Exist: The Supermicro C7H170-M and Intel Core i3-6100TE Review
by Ian Cutress on March 17, 2016 10:30 AM EST- Posted in
- CPUs
- Intel
- Motherboards
- Core i3
- Supermicro
- Overclocking
Base Clock Overclocking the Core i3-6100TE: Scaling
As mentioned at several points in this overall piece, overclocking using the Supermicro C7H170-M was actually really easy. There is a single option in the BIOS under ‘Extra Performance’ where you can change the base frequency from 100 MHz to 150 MHz in 5 MHz increments. This doesn’t adjust the processor voltage, and we have no load line calibrations, but that didn’t seem to matter much.
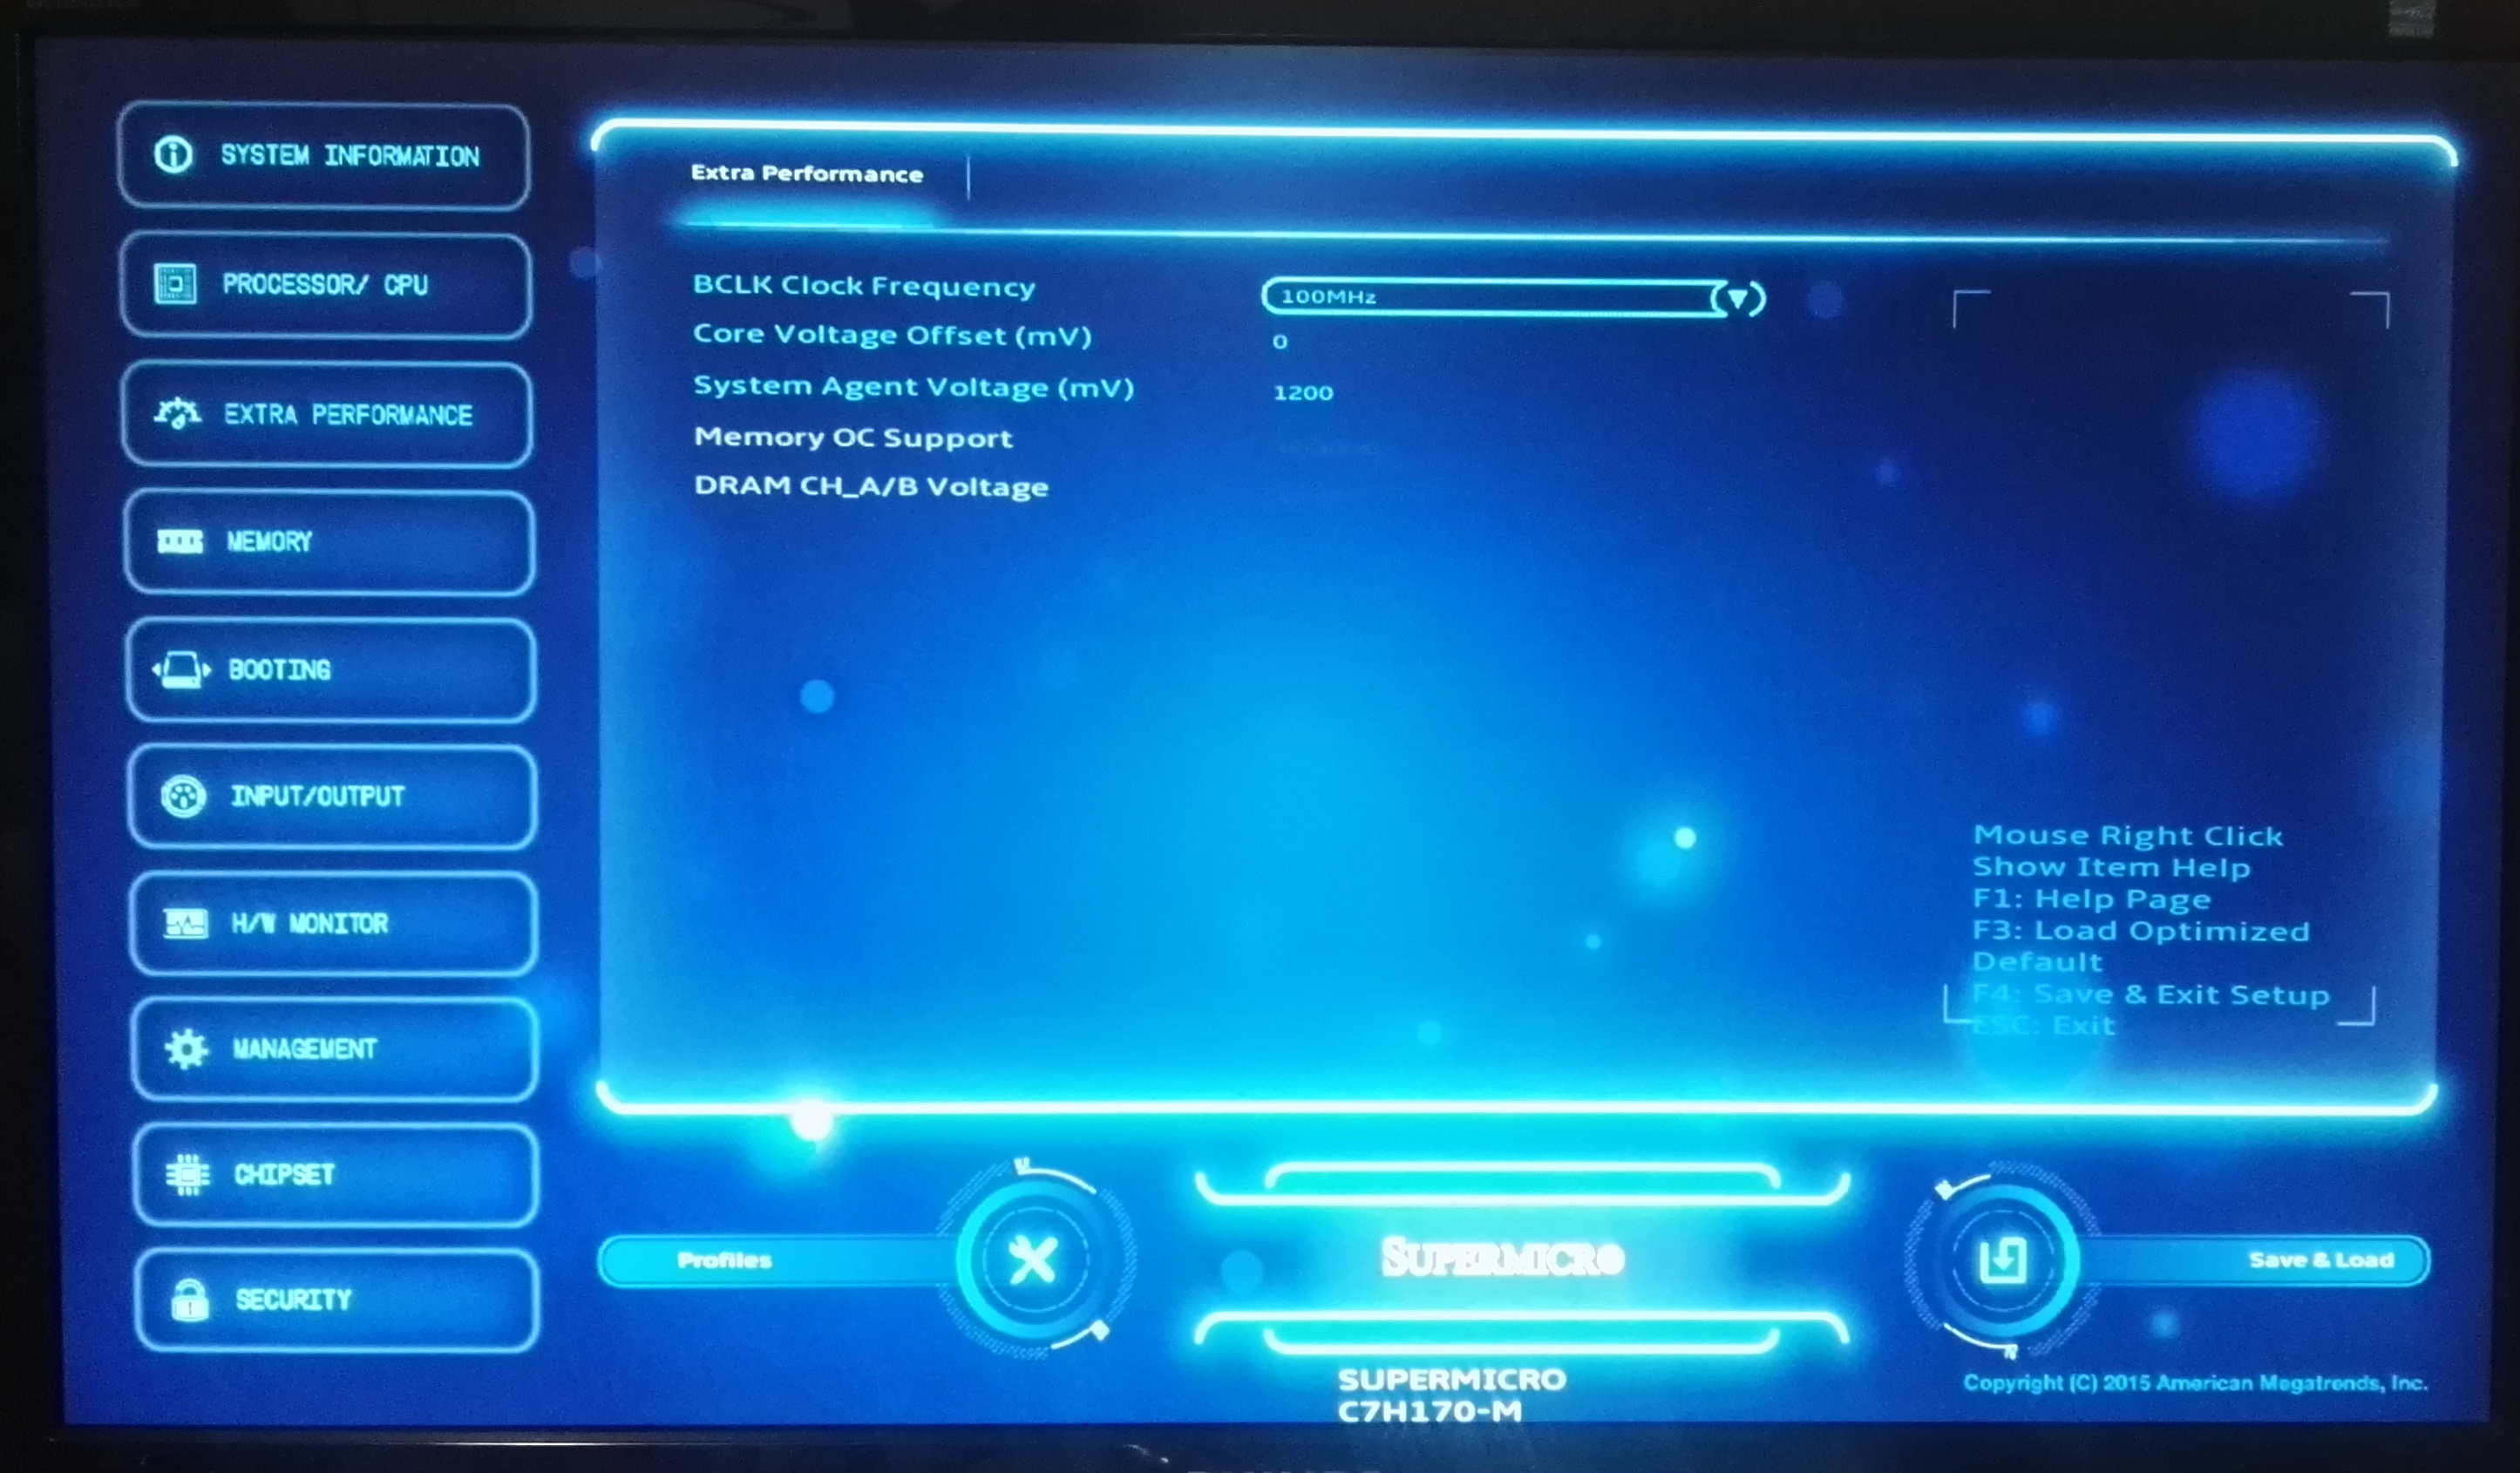
There is an option for Core Voltage Offset, although I’m not so much a fan of offsets when I saw a motherboard a couple of years ago apply a double offset, and I freaked out in case it burned out that $999 CPU. In this case though, we did not have much trouble.
Adjusting the base frequency will adjust the memory speed as well, so the two main limitations will be the processor itself (either physical limits, temperature or voltage) and the memory (also limits, temperature and voltage). This can become tricky to manage as a 35% overclock on DDR4-2133 memory can instantly push it to DDR4-2880. There is an option to reduce the memory multiplier if needed in the BIOS.
As for testing the limits of overclocking, we employed our regular methodology. Increase the frequency, run a pass of our POV-Ray benchmark followed by five minutes of OCCT, noting the voltage, temperature and power where possible. If it passes these two tests, we reboot into the BIOS and increase the frequency. If we fail the test, we would typically go back and reduce the voltage, however this wasn’t needed here. Our results are as follows:
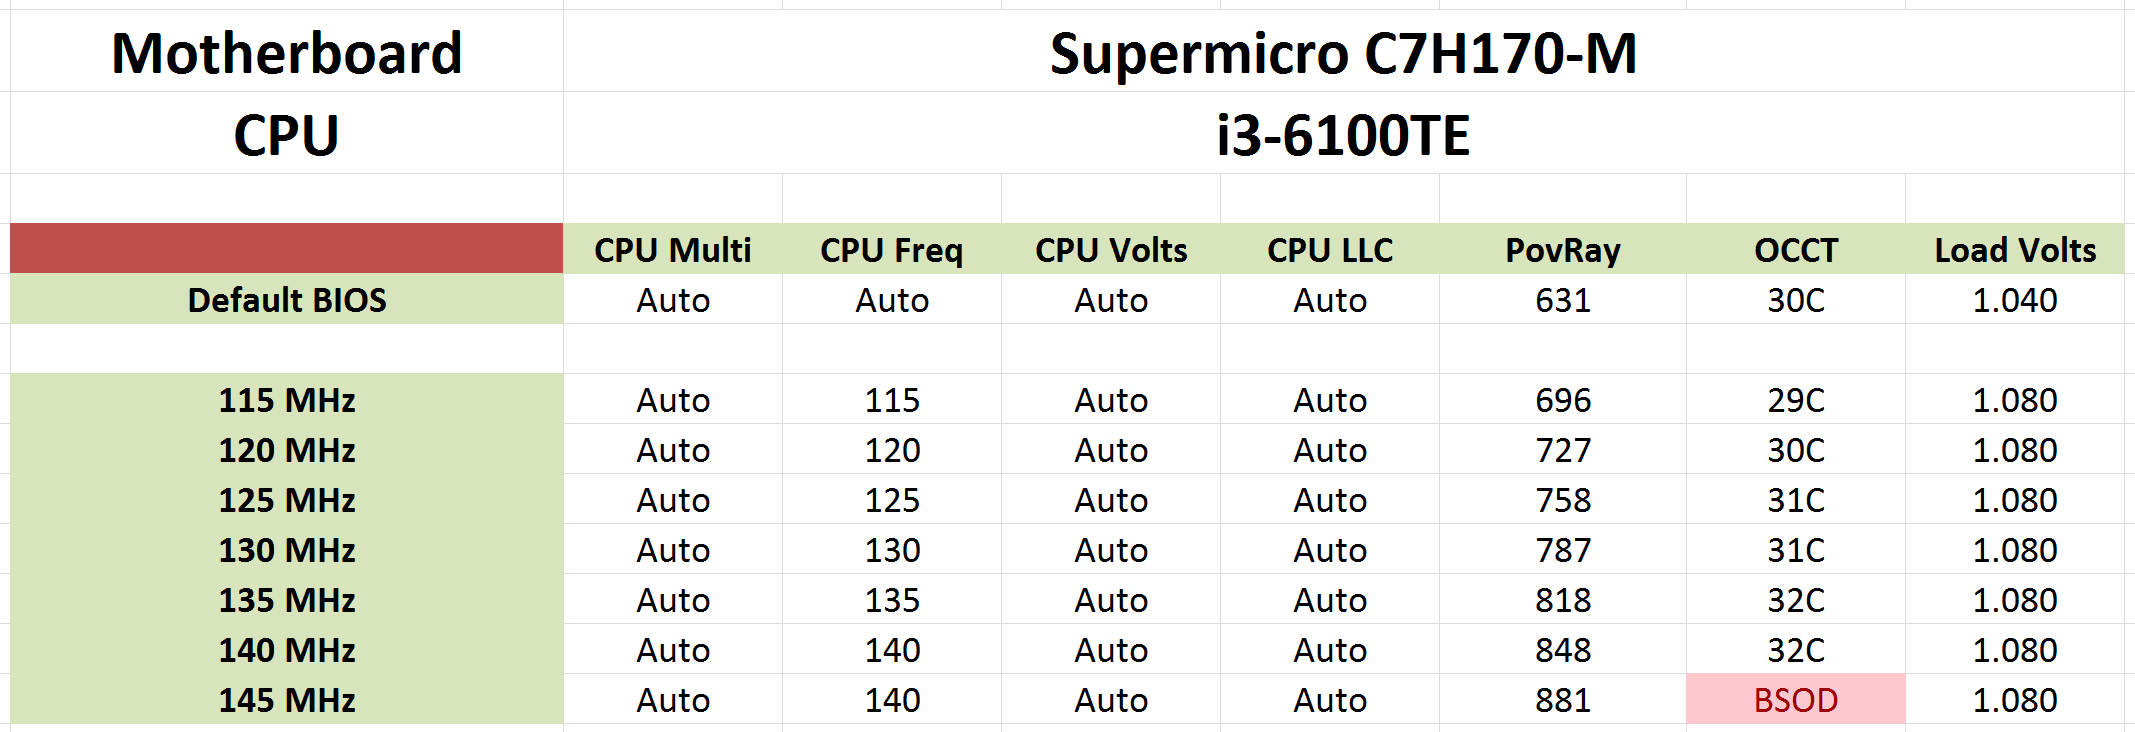
In this case our CPU worked well all through our tests until 145 MHz, or 3.915 GHz for the processor that starts as a 2.7 GHz part. Here when we applied a strong load, it caused the system to blue screen. We tried with other benchmarks, and confirmed that the system was sort of stable, except for gaming and video editing. So as a result we moved back down the scale and found 135 MHz a reasonable compromise for the testing for the full benchmark suite.
But for testing the scaling of the overclock we did our short form benchmark suite on 100, 130, 135 and 140 MHz do see if performance in these benchmarks can accurately scale. As one of the bigger questions, we of course also did some gaming benchmark testing, using our GTX 980 at each of the points. For users interested in R9 285, R9 290 and GTX 770 data at 135 MHz, please look at our benchmark database.
Testing the Scaling – CPU Short Form
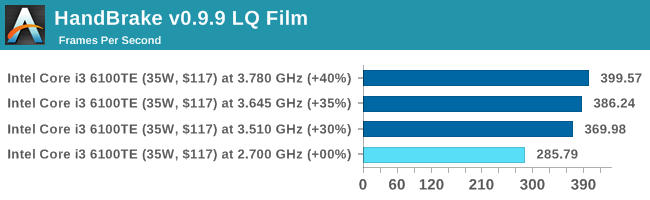
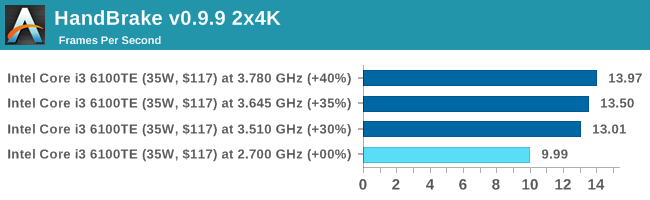
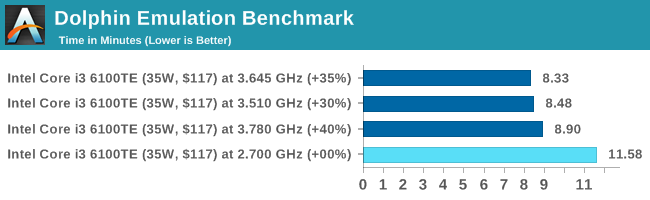
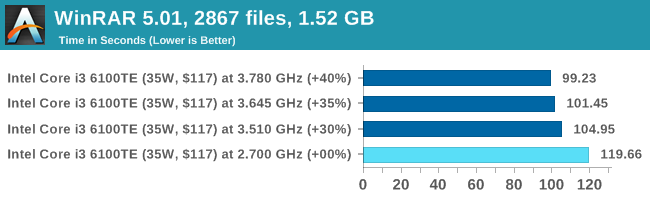
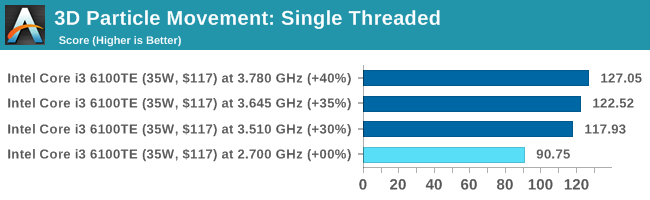
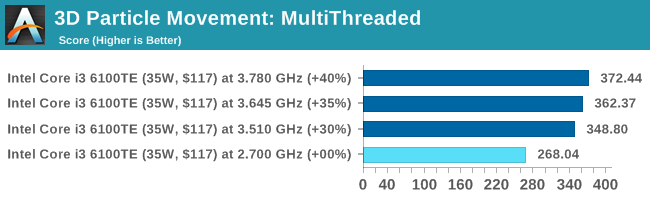
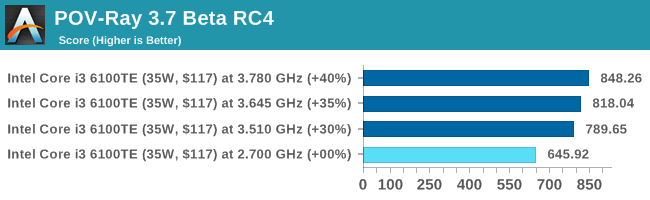
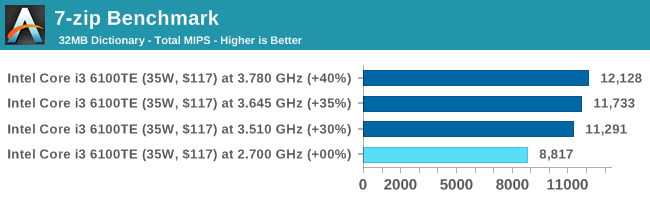
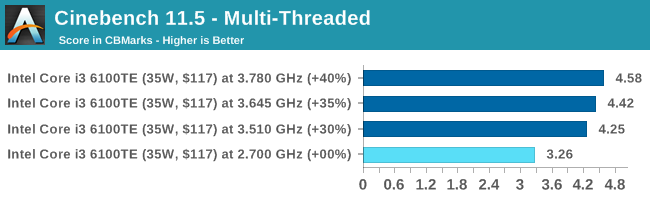
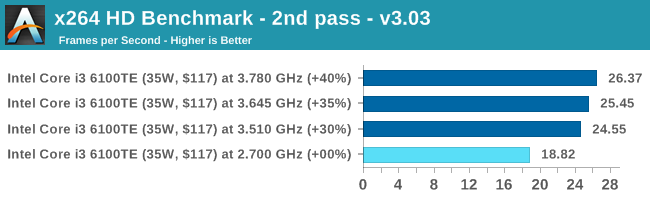
In all of our short form tests, the scaling from 2.7 GHz to 3.78 GHz was near perfect, particularly in 3DPM single threaded. The more you put in, the proportional you get out.
Testing the Scaling – CPU Extra
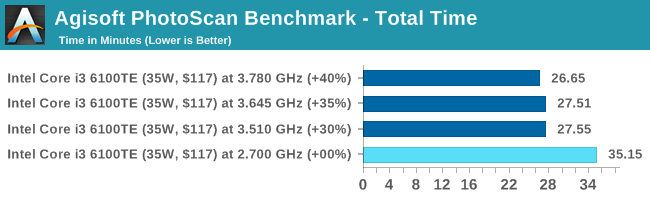
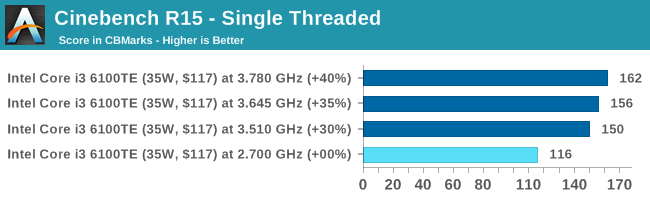

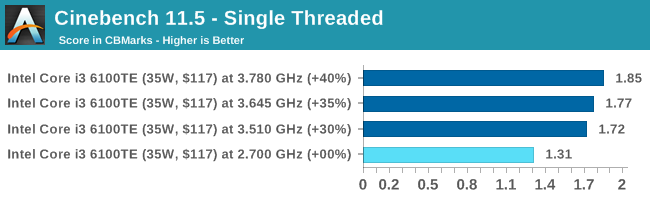

We also had some extra testing on hand. A few benchmarks showed an odd jump between 135 MHz and 140 MHz, such as Agisoft and Cinebench 10 single thread. Dolphin saw some odd regression at 140 MHz, but the general trend still stood.
Testing the Scaling – GTX 980 Gaming
![Grand Theft Auto V on ASUS GTX 980 Strix 4GB ($560) [Under 60 FPS]](https://images.anandtech.com/graphs/graph10127/80757.png)

![GRID: Autosport on ASUS GTX 980 Strix 4GB ($560) [Minimum FPS]](https://images.anandtech.com/graphs/graph10127/80759.png)
![Shadow of Mordor on ASUS GTX 980 Strix 4GB ($560) [Minimum FPS]](https://images.anandtech.com/graphs/graph10127/80763.png)
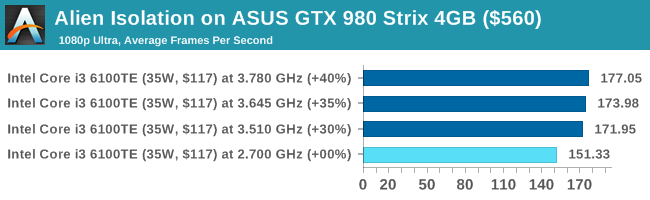
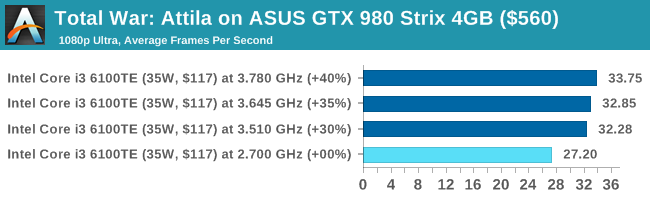
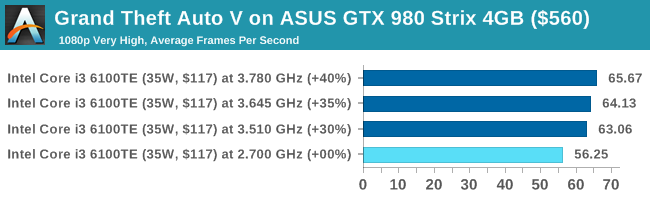
In our gaming tests, every title showed proportional gains such that moving from 130 to 135 MHz did the same increase as moving from 135 to 140 MHz, although in some cases it was really, really minor. The best way to look at it is to plot a graph of frame rate against CPU frequency, and find where the frequency = 0 cuts the line and note the gradient. What matters here is two points. If the intercept (frequency = 0) value is high, then it offers a good performance no matter what. If the gradient is high, then you get a better response per adjustment in frequency.
| Benchmark (1080p Ultra) | Intercept | Gradient |
| Alien Isolation, Average FPS | 86.59 FPS | 24.1 FPS per GHz |
| Total War: Attila, Average FPS | 10.86 FPS | 6.1 FPS per GHz |
| Grand Theft Auto, Average FPS | 33.11 FPS | 8.6 FPS per GHz |
| Grand Theft Auto, % Frames >16.6ms | -20.4% per GHz | |
| GRID, Average FPS | 67.71 FPS | 24.9 FPS per GHz |
| GRID, Minimum FPS | 28.00 FPS | 26.0 FPS per GHz |
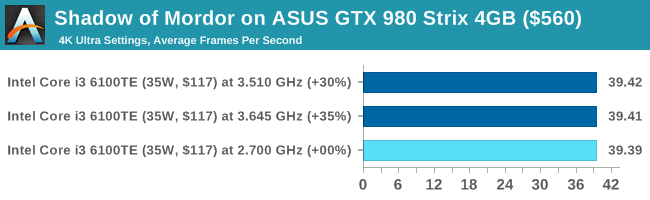
| Shadow of Mordor 4K, Average FPS | 39.31 FPS | 0.3 FPS per GHz |
| Shadow of Mordor 4K, Minimum FPS | 16.18 FPS | 3.2 FPS per GHz |
From these results, essentially everything except Mordor seems to get really nice gains (proportionally) from increasing the frequency.
As an exercise in stupid numbers, here’s a calculation. Using the intercept and gradient, and assuming a perpetual linear relationship, calculate the frequency needed for 60, 120 or 240 FPS average. The results are:
| Benchmark (1080p Ultra) | Frequency Needed for 60 FPS |
Frequency Needed for 120 FPS |
Frequency Needed for 240 FPS |
| Alien Isolation, Average FPS | Always | 1.38 GHz | 6.37 GHz |
| Total War: Attila, Average FPS | 8.06 GHz | Stupid | Even more stupid |
| Grand Theft Auto, Average FPS | 3.13 GHz | 10.10 GHz | Stupid |
| Grand Theft Auto, % Frames >16.6ms |
For all frames below 16.6ms: 5.98 GHz | ||
| GRID, Average FPS | Always | 2.10 GHz | 6.92 GHz |
| GRID, Minimum FPS | 1.23 GHz | 3.54 GHz | 8.15 GHz |
| Shadow of Mordor 4K Average FPS |
69.67 GHz | Stupid | Even more stupid |
| Shadow of Mordor 4K Minimum FPS |
13.69 GHz | Stupid | Even more stupid |
Because of the titles that scale, I’m inclined to believe some of these numbers, such as Alien Isolation and GRID, but Mordor is just amusing as the minimum scales faster than the average in our small test. Give me a ring if we ever hit 70 GHz.
A Word on Power Consumption
It turns out that power consumption numbers becomes a byline in this test. At stock frequencies and at +35% overclock, the power consumption of this 35W part moved from 32W to 38W, which is pretty much what was to be expected.


62 Comments
View All Comments
Y23KC - Tuesday, March 29, 2016 - link
Ah, the fun of overclocking. I used to overclock starting with an AMD Duron 800mhz to 1ghz. Stayed with multiple AMD processors (Thunderbird 1ghz to 1.4ghz, TBird 1.4 to 1.8, 1900+ XP to a real 1.9, etc.) Tried a few coppermine pentiums, but was disappointed. Then I went to the P4 Northwood processors. Favorite of those was a 2.53ghz to 3.06ghz overclock. Also had the 2ghz Celron that was a great overclocker to encode videos. Didn't move past them for a while since AGP switched to PCIE graphics card and ddr2 ram with the Core2Duo. Finally moved to Core2Quad 9400 and it was a dud overclocker. Got rid of it and moved to Mac computers. Kept a few Windows laptops and a HTPC but just recently went back to overclocking with a 4770k. It was also a dud overclocker. Recently I got a 5820k and overclocked to 4.5ghz. Been enjoying the tinkering but honestly beyond benchmarks and video encoding, I can't tell the difference between it and an i3-6100 that I currently use in my HTPC. I also like to tinker with the Hackintosh stuff these days, but Apple keeps screwing around with the imessage protocol that doesn't make it as fun anymore to meBulat Ziganshin - Saturday, May 7, 2016 - link
i wonder who can buy your argument about "half-way to i5". 65W parts like the http://ark.intel.com/products/90731/Intel-Core-i3-... has the same perfromance level out of box