Intel Haswell-EP Xeon 12 Core Review: E5-2650L V3 and E5-2690 V3
by Ian Cutress on November 6, 2014 9:00 AM EST- Posted in
- CPUs
- IT Computing
- Intel
- Xeon
- Enterprise
- LGA2011-3
- Haswell EP
Intel Haswell-EP 12 Cores Conclusion
At the beginning of the review we outlined what seemed like a shift in Intel's binning strategy when it comes to Haswell-EP. Given the lack of competition for in most areas of the server market (there are areas where other cores make more sense) Intel could do one of two things. The first option, stagnation, allows competitors to catch up while at the same time allowing Intel to perhaps improve on designs with little gain and little cost to research and development. Though one issue with stagnation, when you are your only competition, ultimately results in customers not wanting to upgrade and reduces revenue. The other option is diversification, and this is what we think is happening with the wide range of models available with Haswell-EP.
By discussing with their big customers, Intel now has several dozen CPU models for only three general dies. Most of these models are part of a road map and designed to improve yields, while others are for specific customers only or have longer life support. With the die product volume Intel has in its fabs, it has the opportunity to be very aggressive with its binning implementation, resulting in several high core, high frequency or low power models. In previous generations, customers could only pick one of those three, but with Haswell-EP most customers can hone in on at least two preferences.
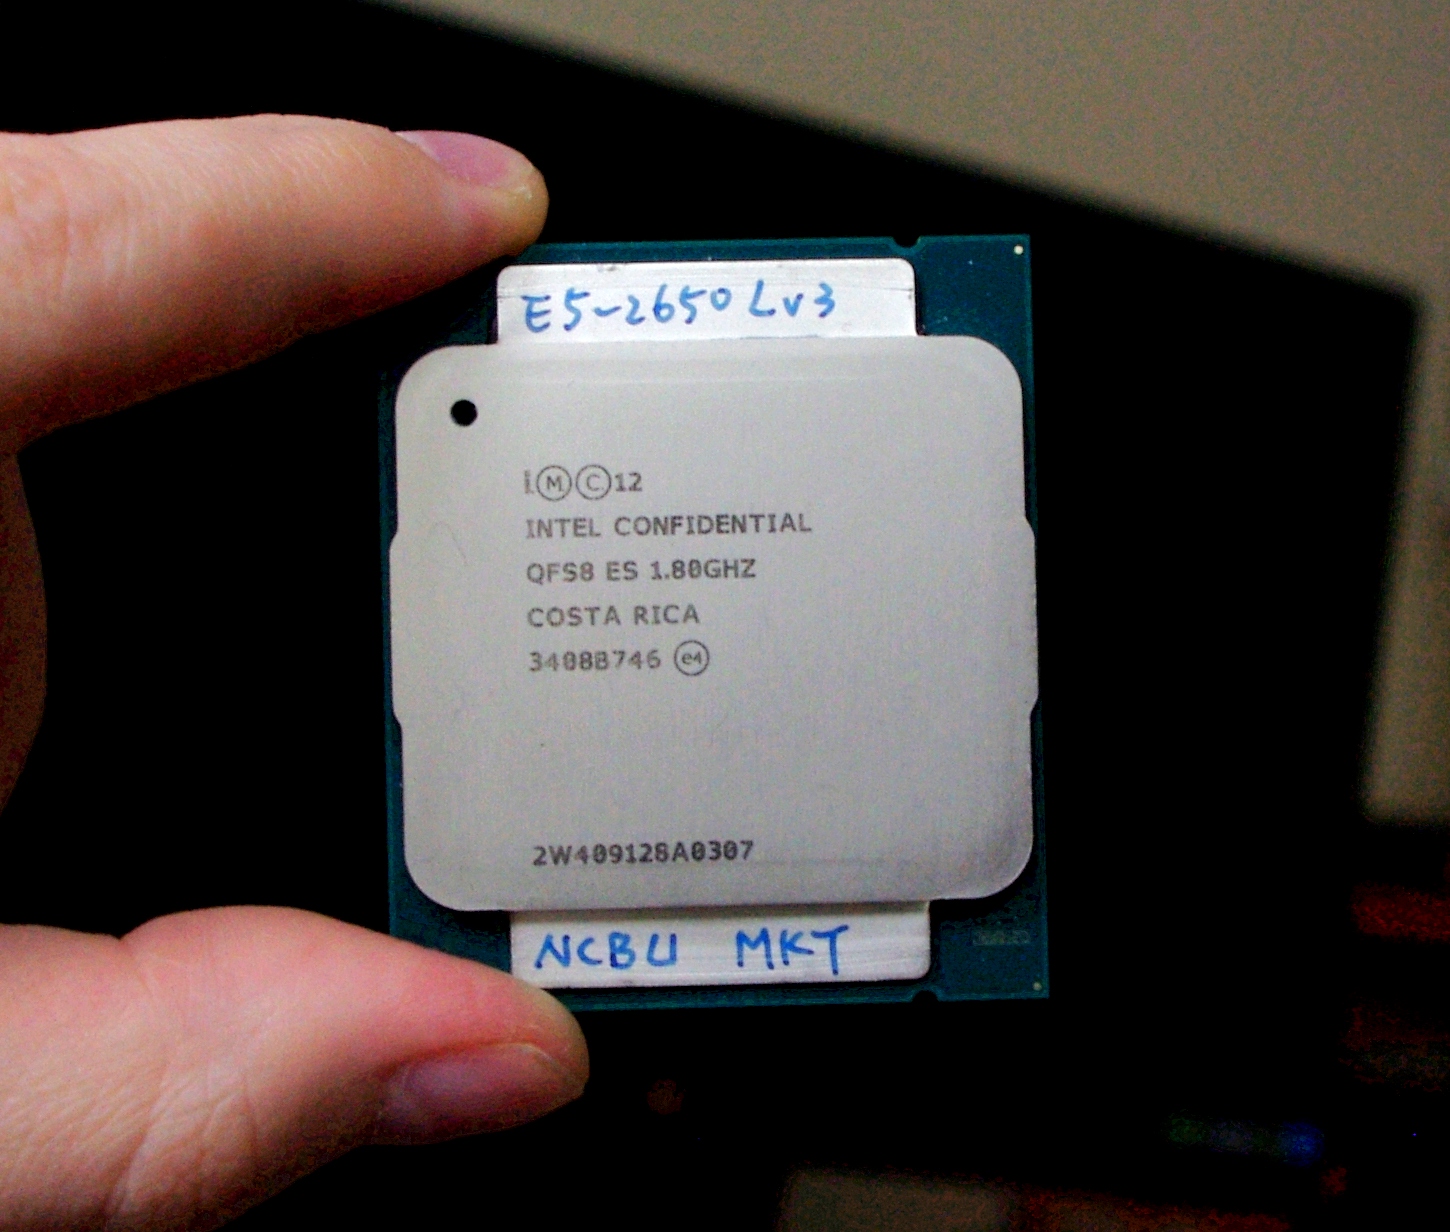
Today we examined two of Intel's 12 core options: the 'typical' stack model in the E5-2690 V3, offering a 2.6 GHz base frequency at 135W for $2090, and the low power optimized E5-2650L V3 which offers a 1.8GHz base frequency, 2.5 GHz turbo, at 65W for $1330.
As expected, the E5-2690 V3 performed better in all of our benchmarks by virtue of the frequency advantage during both single core and multicore operation. In terms of performance for price, or performance per power, the E5-2650L V3 wins out here. At only 65% of the cost, and just under 50% of the power, the cost per computation per watt falls firmly on the side of the E5-2650L V3. Although for compute limited throughout, in absolute terms, the E5-2650L V3 still ends up slower and one of the weakest Xeons we have tested due to the frequency difference. One of the important factors missed by the performance-per-watt analogy is how many units of work, and the cost of that work is, per unit time.
As part of this review we were able to source two E5-2650L V3 CPUs with a dual CPU motherboard and offer a more competitive analysis at 130-135W total TDP against the E5-2690 V3. In these results, anything that was single threaded still fell on the side of the E5-2690 V3 due to its single core frequency advantage. Despite our predictions, relatively few software packages that we came across were won by the dual E5-2650L V3 system, making the E5-2690 V3 the CPU of choice. This was especially true for software that could use multiple cores but could not take advantage of a 2P arrangement. The best example of this is video conversion at low quality which relies on a lot of crosstalk between encoded frames and memory accesses that might not be NUMA aware. The only reason in this regard to choose a 2x E5-2650L V3 over a 1x E5-2690 V3 would be for the double memory support, or for the few benchmarks where the 2P configuration won (Hybrid x265, Cinebench R15). The single CPU option is cheaper, easier to manage and works better across the board.
Our next installment of Haswell-EP coverage involves two 14 core models. The 14 core design is a little odd, being outside of the regular scope normally considered for core counts (12/16) and representing a semi-irregular arrangement of cores. Ultimately it relies on the 18-core die being cut down. As always, our CPU review data from past and present can be found in the CPU section of our results comparison database, Bench.


52 Comments
View All Comments
XZerg - Thursday, November 6, 2014 - link
I really dislike the Power Consumpution Delta chart. Could you please go back to separate Idle chart and Load chart?Mikemk - Thursday, November 6, 2014 - link
+1klagermkii - Thursday, November 6, 2014 - link
I don't understand the purpose of that chart. It leaves too much ambiguity between CPUs that are efficient at load vs CPUs that just have poor idle power management.ziorus - Thursday, November 6, 2014 - link
100% agree with XZerg. I was coming to this site because you had the idle and load charts. Those two infos really are needed. Not this delta chart. We do not even know where power consumption in watts at idle starts to add in the numbers.Guspaz - Thursday, November 6, 2014 - link
Agreed. The delta is basically useless information, because it gives a CPU with a power range of 10W-20W and a CPU with a power range of 100W-110W the same score, and tells us nothing about how much power the part actually draws (so we can't use the info to size PSUs) or how much heat it might produce (so we can't use the info to size cooling).The delta is, without the idle/load, completely meaningless.
Schafdog - Thursday, November 6, 2014 - link
I want to join the club to complain on only one (delta) power measurement. Idle is important. Max is important.MrCommunistGen - Saturday, November 8, 2014 - link
I think that the Delta chart is designed to give an apples to apples comparison of how much power the CPU itself consumes under load. The platforms of all of those systems are vastly different. There's a range of motherboards from single socket consumer IVB to dual socket workstation/server Haswell and everything in between. While a comparison of raw platform power under idle and load certainly bears its own merit and and represents an interesting set of figures, it does not provide a meaningful comparison for the subject of this article - a CPU.Delta power allows for all kinds of comparisons. Regardless of motherboard, RAM, etc you can establish that a given CPU will use (approximately) X number of watts under load. If you then provide performance figures for that load, you can get the compute efficiency of the CPU. In big data clusters, especially ones that primarily perform a specific workload this is an important figure.
0ldman79 - Monday, November 10, 2014 - link
Delta chart is fine. We still want to see idle and max load.Call me old fashioned.
danjw - Thursday, November 6, 2014 - link
First paragraph in "Market" "bandwidth contained applications" should be "bandwidth constrained applications", I think.rocketscience315 - Thursday, November 6, 2014 - link
Um, isn't the Frequency Response graph missing the 2648L?