MSI A88X-G45 Gaming Review
by Ian Cutress on August 11, 2014 8:00 AM ESTMany thanks to...
We must thank the following companies for kindly providing hardware for our test bed:
Thank you to OCZ for providing us with PSUs and SSDs.
Thank you to G.Skill and ADATA for providing us with memory kits.
Thank you to Corsair for providing us with an AX1200i PSU, Corsair H80i CLC and DRAM.
Thank you to ASUS for providing us with the AMD HD7970 GPUs and some IO Testing kit.
Thank you to MSI for providing us with the NVIDIA GTX 770 Lightning GPUs.
Thank you to Rosewill for providing us with PSUs and RK-9100 keyboards.
Thank you to ASRock for providing us with some IO testing kit.
Test Setup
| Test Setup | |
| Processor |
AMD A10-7850K (ES) 2 Modules, 4 Threads |
| Motherboards | MSI A88X-G45 Gaming |
| Cooling |
Corsair H80i Thermalright TRUE Copper |
| Power Supply |
OCZ 1250W Gold ZX Series Corsair AX1200i Platinum PSU |
| Memory | 2x4GB G.Skill DDR3-1866 9-11-11 1.65V |
| Memory Settings | XMP |
| Video Cards | MSI GTX 770 Lightning 2GB (1150/1202 Boost) |
| Video Drivers | NVIDIA Drivers 337 WHQL |
| Hard Drive | OCZ Vertex 3 256GB |
| Optical Drive | LG GH22NS50 |
| Case | Open Test Bed |
| Operating System | Windows 7 64-bit SP1 |
| USB 2/3 Testing | OCZ Vertex 3 240GB with SATA->USB Adaptor |
| WiFi Testing | D-Link DIR-865L 802.11ac Dual Band Router |
System Benchmarks
Power Consumption
Power consumption was tested on the system as a whole with a wall meter connected to the OCZ 1250W power supply, while in a single MSI GTX 770 Lightning GPU configuration. This power supply is Gold rated, and as I am in the UK on a 230-240 V supply, leads to ~75% efficiency > 50W, and 90%+ efficiency at 250W, which is suitable for both idle and multi-GPU loading. This method of power reading allows us to compare the power management of the UEFI and the board to supply components with power under load, and includes typical PSU losses due to efficiency. These are the real world values that consumers may expect from a typical system (minus the monitor) using this motherboard.
While this method for power measurement may not be ideal, and you feel these numbers are not representative due to the high wattage power supply being used (we use the same PSU to remain consistent over a series of reviews, and the fact that some boards on our test bed get tested with three or four high powered GPUs), the important point to take away is the relationship between the numbers. These boards are all under the same conditions, and thus the differences between them should be easy to spot.
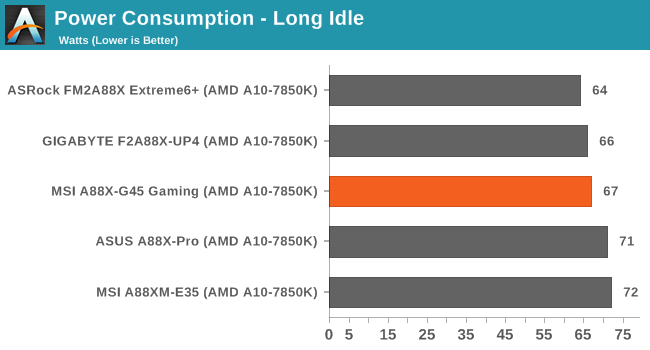
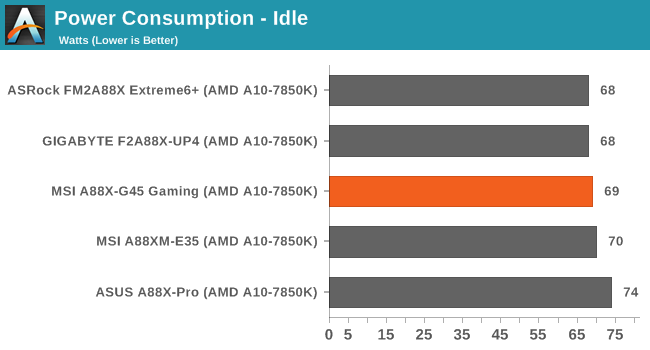
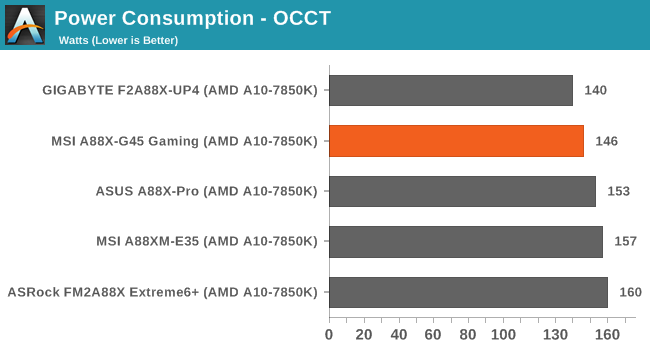
Both long idle and idle power consumption numbers are middle of the stack, but the peak power consumption gets under 150W unlike most of the rest.
Windows 7 POST Time
Different motherboards have different POST sequences before an operating system is initialized. A lot of this is dependent on the board itself, and POST boot time is determined by the controllers on board (and the sequence of how those extras are organized). As part of our testing, we are now going to look at the POST Boot Time - this is the time from pressing the ON button on the computer to when Windows 7 starts loading. (We discount Windows loading as it is highly variable given Windows specific features.) These results are subject to human error, so please allow +/- 1 second in these results.
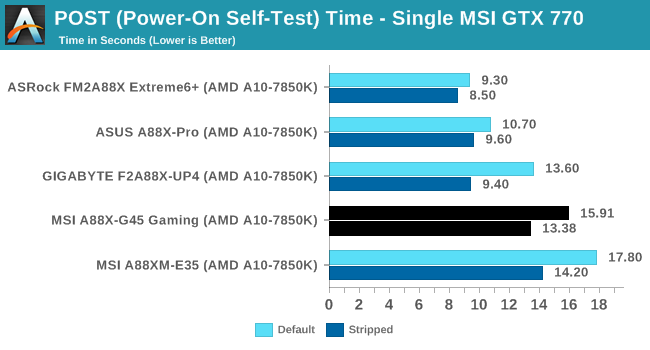
The POST times for the motherboard were not that exciting, showing that manufacturers are perhaps focusing more on their Windows 8 booting times instead.
Rightmark Audio Analyzer 6.2.5
The premise behind Rightmark:AA is to test the input and output of the audio system to determine noise levels, range, harmonic distortion, stereo crosstalk and so forth. Rightmark:AA should indicate how well the sound system is built and isolated from electrical interference (either internally or externally). For this test we connect the Line Out to the Line In using a short six inch 3.5mm to 3.5mm high-quality jack, turn the OS speaker volume to 100%, and run the Rightmark default test suite at 192 kHz, 24-bit. The OS is tuned to 192 kHz/24-bit input and output, and the Line-In volume is adjusted until we have the best RMAA value in the mini-pretest. We look specifically at the Dynamic Range of the audio codec used on board, as well as the Total Harmonic Distortion + Noise.
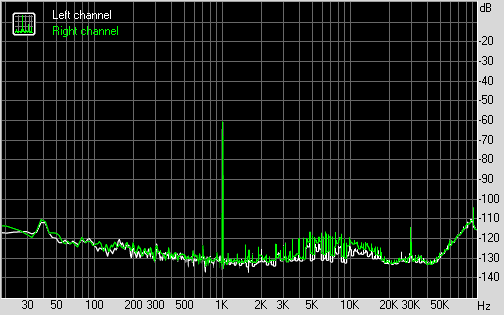
Dynamic Range for A88X-G45 Gaming
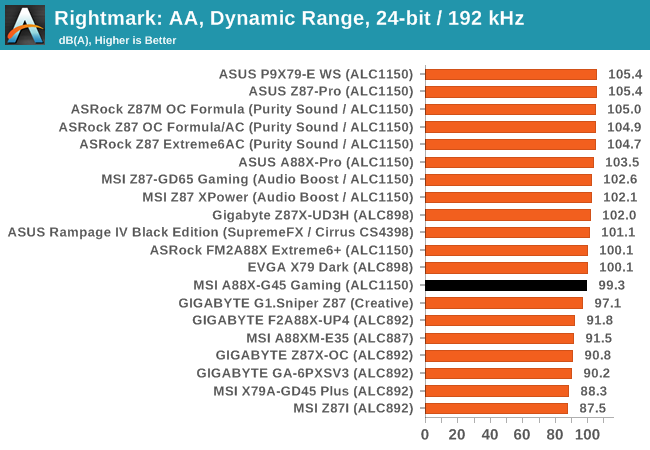
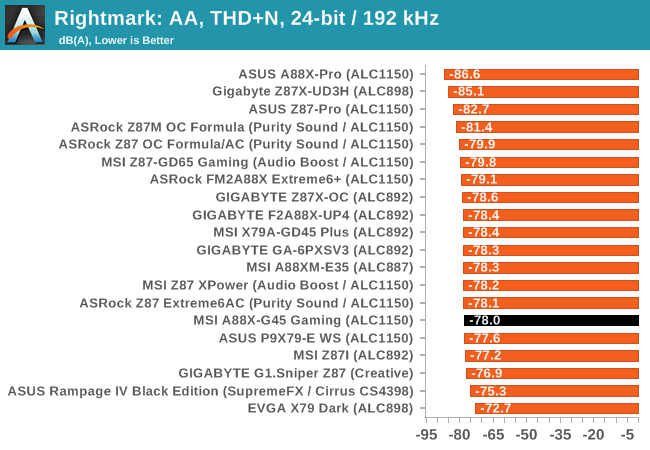
For an enhanced Realtek ALC1150 audio solution, the results from the motherboard were lower than expected. The dynamic range is our first ALC1150 under 100 dBA, and the THD+N has nothing on the A88X-Pro.
USB Backup
For this benchmark we transfer a set size of files from the SSD to the USB drive using DiskBench, which monitors the time taken to transfer. The files transferred are a 1.52 GB set of 2867 files across 320 folders – 95% of these files are small typical website files, and the rest (90% of the size) are the videos used in the WinRAR test. In an update to pre-Z87 testing, we also run MaxCPU to load up one of the threads during the test which improves general performance up to 15% by causing all the internal pathways to run at full speed.
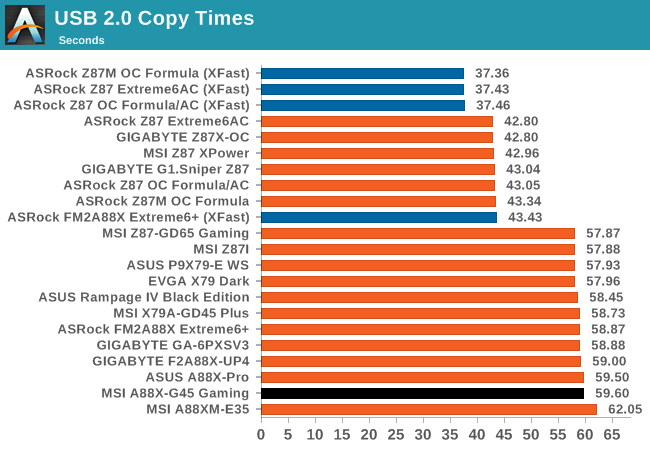
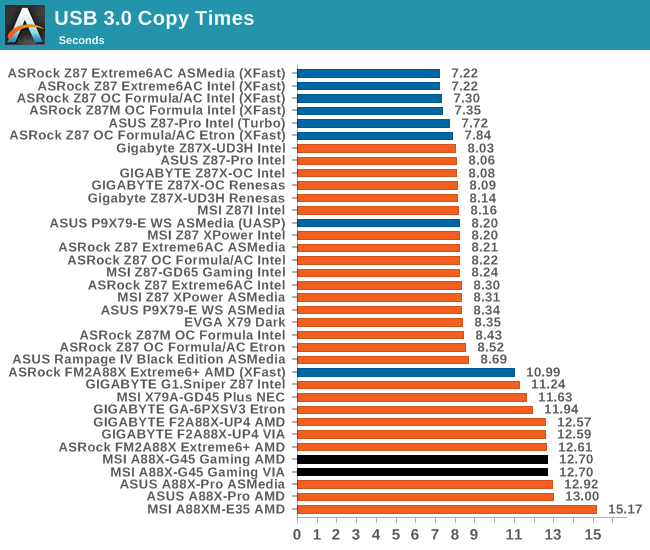
USB speeds were middle of the road, although it is interesting that at the bottom of the USB 2.0 list are two MSI motherboards. That being said the chipset and VIA USB 3.0 ports are both better than some of the competition.


12 Comments
View All Comments
purplestater - Monday, August 11, 2014 - link
This really makes me want to build another computer that I don't need and can't afford.PHlipMoD3 - Monday, August 11, 2014 - link
So, the A10 7850K beats an i7 4960X in 2 gaming benchmarks, and not a word is said about that in the article apart from "The MSI motehrboard takes the lead in CoH2 comfortably."Seems fishy to me, same card, more CPU bottleneck on the A10, and yet it beats a 4960X in gaming? Shenanigans.
tim851 - Monday, August 11, 2014 - link
The games in which the A10 comes out on top are not CPU bottlenecked, but clearly limited by GPU performance. A victory there is likely a statistical fluke.PHlipMoD3 - Monday, August 11, 2014 - link
I still find it quite a weird victory, even taking into account the GPU-limited state of BF4. CoH is also a CPU heavy title, and AMD seems to do well in it more often. I would like to have seen a comparison between the 9590 and the A10 in this case, instead of the more limited benches and comparisons in this article / review.I know its a motherboard review specifically, but more comparison points can't hurt.
Ian Cutress - Monday, August 11, 2014 - link
I just removed my CoH2 results: with it being on steam and requiring an online connection to initialise first on a new system, it of course downloads updates. It would seem CoH2 had a large update that I didn't see download which has affected the frame rates quite considerably: up to 15% with an A10. I am seeing this with the motherboards I have on the test bed, and is essentially nullifying all my previous results compared to the latest.DrMrLordX - Tuesday, August 12, 2014 - link
Is the latest CoH2 update showing any speed improvements on the 4960x or other Intel processors? I understand if the new software version skews current results to the point that they are no longer comparable to older benchmark runs, but at the same time, this sort of stinks for the 7850k. AMD won a benchmark? Pull it, it has to be a fluke!If the 4960x gained nothing from the update, then, guess what: the 7850k is actually the faster chip for CoH2.
Anonymous Blowhard - Monday, August 11, 2014 - link
> why would a user purchase such an APU and then disable access by adding a discrete GPU?Because they're a complete pillock.
Now, if someone were to purchase a cheap-as-chips FM2 Athlon X4 750K, OC the living daylights out of it, and pair that with a dGPU ... well, then they'd be a savvy budget gamer, now wouldn't they?
iTzSnypah - Monday, August 11, 2014 - link
Well if AMD releases a Kaveri based Athlon X4 then maybe. Currently a G3458+H81 board is cheaper and blows a 750K/760K out of the water gaming, especially once you overclock the Pentium.StrangerGuy - Thursday, August 14, 2014 - link
Exactly, who in the right mind would buy this $120 mobo given the Pentium AE and a H81 board is the same price? By the time you put a FM2 CPU/APU into that thing you could have well easily got a discrete card for budget gaming purposes. Of course they will be AMD tryhards deriding the AE being "loldualcore" while conveniently ignoring being massively GPU limited with AMD CPU is a universally FAR worse experience.Phartindust - Thursday, August 14, 2014 - link
Wrong question. The right question is why would anybody purchase an APU and NOT crossfire it with an appropriate AMD GPU? Putting a Nvidia gpu with an AMD APU makes no sense at all