Intel Z87 Motherboard Review with Haswell: Gigabyte, MSI, ASRock and ASUS
by Ian Cutress on June 27, 2013 8:00 AM EST- Posted in
- Motherboards
- Intel
- MSI
- Gigabyte
- ASRock
- Asus
- Haswell
- Z87
- Shark Bay
- Lynx Point
Metro2033
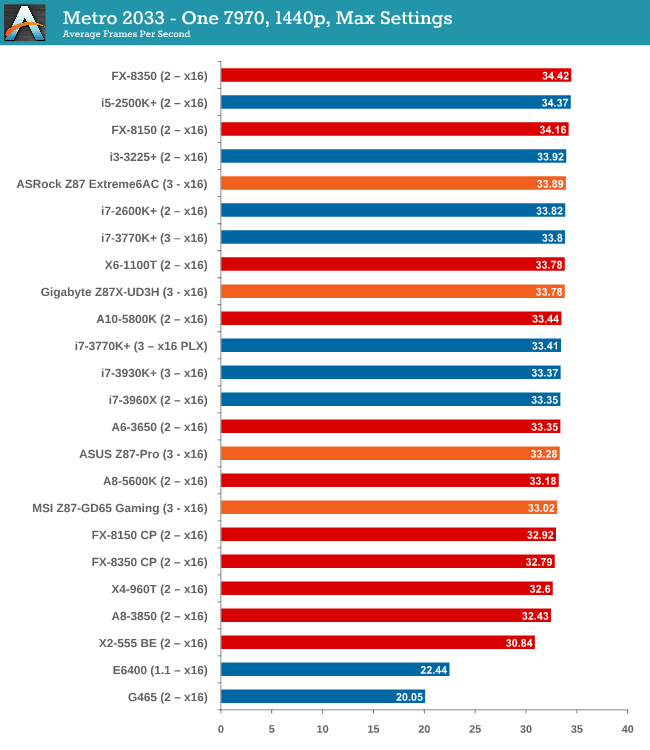
Our first analysis is with the perennial reviewers’ favorite, Metro2033. It occurs in a lot of reviews for a couple of reasons – it has a very easy to use benchmark GUI that anyone can use, and it is often very GPU limited, at least in single GPU mode. Metro2033 is a strenuous DX11 benchmark that can challenge most systems that try to run it at any high-end settings. Developed by 4A Games and released in March 2010, we use the inbuilt DirectX 11 Frontline benchmark to test the hardware at 1440p with full graphical settings. Results are given as the average frame rate from a second batch of 4 runs, as Metro has a tendency to inflate the scores for the first batch by up to 5%.
| Metro 2033 | 1 GPU | 2 GPU | 3 GPU |
| AMD | |||
| NVIDIA |
In our 3-way AMD test, it is clear that when the x1 mode is selected on the ASUS Z87-Pro, performance scaling goes out the window. For Metro there is a slight advantage having x8/x4/x4 over x8/x8 + x4.
Dirt 3
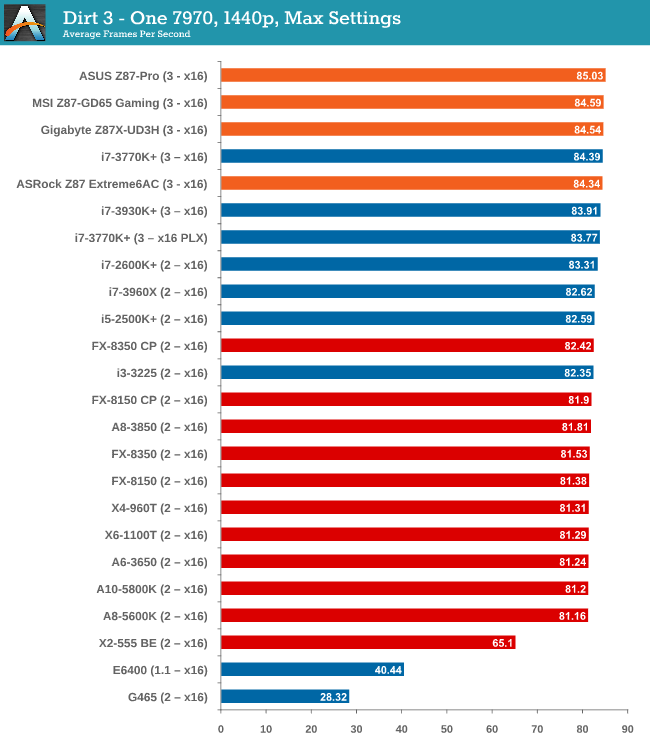
Dirt 3 is a rallying video game and the third in the Dirt series of the Colin McRae Rally series, developed and published by Codemasters. Dirt 3 also falls under the list of ‘games with a handy benchmark mode’. In previous testing, Dirt 3 has always seemed to love cores, memory, GPUs, PCIe lane bandwidth, everything. The small issue with Dirt 3 is that depending on the benchmark mode tested, the benchmark launcher is not indicative of game play per se, citing numbers higher than actually observed. Despite this, the benchmark mode also includes an element of uncertainty, by actually driving a race, rather than a predetermined sequence of events such as Metro 2033. This in essence should make the benchmark more variable, but we take repeated in order to smooth this out. Using the benchmark mode, Dirt 3 is run at 1440p with Ultra graphical settings. Results are reported as the average frame rate across four runs.
| Dirt 3 | 1 GPU | 2 GPU | 3 GPU |
| AMD | |||
| NVIDIA |
If I was a Dirt gamer, clearly having the most PCIe lanes supplied by the CPU is going to win out the day, putting the MSI and ASRock ahead of the others.
Civilization V
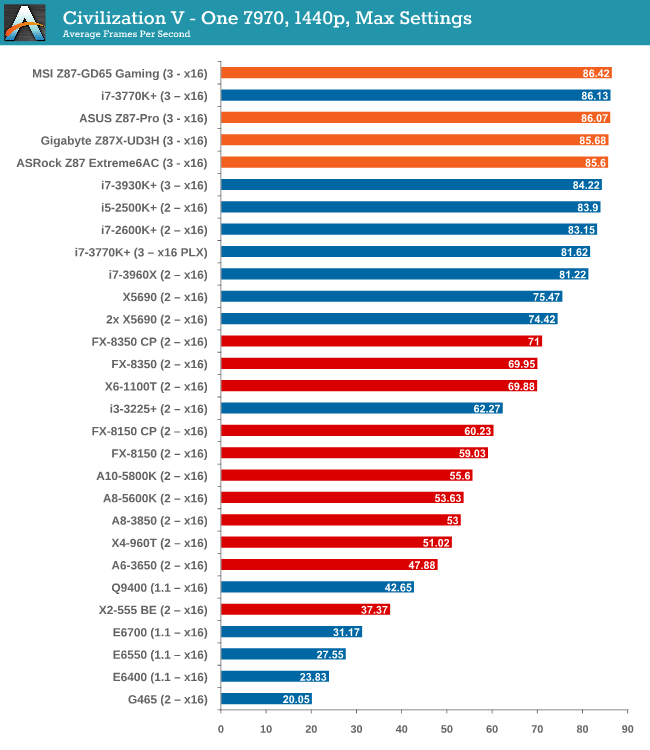
A game that has plagued my testing over the past twelve months is Civilization V. Being on the older 12.3 Catalyst drivers were somewhat of a nightmare, giving no scaling, and as a result I dropped it from my test suite after only a couple of reviews. With the later drivers used for this review, the situation has improved but only slightly, as you will see below. Civilization V seems to run into a scaling bottleneck very early on, and any additional GPU allocation only causes worse performance.
Our Civilization V testing uses Ryan’s GPU benchmark test all wrapped up in a neat batch file. We report the average frame rate of a 5 minute test.
| Civilization V | 1 GPU | 2 GPU | 3 GPU |
| AMD | |||
| NVIDIA |
For whatever reason the ASRock motherboard is not too fond of Civilization V, taking a hit on dual AMD and also dual NVIDIA.
Sleeping Dogs
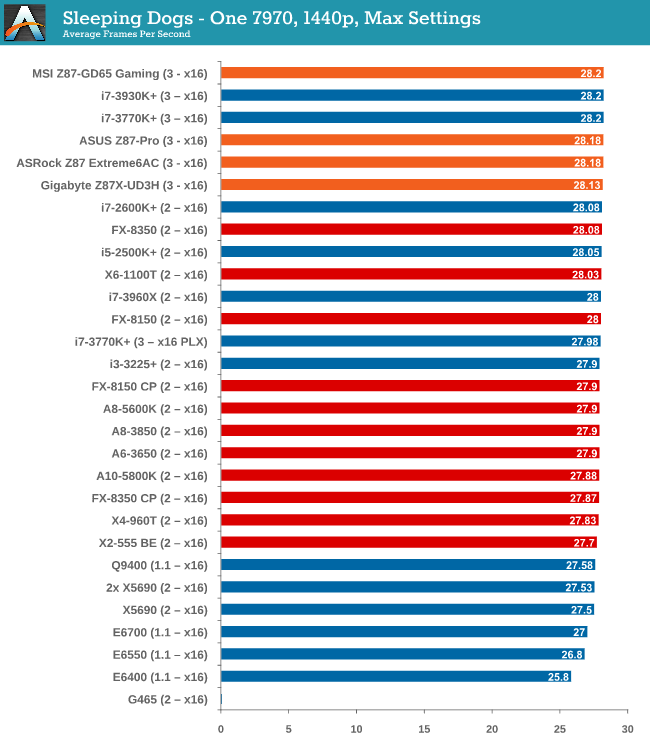
While not necessarily a game on everybody’s lips, Sleeping Dogs is a strenuous game with a pretty hardcore benchmark that scales well with additional GPU power due to its SSAA implementation. The team over at Adrenaline.com.br is supreme for making an easy to use benchmark GUI, allowing a numpty like me to charge ahead with a set of four 1440p runs with maximum graphical settings.
| Sleeping Dogs | 1 GPU | 2 GPU | 3 GPU |
| AMD | |||
| NVIDIA |
Sleeping Dogs is very much static between motherboards and CPUs, except at three-way AMD where the difference between a third slot at x4 or x1 is around 12.5%.


58 Comments
View All Comments
ShieTar - Thursday, June 27, 2013 - link
Is there a special reason not to test the POST times and DPC latency of the Gigabyte Board? Its power consumption is quiet impressive, and whatever design measures have been used to achieve it do not seem to negatively affect the overall performance. So it would be interesting to complete the picture with the two measurements which are missing.IanCutress - Thursday, June 27, 2013 - link
DPC Latency on the Gigabyte during testing was jumping around a fair bit, hitting 800+, though that is more likely due to the early BIOS revision. I need to run the POST test (as the results are strangely missing from my database) as well as the DPC test on a newer BIOS. Since I started testing almost every manufacturer has released newer BIOSes (as is always the way coming up to a launch) and I really have to lay the hammer down as testing a whole new BIOS takes a good 30 hours or so start to finish, so when I'm locked in that's it. That in a way does give an unfair advantage to the board I test last, but there's not a lot else I can do. I am still getting emails of BIOS updates for these boards as of yesterday.Ian
tribbles - Thursday, June 27, 2013 - link
Am I wrong in thinking that Gigabyte hasn't been doing well in the DPC Latency Test since Z77? If so, that's kind of surprising, since Gigabyte seems to be a "go-to" brand for digital audio workstation builders.IanCutress - Wednesday, July 10, 2013 - link
I retested the UD3H on the F5 (public) BIOS, and it scored 164. The two next boards I have in for review got 160 and 157, which points fingers to the DPC on Haswell being 150+ regardless of motherboard. This might be a fundamental issue.Timur Born - Saturday, July 27, 2013 - link
Run Prime95 (or turn off CPU power features) while measuring DPC latencies to see how much CPU power saving features affect DPCs.jhonabundance - Thursday, August 28, 2014 - link
great share http://asus.comjhonabundance - Thursday, August 28, 2014 - link
this is the best share http://asus.comRick83 - Thursday, June 27, 2013 - link
Maybe a bad choice to use two different ways of graphing the Rightmark results.Being consistent with regard to cutting off the irrelevant bit of the graph makes it a much easier read.
Now it appears at first glance as though the Gigabyte board is much better in THD+N, simply because the differences were so minuscule in the dynamic range bit.
On another note: Shouldn't it be more interesting to use a standardized input instead of the input of the board? In the current protocol a good output could be handicapped by a bad input, and conversely. For most users the output is much more important than the input, so it might be better to test it independently? I would recommend using a USB soundcard as an easy means of doing this test on the same machine, without changing the setup protocol too much.
And finally - I seem to remember Rightmark results for earlier reviews - it would be interesting to have those (or maybe a reference soundcard?) as comparison in the same graph. After all, for DPC you maintain a large cross-platform table as well.
Nice thorough initial review, those nitpicks withstanding.
IanCutress - Thursday, June 27, 2013 - link
Unfortunately I can't adjust the engine to represent from 0 for negative values, I don't have access to the low level options. I forwarded it on as an issue.I'd love to use a standardized input with RMAA. I guess it would be good to get a sound card with an input that supercedes the output of the motherboard and put it through that way, and hopefully there won't be a driver conflict along the line. I'll see what I can do to get in the hardware for that, although many soundcards are designed more for output and the input dynamic range/distortion might be the limiting factor as is the case on motherboards. Something like the Xonar Essence STX has a 118 dBA input with -113 dBA THD+N which might be a good starting point.
Our RMAA testing for Z87 has changed a little from Z77 to make it more of an efficiency test rather than an out-the-box test as audio is such a varied playing field. RMAA is very sensitive to certain windows settings and volumes for example such that with the right combination it was very easy to show A>B or B>A depending on how the OS felt it should be set up. The new testing regimen for RMAA should iron out those issues but the results are not exactly comparable to Z77 for that reason. There are so many wrong ways to set up RMAA it can be difficult (and a learning experience) to get it right.
Ian
popej - Thursday, June 27, 2013 - link
Nice to see you are planning steps in right direction. Using reference card for measurements is a proper solution. Be aware, that separate card add complications to the test, for example you will have to take care about ground loops and signal level matching. Professional card with balanced input could help a lot.