Intel Z87 Motherboard Review with Haswell: Gigabyte, MSI, ASRock and ASUS
by Ian Cutress on June 27, 2013 8:00 AM EST- Posted in
- Motherboards
- Intel
- MSI
- Gigabyte
- ASRock
- Asus
- Haswell
- Z87
- Shark Bay
- Lynx Point
Readers of our motherboard review section will have noted the trend in modern motherboards to implement a form of MultiCore Enhancement / Acceleration / Turbo (read our report here) on their motherboards. This does several things – better benchmark results at stock settings (not entirely needed if overclocking is an end-user goal), at the expense of heat and temperature, but also gives in essence an automatic overclock which may be against what the user wants. Our testing methodology is ‘out-of-the-box’, with the latest public BIOS installed and XMP enabled, and thus subject to the whims of this feature. It is ultimately up to the motherboard manufacturer to take this risk – and manufacturers taking risks in the setup is something they do on every product (think C-state settings, USB priority, DPC Latency / monitoring priority, memory subtimings at JEDEC). Processor speed change is part of that risk which is clearly visible, and ultimately if no overclocking is planned, some motherboards will affect how fast that shiny new processor goes and can be an important factor in the purchase.
For our test today, all motherboards tested used a form of MultiCore Turbo. ASUS motherboards will be shipped without this feature enabled by default; however 3xxx BIOSes will be available to download with it enabled. As per our testing policy of using the latest publicly available BIOS when testing begins, the 3xxx was used.
Point Calculations - 3D Movement Algorithm Test
The algorithms in 3DPM employ both uniform random number generation or normal distribution random number generation, and vary in various amounts of trigonometric operations, conditional statements, generation and rejection, fused operations, etc. The benchmark runs through six algorithms for a specified number of particles and steps, and calculates the speed of each algorithm, then sums them all for a final score. This is an example of a real world situation that a computational scientist may find themselves in, rather than a pure synthetic benchmark. The benchmark is also parallel between particles simulated, and we test the single thread performance as well as the multi-threaded performance.
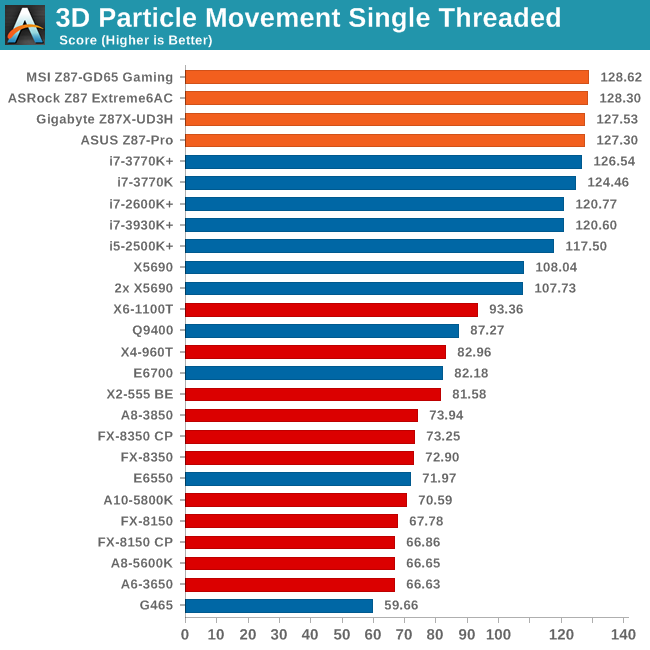
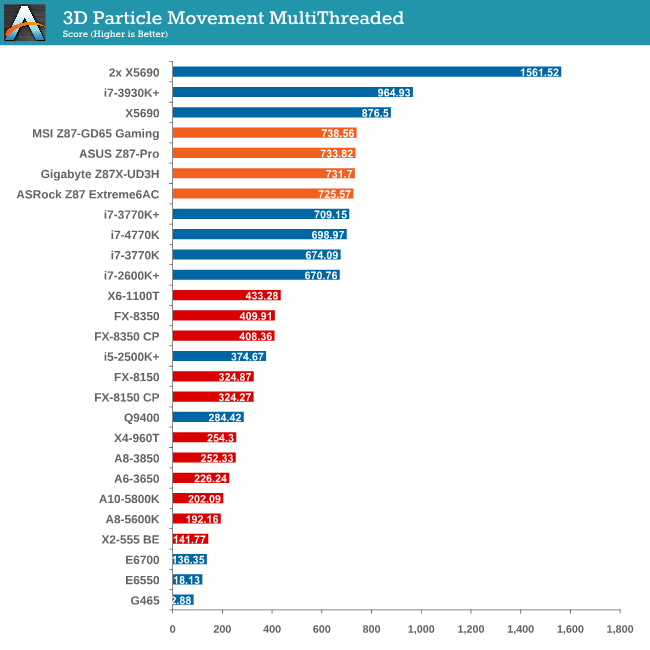
In our 3DPM test the MSI motherboard does rather well in both ST and MT, indicating a good efficiency of MultiCore Turbo.
Compression - WinRAR 4.2
With 64-bit WinRAR, we compress the set of files used in the USB speed tests. WinRAR x64 3.93 attempts to use multithreading when possible, and provides as a good test for when a system has variable threaded load. WinRAR 4.2 does this a lot better! If a system has multiple speeds to invoke at different loading, the switching between those speeds will determine how well the system will do.
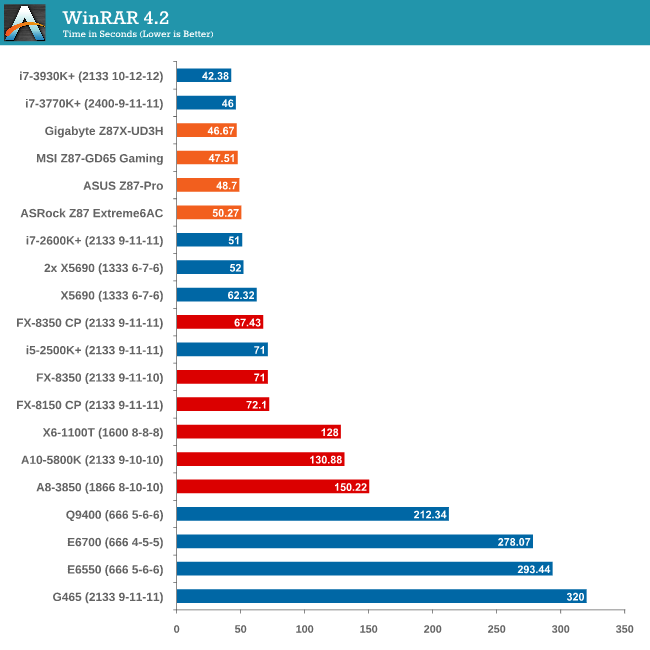
A difference of four seconds in a 50 second benchmark is actually around 8%, which is a surprising gap between the Z87 motherboards.
Image Manipulation - FastStone Image Viewer 4.2
FastStone Image Viewer is a free piece of software I have been using for quite a few years now. It allows quick viewing of flat images, as well as resizing, changing color depth, adding simple text or simple filters. It also has a bulk image conversion tool, which we use here. The software currently operates only in single-thread mode, which should change in later versions of the software. For this test, we convert a series of 170 files, of various resolutions, dimensions and types (of a total size of 163MB), all to the .gif format of 640x480 dimensions.
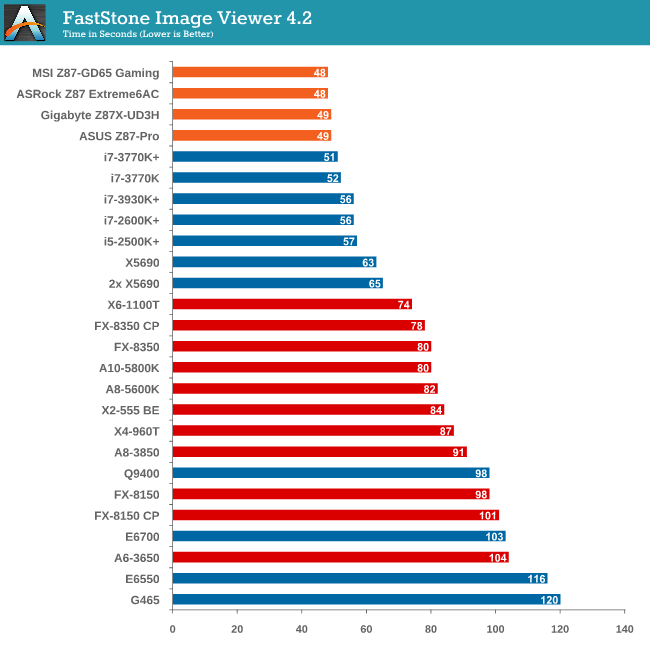
IPC wins for FastStone, hence Haswell is top of the pile.
Video Conversion - Xilisoft Video Converter 7
With XVC, users can convert any type of normal video to any compatible format for smartphones, tablets and other devices. By default, it uses all available threads on the system, and in the presence of appropriate graphics cards, can utilize CUDA for NVIDIA GPUs as well as AMD WinAPP for AMD GPUs. For this test, we use a set of 33 HD videos, each lasting 30 seconds, and convert them from 1080p to an iPod H.264 video format using just the CPU. The time taken to convert these videos gives us our result.
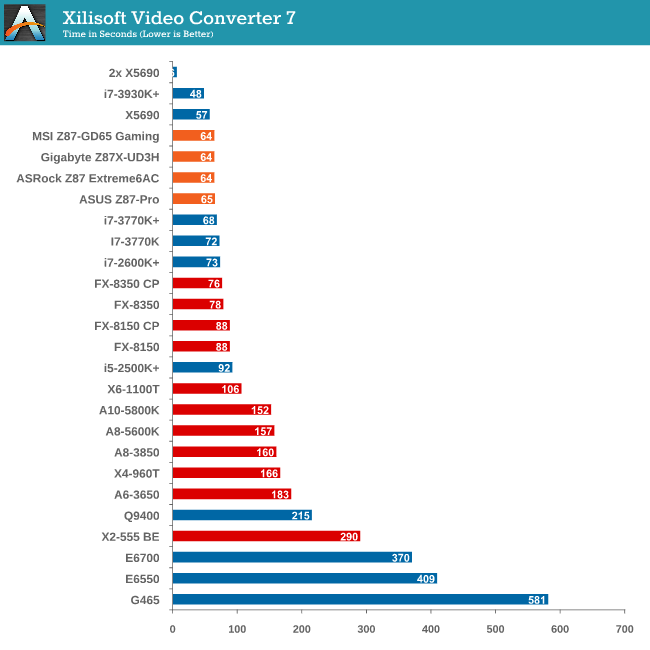 Nothing to split the CPUs here – clearly XVC is a benchmark that loves cores and MHz.
Rendering – PovRay 3.7
The Persistence of Vision RayTracer, or PovRay, is a freeware package for as the name suggests, ray tracing. It is a pure renderer, rather than modeling software, but the latest beta version contains a handy benchmark for stressing all processing threads on a platform. We have been using this test in motherboard reviews to test memory stability at various CPU speeds to good effect – if it passes the test, the IMC in the CPU is stable for a given CPU speed. As a CPU test, it runs for approximately 2-3 minutes on high end platforms.
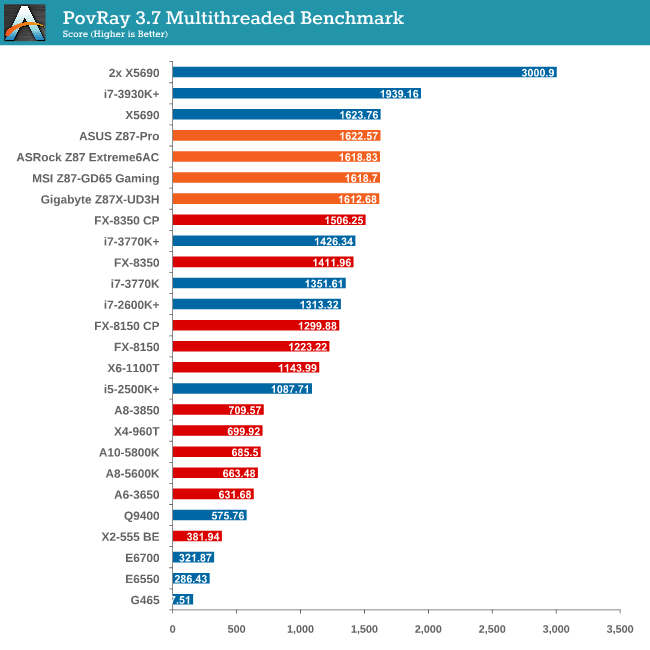
Interestingly enough is the gap between an i7-3770K and the motherboards in our tests – a 13.7% increase of Haswell over Ivy Bridge.
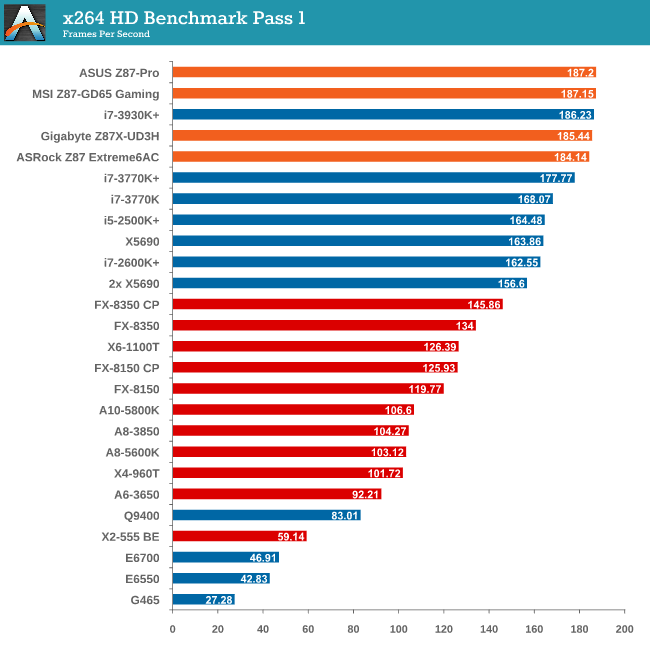
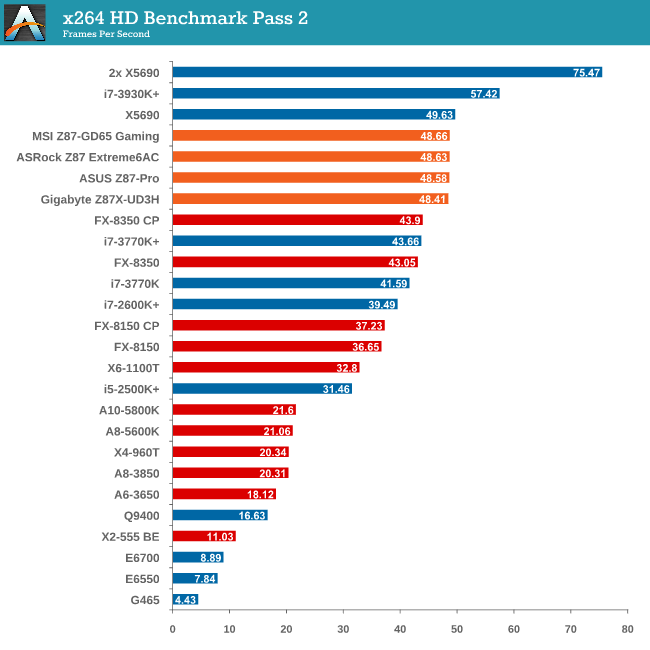
Video Conversion - x264 HD Benchmark
The x264 HD Benchmark uses a common HD encoding tool to process an HD MPEG2 source at 1280x720 at 3963 Kbps. This test represents a standardized result which can be compared across other reviews, and is dependent on both CPU power and memory speed. The benchmark performs a 2-pass encode, and the results shown are the average of each pass performed four times.
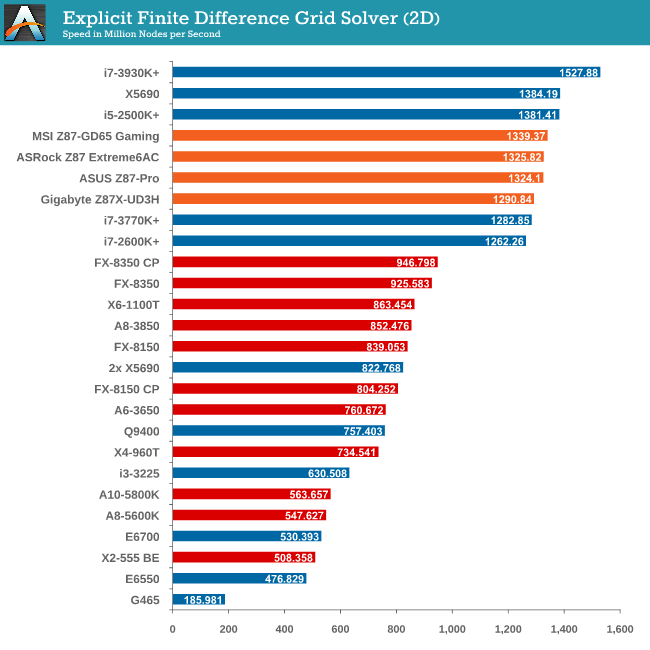
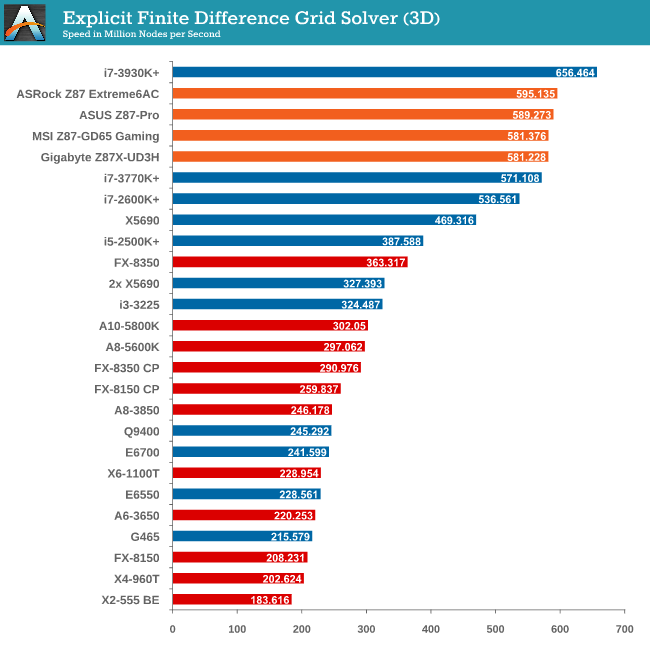
Grid Solvers - Explicit Finite Difference
For any grid of regular nodes, the simplest way to calculate the next time step is to use the values of those around it. This makes for easy mathematics and parallel simulation, as each node calculated is only dependent on the previous time step, not the nodes around it on the current calculated time step. By choosing a regular grid, we reduce the levels of memory access required for irregular grids. We test both 2D and 3D explicit finite difference simulations with 2n nodes in each dimension, using OpenMP as the threading operator in single precision. The grid is isotropic and the boundary conditions are sinks. Values are floating point, with memory cache sizes and speeds playing a part in the overall score.
 Grid Solvers - Implicit Finite Difference + Alternating Direction Implicit Method
The implicit method takes a different approach to the explicit method – instead of considering one unknown in the new time step to be calculated from known elements in the previous time step, we consider that an old point can influence several new points by way of simultaneous equations. This adds to the complexity of the simulation – the grid of nodes is solved as a series of rows and columns rather than points, reducing the parallel nature of the simulation by a dimension and drastically increasing the memory requirements of each thread. The upside, as noted above, is the less stringent stability rules related to time steps and grid spacing. For this we simulate a 2D grid of 2n nodes in each dimension, using OpenMP in single precision. Again our grid is isotropic with the boundaries acting as sinks. Values are floating point, with memory cache sizes and speeds playing a part in the overall score.
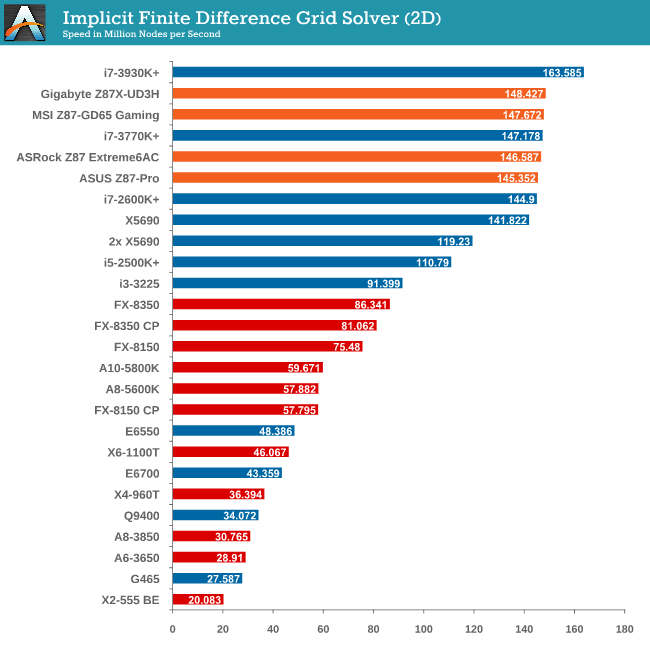
As our grid solvers actually thrash the caches of the CPUs we test, I can’t wait to get a Crystalwell in to review.
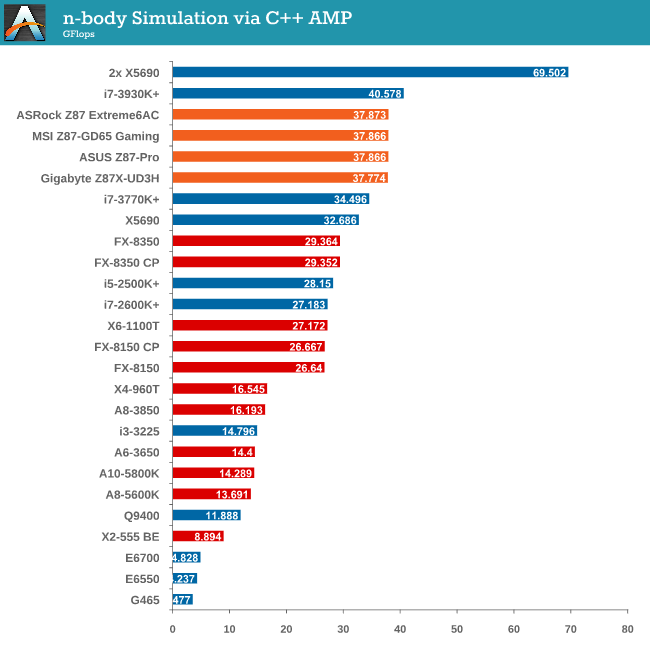
Point Calculations - n-Body Simulation
When a series of heavy mass elements are in space, they interact with each other through the force of gravity. Thus when a star cluster forms, the interaction of every large mass with every other large mass defines the speed at which these elements approach each other. When dealing with millions and billions of stars on such a large scale, the movement of each of these stars can be simulated through the physical theorems that describe the interactions. The benchmark detects whether the processor is SSE2 or SSE4 capable, and implements the relative code. We run a simulation of 10240 particles of equal mass - the output for this code is in terms of GFLOPs, and the result recorded was the peak GFLOPs value.


58 Comments
View All Comments
ShieTar - Thursday, June 27, 2013 - link
Is there a special reason not to test the POST times and DPC latency of the Gigabyte Board? Its power consumption is quiet impressive, and whatever design measures have been used to achieve it do not seem to negatively affect the overall performance. So it would be interesting to complete the picture with the two measurements which are missing.IanCutress - Thursday, June 27, 2013 - link
DPC Latency on the Gigabyte during testing was jumping around a fair bit, hitting 800+, though that is more likely due to the early BIOS revision. I need to run the POST test (as the results are strangely missing from my database) as well as the DPC test on a newer BIOS. Since I started testing almost every manufacturer has released newer BIOSes (as is always the way coming up to a launch) and I really have to lay the hammer down as testing a whole new BIOS takes a good 30 hours or so start to finish, so when I'm locked in that's it. That in a way does give an unfair advantage to the board I test last, but there's not a lot else I can do. I am still getting emails of BIOS updates for these boards as of yesterday.Ian
tribbles - Thursday, June 27, 2013 - link
Am I wrong in thinking that Gigabyte hasn't been doing well in the DPC Latency Test since Z77? If so, that's kind of surprising, since Gigabyte seems to be a "go-to" brand for digital audio workstation builders.IanCutress - Wednesday, July 10, 2013 - link
I retested the UD3H on the F5 (public) BIOS, and it scored 164. The two next boards I have in for review got 160 and 157, which points fingers to the DPC on Haswell being 150+ regardless of motherboard. This might be a fundamental issue.Timur Born - Saturday, July 27, 2013 - link
Run Prime95 (or turn off CPU power features) while measuring DPC latencies to see how much CPU power saving features affect DPCs.jhonabundance - Thursday, August 28, 2014 - link
great share http://asus.comjhonabundance - Thursday, August 28, 2014 - link
this is the best share http://asus.comRick83 - Thursday, June 27, 2013 - link
Maybe a bad choice to use two different ways of graphing the Rightmark results.Being consistent with regard to cutting off the irrelevant bit of the graph makes it a much easier read.
Now it appears at first glance as though the Gigabyte board is much better in THD+N, simply because the differences were so minuscule in the dynamic range bit.
On another note: Shouldn't it be more interesting to use a standardized input instead of the input of the board? In the current protocol a good output could be handicapped by a bad input, and conversely. For most users the output is much more important than the input, so it might be better to test it independently? I would recommend using a USB soundcard as an easy means of doing this test on the same machine, without changing the setup protocol too much.
And finally - I seem to remember Rightmark results for earlier reviews - it would be interesting to have those (or maybe a reference soundcard?) as comparison in the same graph. After all, for DPC you maintain a large cross-platform table as well.
Nice thorough initial review, those nitpicks withstanding.
IanCutress - Thursday, June 27, 2013 - link
Unfortunately I can't adjust the engine to represent from 0 for negative values, I don't have access to the low level options. I forwarded it on as an issue.I'd love to use a standardized input with RMAA. I guess it would be good to get a sound card with an input that supercedes the output of the motherboard and put it through that way, and hopefully there won't be a driver conflict along the line. I'll see what I can do to get in the hardware for that, although many soundcards are designed more for output and the input dynamic range/distortion might be the limiting factor as is the case on motherboards. Something like the Xonar Essence STX has a 118 dBA input with -113 dBA THD+N which might be a good starting point.
Our RMAA testing for Z87 has changed a little from Z77 to make it more of an efficiency test rather than an out-the-box test as audio is such a varied playing field. RMAA is very sensitive to certain windows settings and volumes for example such that with the right combination it was very easy to show A>B or B>A depending on how the OS felt it should be set up. The new testing regimen for RMAA should iron out those issues but the results are not exactly comparable to Z77 for that reason. There are so many wrong ways to set up RMAA it can be difficult (and a learning experience) to get it right.
Ian
popej - Thursday, June 27, 2013 - link
Nice to see you are planning steps in right direction. Using reference card for measurements is a proper solution. Be aware, that separate card add complications to the test, for example you will have to take care about ground loops and signal level matching. Professional card with balanced input could help a lot.