Intel Z87 Motherboard Review with Haswell: Gigabyte, MSI, ASRock and ASUS
by Ian Cutress on June 27, 2013 8:00 AM EST- Posted in
- Motherboards
- Intel
- MSI
- Gigabyte
- ASRock
- Asus
- Haswell
- Z87
- Shark Bay
- Lynx Point
ASRock Z87 Extreme6/AC In The Box
As we are moving up into the $220 bracket with the Z87 Extreme6/AC, the package as a whole has to be a step above that of the $170 models. Not only in features, this means the box as well. For the ASRock motherboard, we get the following:
Driver CD
User Guide
Rear IO Panel
Front USB 3.0 Panel with SSD Holder
Rear Bracket for USB 3.0 Panel
802.11ac WiFi Antenna
Six SATA Cables
Rigid SLI Bridge
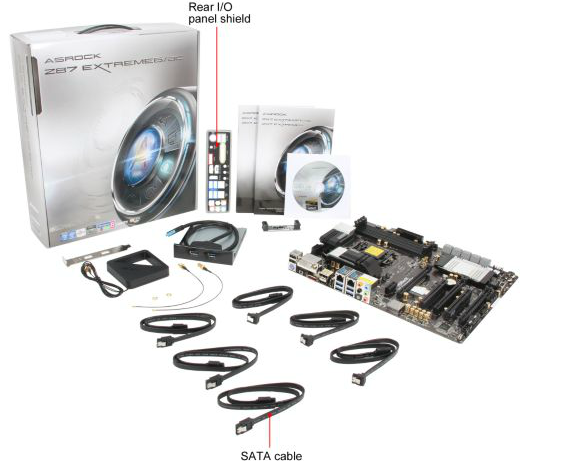
The addition of the USB 3.0 Front panel is always a plus – as we get three USB 3.0 headers onboard it makes sense to add in that front panel. The WiFi antenna is a new design although it essentially requires it to be suspended from somewhere to get best coverage. This is in comparison to the ASUS solutions in the past which are magnetic. The ASRock design does feel better than the last generation, but there is still room for improvement.
ASRock Z87 Extreme6/AC Overclocking
Experience with ASRock Z87 Extreme6/AC
On our last ASRock review, of the Z77 OC Formula, we had great fun playing around with all the overclock settings on what was an overclock-oriented motherboard. Due to the success of the OC Formula, ASRock are pushing some of the features down into the channel motherboards, especially when it comes to BIOS and automatic overclock options. In the OS, we get Performance Mode, Power Saving Mode and Auto Tuning, with the Power Saving mode being rather neat in exchange for some initial processing latency. The BIOS has some more typical options ranging from 4.0 GHz to 4.8 GHz in 200 MHz increments.
For manual adjustments, while ASRock’s software options have an upgrade to something more friendly, I am more a fan of their BIOS controls which are neatly laid out and easy to understand, with explanations on what each setting does. In terms of performance, we were unable to push the ASRock far because our engineering sample board had issues with the heatsinks. We have a retail sample in house, but have not had time to run the tests yet! We will update this page when we do so, but up until the point where the heatsink became an issue, the ASRock felt good rising up the MHz.
The only downside in our overclock testing was the lack of any form of reliable voltage monitoring tool. ASRock’s own software is configured incorrectly to report the VRIN voltage rather than VCore where it says ‘VCore Voltage:’, and other tools were stuck showing the stock voltage.
Methodology:
Our standard overclocking methodology is as follows. We select the automatic overclock options and test for stability with PovRay and OCCT to simulate high-end workloads. These stability tests aim to catch any immediate causes for memory or CPU errors.
For manual overclocks, based on the information gathered from previous testing, starts off at a nominal voltage and CPU multiplier, and the multiplier is increased until the stability tests are failed. The CPU voltage is increased gradually until the stability tests are passed, and the process repeated until the motherboard reduces the multiplier automatically (due to safety protocol) or the CPU temperature reaches a stupidly high level (100ºC+). Our test bed is not in a case, which should push overclocks higher with fresher (cooler) air.
Automatic Overclock:
For these automatic overclocks we were using a second i7-4770K CPU, which is a bit of a dog, failing to reach 4.2 GHz.
In the software, we are given three options: Performance Mode, Sandered (sic) Mode and Power Saving Mode. Selecting Performance Mode gives the additional option of Auto Tuning. In terms of OS options, we get an ‘Optimized CPU Setting’ from 4.0 GHz to 4.8 GHz in 200 MHz increments. Here are our results.
In Performance Mode, the system ran the CPU at the 39x multiplier no matter what the loading. This setting scored 1613.14 during PovRay and a peak temperature of 76C during PovRay.
In Power Saving Mode, the system runs at the 8x multiplier most of the time. When a constant load is applied, the system slowly ramps up the CPU speed in small jumps until it hits 39x – the process requires a full 8 seconds of loading to reach full speed. Due to the 8 seconds of ‘less-than-peak’ performance, the system scored 1524.34 during PovRay, and recorded a peak temperature of 76C during OCCT.
In Auto Tuning Mode, the system stress -tested the CPU speed at 3.0 GHz, and on a completed test raised the multiplier and started again. On this method, the system rose to 4.2 GHz and stopped, causing the system to run at 4.2 GHz during idle and at load. With this setting, the system scored 1736.67 during PovRay and recorded a peak temperature of 85C during OCCT.
Manual Overclock:
For our manual overclocks, the CPU used in the other motherboards was available for testing. Our manual overclock settings started with the system at 40x100, with the CPU voltage set at 1.000 volts, CPU VRIN set to 1.65 volts, and load line calibration at Level 1. On a successful stress test, the multiplier was raised and the test repeated; on a failed stress test, the voltage was increased by 0.025 volts and the test repeated.
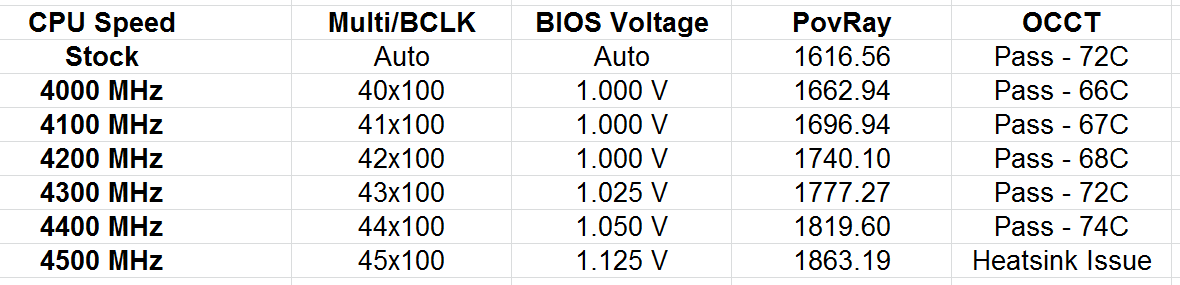
Unfortunately due to the VRM heatsink issue on our board with ES heatsinks, the system did not like any voltages over 1.100 volts, causing lockups. We have a retail sample in to test, but it arrived slightly too late for us to circle back around and retest before leaving for Computex. Watch this space, it will be updated soon.


58 Comments
View All Comments
ShieTar - Thursday, June 27, 2013 - link
Is there a special reason not to test the POST times and DPC latency of the Gigabyte Board? Its power consumption is quiet impressive, and whatever design measures have been used to achieve it do not seem to negatively affect the overall performance. So it would be interesting to complete the picture with the two measurements which are missing.IanCutress - Thursday, June 27, 2013 - link
DPC Latency on the Gigabyte during testing was jumping around a fair bit, hitting 800+, though that is more likely due to the early BIOS revision. I need to run the POST test (as the results are strangely missing from my database) as well as the DPC test on a newer BIOS. Since I started testing almost every manufacturer has released newer BIOSes (as is always the way coming up to a launch) and I really have to lay the hammer down as testing a whole new BIOS takes a good 30 hours or so start to finish, so when I'm locked in that's it. That in a way does give an unfair advantage to the board I test last, but there's not a lot else I can do. I am still getting emails of BIOS updates for these boards as of yesterday.Ian
tribbles - Thursday, June 27, 2013 - link
Am I wrong in thinking that Gigabyte hasn't been doing well in the DPC Latency Test since Z77? If so, that's kind of surprising, since Gigabyte seems to be a "go-to" brand for digital audio workstation builders.IanCutress - Wednesday, July 10, 2013 - link
I retested the UD3H on the F5 (public) BIOS, and it scored 164. The two next boards I have in for review got 160 and 157, which points fingers to the DPC on Haswell being 150+ regardless of motherboard. This might be a fundamental issue.Timur Born - Saturday, July 27, 2013 - link
Run Prime95 (or turn off CPU power features) while measuring DPC latencies to see how much CPU power saving features affect DPCs.jhonabundance - Thursday, August 28, 2014 - link
great share http://asus.comjhonabundance - Thursday, August 28, 2014 - link
this is the best share http://asus.comRick83 - Thursday, June 27, 2013 - link
Maybe a bad choice to use two different ways of graphing the Rightmark results.Being consistent with regard to cutting off the irrelevant bit of the graph makes it a much easier read.
Now it appears at first glance as though the Gigabyte board is much better in THD+N, simply because the differences were so minuscule in the dynamic range bit.
On another note: Shouldn't it be more interesting to use a standardized input instead of the input of the board? In the current protocol a good output could be handicapped by a bad input, and conversely. For most users the output is much more important than the input, so it might be better to test it independently? I would recommend using a USB soundcard as an easy means of doing this test on the same machine, without changing the setup protocol too much.
And finally - I seem to remember Rightmark results for earlier reviews - it would be interesting to have those (or maybe a reference soundcard?) as comparison in the same graph. After all, for DPC you maintain a large cross-platform table as well.
Nice thorough initial review, those nitpicks withstanding.
IanCutress - Thursday, June 27, 2013 - link
Unfortunately I can't adjust the engine to represent from 0 for negative values, I don't have access to the low level options. I forwarded it on as an issue.I'd love to use a standardized input with RMAA. I guess it would be good to get a sound card with an input that supercedes the output of the motherboard and put it through that way, and hopefully there won't be a driver conflict along the line. I'll see what I can do to get in the hardware for that, although many soundcards are designed more for output and the input dynamic range/distortion might be the limiting factor as is the case on motherboards. Something like the Xonar Essence STX has a 118 dBA input with -113 dBA THD+N which might be a good starting point.
Our RMAA testing for Z87 has changed a little from Z77 to make it more of an efficiency test rather than an out-the-box test as audio is such a varied playing field. RMAA is very sensitive to certain windows settings and volumes for example such that with the right combination it was very easy to show A>B or B>A depending on how the OS felt it should be set up. The new testing regimen for RMAA should iron out those issues but the results are not exactly comparable to Z77 for that reason. There are so many wrong ways to set up RMAA it can be difficult (and a learning experience) to get it right.
Ian
popej - Thursday, June 27, 2013 - link
Nice to see you are planning steps in right direction. Using reference card for measurements is a proper solution. Be aware, that separate card add complications to the test, for example you will have to take care about ground loops and signal level matching. Professional card with balanced input could help a lot.