The Impact of Spare Area on SandForce, More Capacity At No Performance Loss?
by Anand Lal Shimpi on May 3, 2010 2:08 AM ESTAnandTech Storage Bench
Note that our 6Gbps controller driver isn't supported by our custom storage bench here, so the C300 results are only offered in 3Gbps mode.
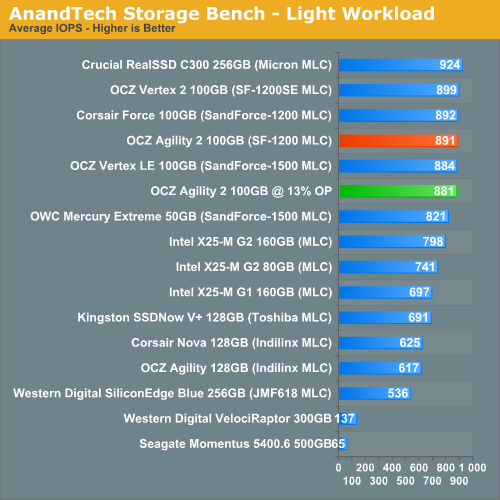
The first in our benchmark suite is a light usage case. The Windows 7 system is loaded with Firefox, Office 2007 and Adobe Reader among other applications. With Firefox we browse web pages like Facebook, AnandTech, Digg and other sites. Outlook is also running and we use it to check emails, create and send a message with a PDF attachment. Adobe Reader is used to view some PDFs. Excel 2007 is used to create a spreadsheet, graphs and save the document. The same goes for Word 2007. We open and step through a presentation in PowerPoint 2007 received as an email attachment before saving it to the desktop. Finally we watch a bit of a Firefly episode in Windows Media Player 11.
There’s some level of multitasking going on here but it’s not unreasonable by any means. Generally the application tasks proceed linearly, with the exception of things like web browsing which may happen in between one of the other tasks.
The recording is played back on all of our drives here today. Remember that we’re isolating disk performance, all we’re doing is playing back every single disk access that happened in that ~5 minute period of usage. The light workload is composed of 37,501 reads and 20,268 writes. Over 30% of the IOs are 4KB, 11% are 16KB, 22% are 32KB and approximately 13% are 64KB in size. Less than 30% of the operations are absolutely sequential in nature. Average queue depth is 6.09 IOs.
The performance results are reported in average I/O Operations per Second (IOPS):
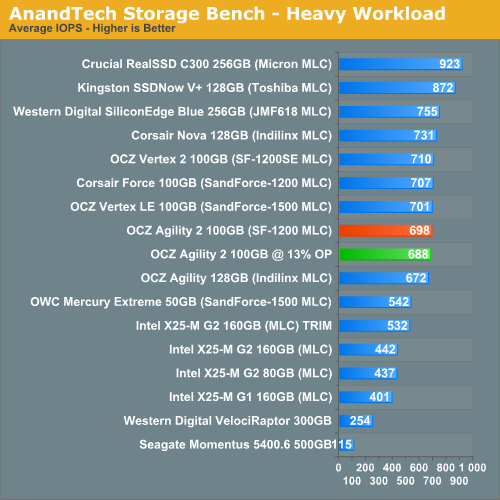
If there’s a light usage case there’s bound to be a heavy one. In this test we have Microsoft Security Essentials running in the background with real time virus scanning enabled. We also perform a quick scan in the middle of the test. Firefox, Outlook, Excel, Word and Powerpoint are all used the same as they were in the light test. We add Photoshop CS4 to the mix, opening a bunch of 12MP images, editing them, then saving them as highly compressed JPGs for web publishing. Windows 7’s picture viewer is used to view a bunch of pictures on the hard drive. We use 7-zip to create and extract .7z archives. Downloading is also prominently featured in our heavy test; we download large files from the Internet during portions of the benchmark, as well as use uTorrent to grab a couple of torrents. Some of the applications in use are installed during the benchmark, Windows updates are also installed. Towards the end of the test we launch World of Warcraft, play for a few minutes, then delete the folder. This test also takes into account all of the disk accesses that happen while the OS is booting.
The benchmark is 22 minutes long and it consists of 128,895 read operations and 72,411 write operations. Roughly 44% of all IOs were sequential. Approximately 30% of all accesses were 4KB in size, 12% were 16KB in size, 14% were 32KB and 20% were 64KB. Average queue depth was 3.59.
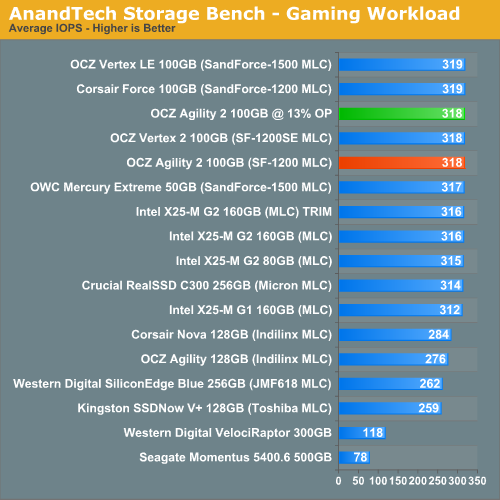
The gaming workload is made up of 75,206 read operations and only 4,592 write operations. Only 20% of the accesses are 4KB in size, nearly 40% are 64KB and 20% are 32KB. A whopping 69% of the IOs are sequential, meaning this is predominantly a sequential read benchmark. The average queue depth is 7.76 IOs.


30 Comments
View All Comments
Spoelie - Monday, May 3, 2010 - link
One area I think that might still be affected is reliability. SandForce stated that (1) smaller geometries introduce more defects and (2) manufacturers could use cheaper, less reliable flash in drives with their controllers.Does the reduction of spare area impart reduced lifetime/reliability in the above scenarios or is its responsibility purely one for performance? I reckon it's not something one would be able to measure though.
GeorgeH - Monday, May 3, 2010 - link
Reliability will go down. 28% wasn't a random choice, it was selected to deliver a certain MTBF. AFAIK the "enterprise" drives use the same 28%, though, so "consumer" usage models should be able to get by with less.The real question is how they arrived at 13% - is it Bean Counter Bob's number or Engineer Eric's number? Until they answer that question and release their methodology for arriving at 13%, I wouldn't touch one of these with a thousand foot pole. The chance that 13% was the misguided result of some accountant waddling over to the R&D department for 5 minutes is just too great relative to the small benefit of 10-20 "free" GB's.
softdrinkviking - Monday, May 3, 2010 - link
i wonder how much of a role the spare area plays in maintaining the compression algorithms for the sandforce controller.it's seems like, with such a complex controller, it would be wise to have plenty of "hash or index" space to work with, or is that all stored somewhere else?
jleach1 - Monday, May 3, 2010 - link
IDK about you...but i dont plan on keeping a drive this small for that long. A few years is reasonable. Right now, what people want is: a cheap drive that performs well. I'll gladly trade 6 months of the life of my drive for some badly needed space. In 6 months, theyll likely have a set of firmware options that increase the amount of usable space, and improved algorithms that offset the normal reliability problems.Good job OCZ. Less $/GB= a happier public.
softdrinkviking - Wednesday, May 5, 2010 - link
my question was about how the amount of spare area would effect the short term reliability of the drive. assuming that these drives are relatively unproven, who's to say that they won't start losing data because of the complex compression used by the controller?i want to know if lessening the spare area could contribute to controller errors, leading to the loss of data.
Belard - Monday, May 3, 2010 - link
Looking at your benchmarks, other than SATA 3/6GB/s system, the Intel X25-M (G2) are still constantly the fastest and most reliable on the market. Personally, I can't wait for the SSD market to have SATA-3 drives as standard.Seq. Read
OCZ = 264 MB/s * (okay a bit faster)
X25 = 256 MB/s
Seq. Write
OCZ = 252 MB/s * (Destroys the intel)
X25 = 102 MB/s
But most operations are random... So if you're doing Video encode/decode or copy, the OCZ kills.
Random. Read
OCZ = 52 MB/s
X25 = 64 MB/s * Intel wins easily. Even the top 6GB/s is barely faster.
Random Write
OCZ = 44 MB/s
X25 = 46 MB/s * (not bad for an OLD drive)
Half the drives are much slower, but some of the best easily faster.
It will be intresting to see what happens to the SSD market in 12 months.
7Enigma - Monday, May 3, 2010 - link
I kinda feel the same way. Since we have not yet reached the point where a large portion of our data is stored on these (most of us at least), these sequential writes just don't blow me away the same way the X25 changed the HD scene. After the intial setup (OS, programs, a couple games), the drive is basically going to be a random read/write drive with occassional install, and for that I can wait the extra time that a faster drive would have saved if the end result (gaming/bootup/etc.) is nearly the same.What I want to see is the game-changing performance the X25 did to the traditional HD in the random read/write metric. Get those into the 200-300MB/sec and THEN I'll get excited again.
The0ne - Monday, May 3, 2010 - link
Reading all the latest Anandtech SSD reviews feels like I'm reading someone's hobby work :) So many changes. Can't wait til it stabilizes A LOT more.sgilmore1962 - Monday, May 3, 2010 - link
Random WriteOCZ = 44 MB/s
X25 = 46 MB/s * (not bad for an OLD drive)
Half the drives are much slower, but some of the best easily faster.
Conveniently omitting the part where if you are using Windows 7 4k random writes are aligned on 4k boundries. The Sandforce random 4k writes become 162mb/s a whopping margin over Intel G2.
Belard - Monday, May 3, 2010 - link
Do you know that there is a REPLY button? That way your COMMENT would be attached to the post, rather than starting a whole new dis-connected thread.So look to the left, there my name is and you'll see the word REPLY. Give it a shot.
- - - - -
Man, wish there was a QUOTE function as well as the ability to save my LOG-IN on this revised site.
"Conveniently omitting the part where if you are using Windows 7 4k random writes are aligned on 4k boundries. The Sandforce random 4k writes become 162mb/s a whopping margin over Intel G2."
Er... no. I *DID* go with the Win7 performance test. I was comparing the REVIEWED drive to the Intel X25-M. And I ALSO said "but some of the best easily faster."... so I was NOT disregarding the SF drives.
I was expecting people to be able to figure this out.
And when it comes to RANDOM reads... All those SF drives your so concerned with, are easily SLOWER than the X25-M.
Intel X25-M G2 160/80 = 64.3~5 MB/s
Intel X25-M G1 160/80 = 57.9 MB/s
SF 1200~1500s = 49.4~52.1 MB/s... Ouch, SF is slower than the year old G2 and even older G1!! Even losing up to 15MB.s! About 25% slower than intels!
The intel drives were the most expensive... now they are generally cheaper (cost per GB).
I will continue to buy G2 drives (even those without the intel label) for my clients until something that is better across the board comes out. As far as I am concerned, Random Reads are somewhat more important than random reads... and both are about Sequential. This is why Windows7 boots up in about 10~12 seconds vs 35~50sec for a HD on the same same desktop.
And I am not even a big fan of intel. I usually build AMD systems. But I'll buy what is good.
Intel X25-M G2 wins in:
A - price
B - Availability (Many of the OCZs are not even available. Some stores carry older models)
C - Performance Random
D - Performance Sequential (okay, at 256 vs 265.... intel is a bit slower)
E - Reliability
F - TRIM support (Its unclear if all the other drives support TRIM - depending on the Firmware)
From the looks of things, the G2 will lose its position when the G3 comes out.
I plan to get a G3 for my next build... Hopefully it'll be $150~200 for 80GB with SATA 3.0 delivering 375+MB/s Seq Read/Write and 200MB/s for random R/W. That, I would really drool over!