ASRock DeskMeet B660 Review: An Affordable NUC Extreme?
by Ganesh T S on January 23, 2023 8:30 AM EST- Posted in
- Systems
- ASRock
- SilverStone
- SFF
- Mushkin
- Alder Lake
- B660
- DeskMeet
- Raptor Lake
System Performance: Multi-Tasking
One of the key drivers of advancments in computing systems is multi-tasking. On mobile devices, this is quite lightweight - cases such as background email checks while the user is playing a mobile game are quite common. Towards optimizing user experience in those types of scenarios, mobile SoC manufacturers started integrating heterogenous CPU cores - some with high performance for demanding workloads, while others were frugal in terms of both power consumption / die area and performance. This trend is now slowly making its way into the desktop PC space.
Multi-tasking in typical PC usage is much more demanding compared to phones and tablets. Desktop OSes allow users to launch and utilize a large number of demanding programs simultaneously. Responsiveness is dictated largely by the OS scheduler allowing different tasks to move to the background. Intel's Alder Lake processors work closely with the Windows 11 thread scheduler to optimize performance in these cases. Keeping these aspects in mind, the evaluation of multi-tasking performance is an interesting subject to tackle.
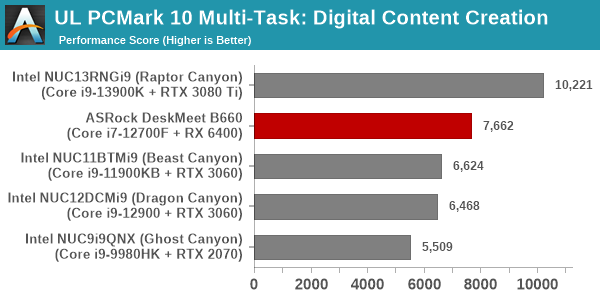
We have augmented our systems benchmarking suite to quantitatively analyze the multi-tasking performance of various platforms. Our previous attempt involved the triggering of a VLC transcoding task to transform 1716 3840x1714 frames encoded as a 24fps AVC video (Blender Project's 'Tears of Steel' 4K version) into a 1080p HEVC version in a loop. VLC internally uses the x265 encoder, and the settings are configured to allow the CPU usage to be saturated across all cores. Unfortunately, with some of the large core-count systems, we found VLC falling back to single-core usage. We have since replaced it with a ffmpeg transcoding task that appears to uniformly load the cores even in the Raptor Canyon NUC. The transcoding rate is monitored continuously. One complete transcoding pass is allowed to complete before starting the first multi-tasking workload - the PCMark 10 Extended bench suite. A comparative view of the PCMark 10 scores for various scenarios is presented in the graphs below. Also available for concurrent viewing are scores in the normal case where the benchmark was processed without any concurrent load, and a graph presenting the loss in performance.
| UL PCMark 10 Load Testing - Digital Content Creation Scores | |||
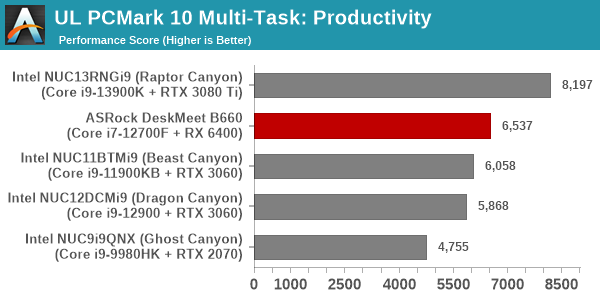
| UL PCMark 10 Load Testing - Productivity Scores | |||
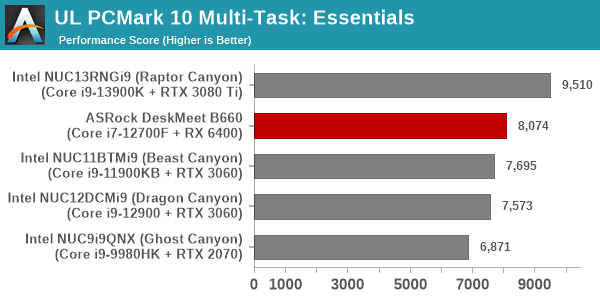
| UL PCMark 10 Load Testing - Essentials Scores | |||
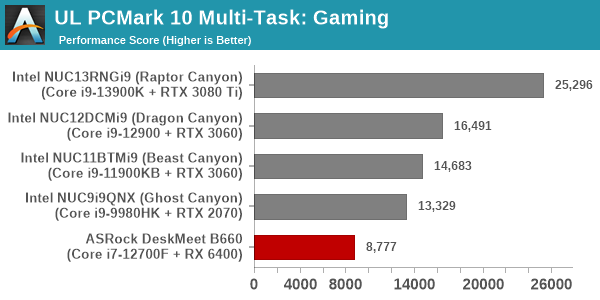
| UL PCMark 10 Load Testing - Gaming Scores | |||
| UL PCMark 10 Load Testing - Overall Scores | |||
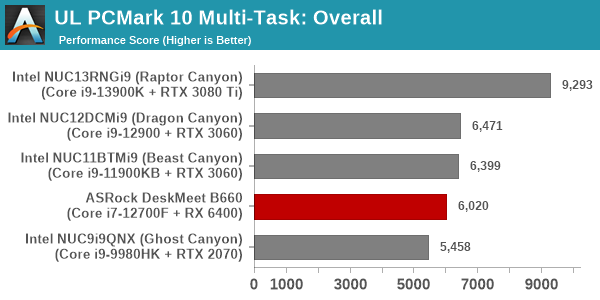
The performance loss in the PCMark workloads range between 25% and 33%, with the DeskMeet B660 managing to score the lowest overall performance loss numbers.
Following the completion of the PCMark 10 benchmark, a short delay is introduced prior to the processing of Principled Technologies WebXPRT4 on MS Edge. Similar to the PCMark 10 results presentation, the graph below show the scores recorded with the transcoding load active. Available for comparison are the dedicated CPU power scores and a measure of the performance loss.
| Principled Technologies WebXPRT4 Load Testing Scores (MS Edge) | |||
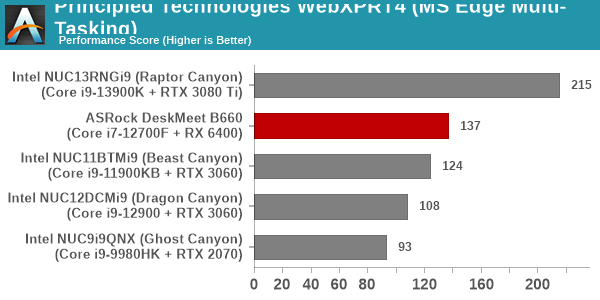
Here, the performance loss for the DeskMeet B660 is heavier, with the extra cores in the Raptor Canyon enabling it to balance both the transcoding and web browsing tasks in a more effective manner.
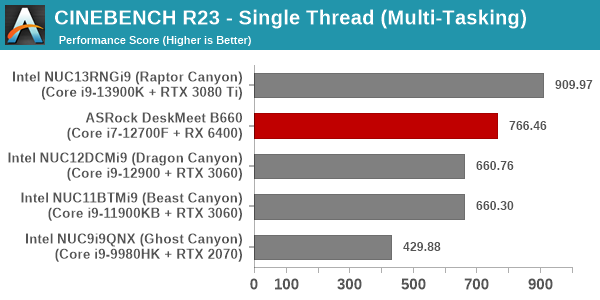
The final workload tested as part of the multitasking evaluation routine is CINEBENCH R23.
| 3D Rendering - CINEBENCH R23 Load Testing - Single Thread Score | |||
| 3D Rendering - CINEBENCH R23 Load Testing - Multiple Thread Score | |||
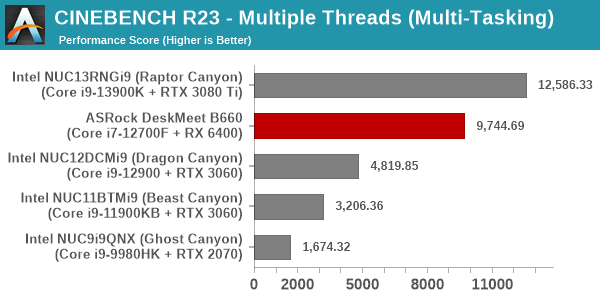
The DeskMeet B660 manage to get back to the top spot in terms of minimizing performance loss with the concurrent load being active.
After the completion of all the workloads, we let the transcoding routine run to completion. The monitored transcoding rate throughout the above evaluation routine (in terms of frames per second) is graphed below.
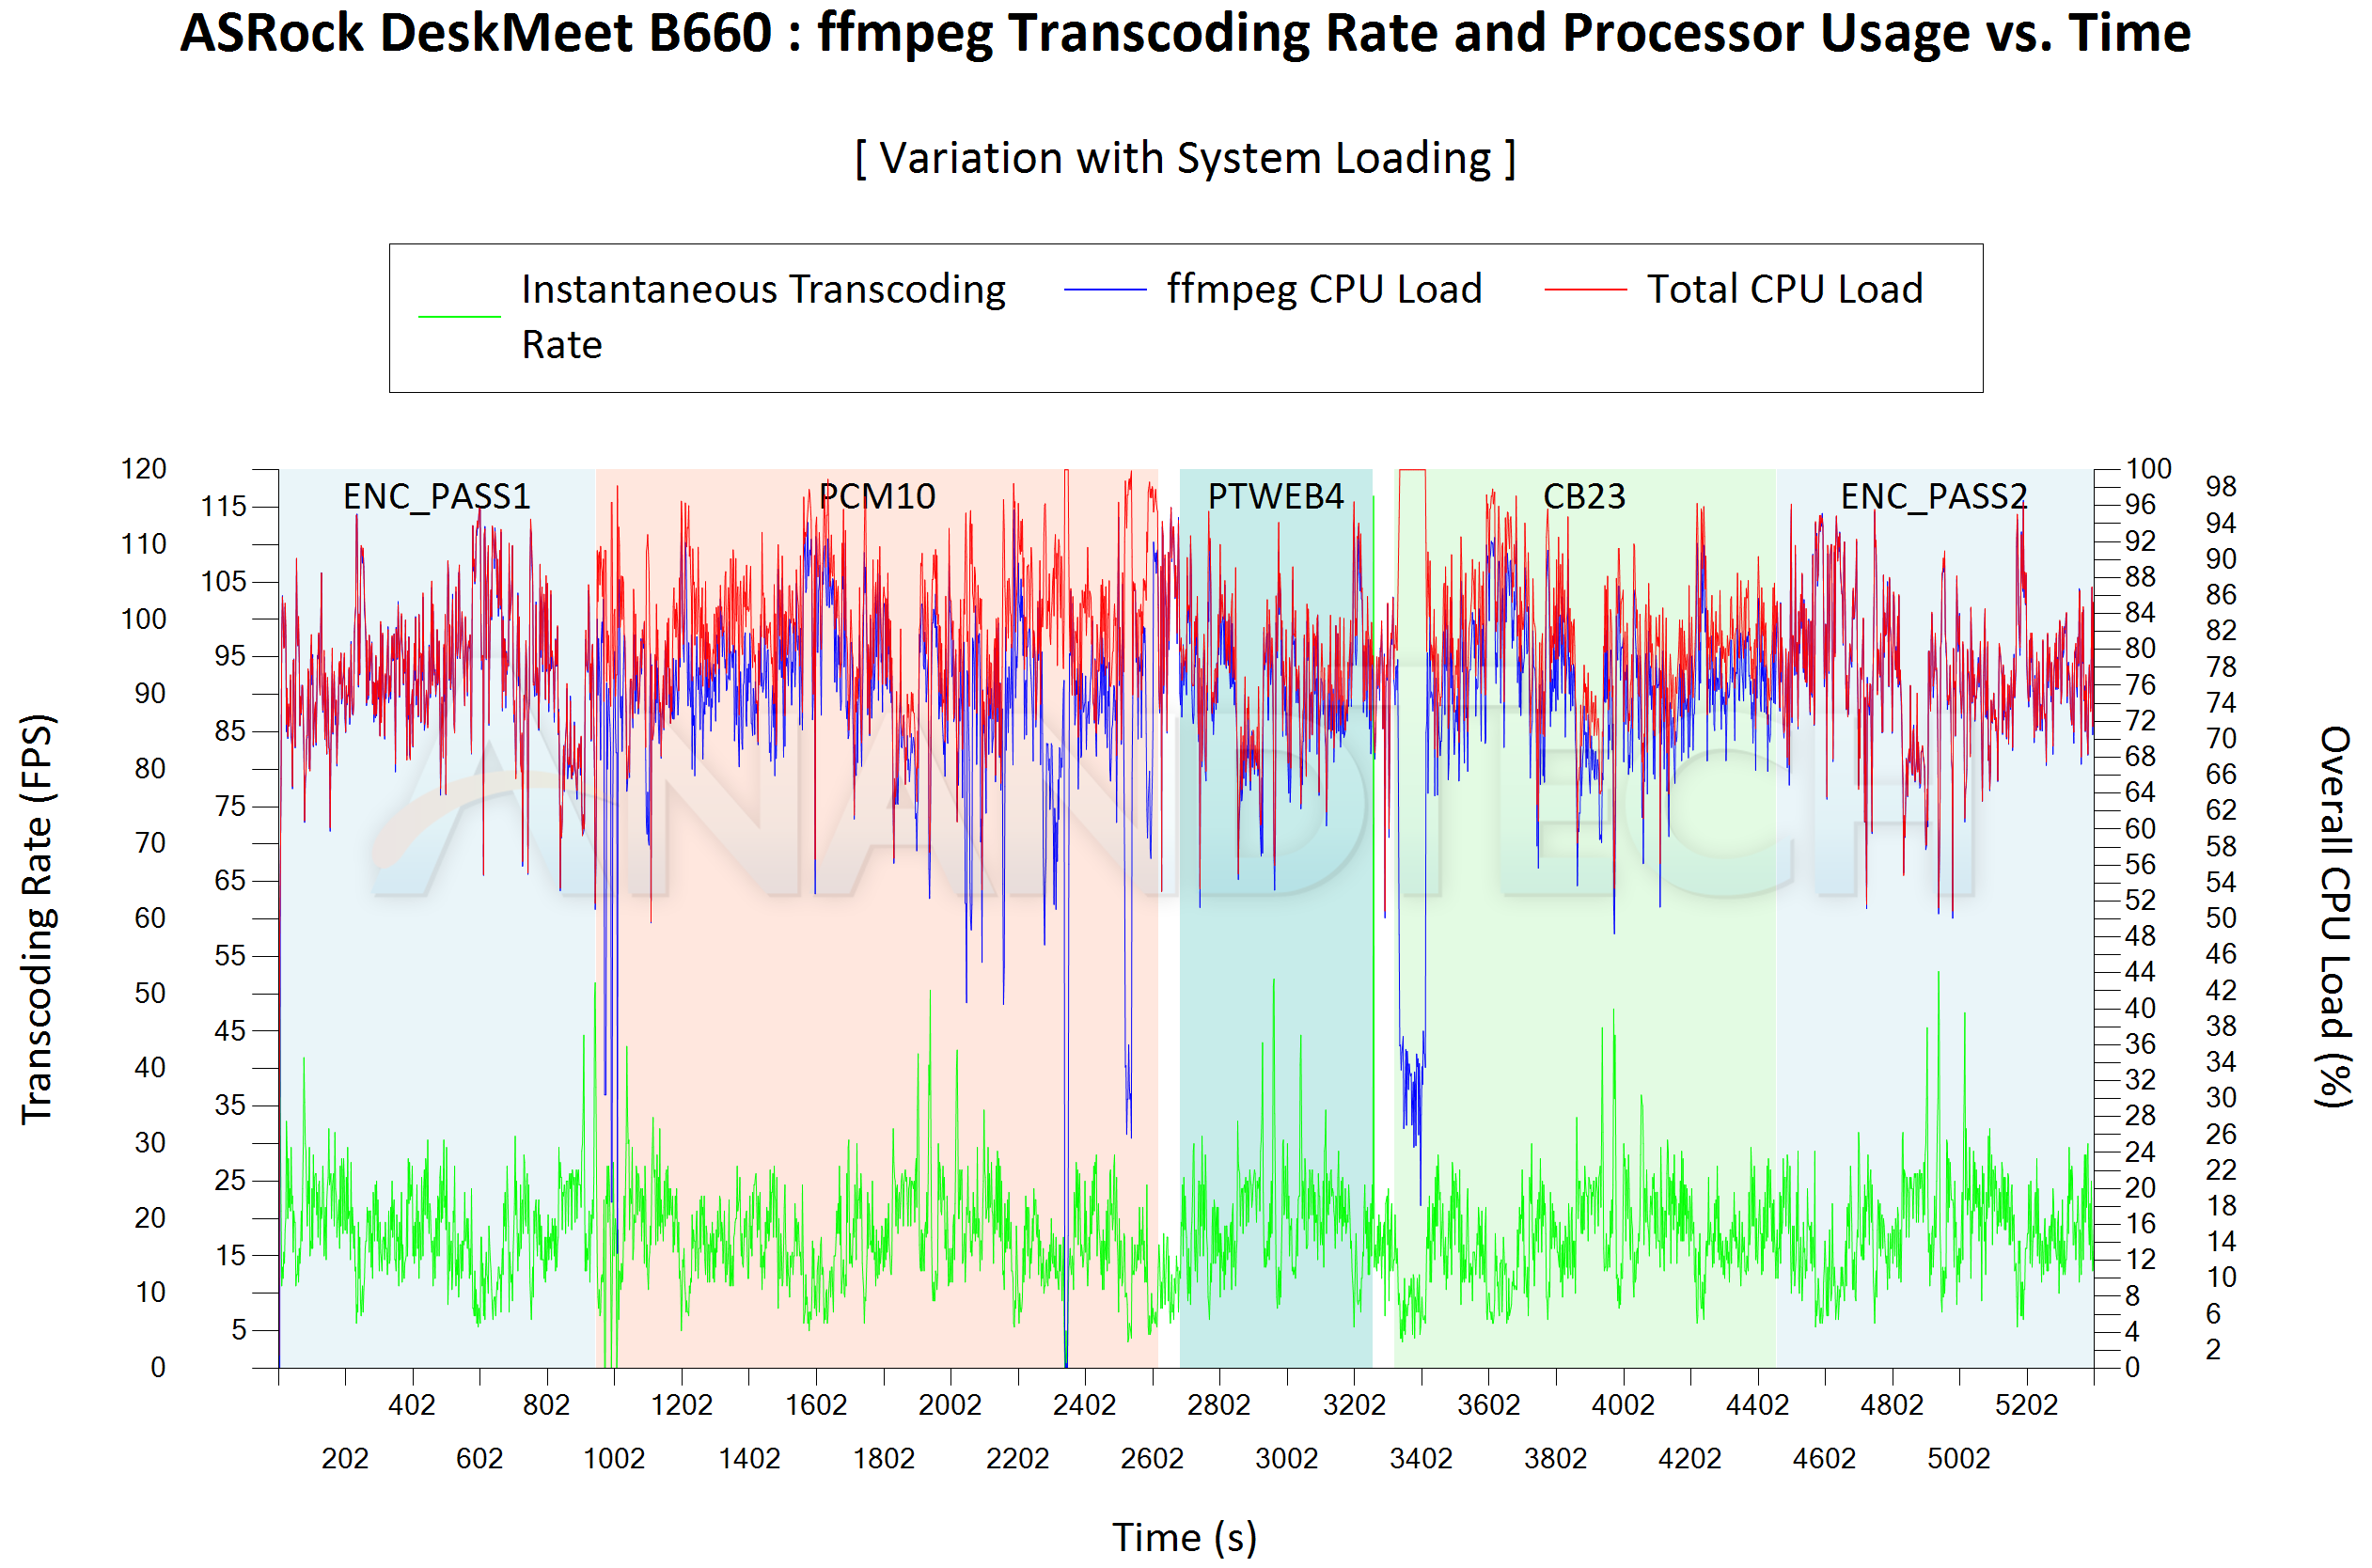
A quantitative view of the transcoding performance in the different stages is presented in the table below.
| ASRock DeskMeet B660 ffmpeg Transcoding Rate (Multi-Tasking Test) | |||
| Task Segment | Transcoding Rate (FPS) | ||
| Minimum | Average | Maximum | |
| Transcode Start Pass | 5.5 | 18.74 | 55 |
| PCMark 10 | 0 | 17.23 | 50.5 |
| WebXPRT 4 | 5.5 | 17.87 | 52 |
| Cinebench R23 | 3.5 | 17.21 | 48 |
| Transcode End Pass | 5.5 | 18.68 | 53 |
Across all phases, the loss in transcoding performance is minimal. During periods of heavy multi-threaded loading like PCMark 10 and Cinebench R23, the transcoding does experience some hiccups, but always recovers within a short while.


27 Comments
View All Comments
1_rick - Monday, January 23, 2023 - link
No pictures of the system with the GPU installed?megadirk - Monday, January 23, 2023 - link
I found one on their newegg listing under user review pictures. https://c1.neweggimages.com/itemreivewimages/revie...1_rick - Monday, January 23, 2023 - link
Thanks! I searched the site to find the rest of the images--the one showing the back panel doesn't have an add-in card installed at all. It looks like the card in your image is probably something like a dual NIC based on the shape of the metal boxes connected to the card backplane. I certainly hope that's not a GPU considering if it is whoever put that together would've had to take off the heat sink and hope a regular 120MM fan would cool it!ganeshts - Monday, January 23, 2023 - link
I will upload some more images in a gallery in the 'Assembling the System' sub-section later tonight. Yes, that image is not one of a GPU. If a GPU is installed, it becomes impossible to install the extra fan in the system. Even a single-slot GPU's cooling solution would interfere with the fan placement.With a single-slot GPU, two 2.5" drives can be installed in the place where the fan is seen. In the vertical orientation, the fan appears on top of the case.
With a dual-slot GPU, there is very little gap between the top of the case and the GPU's cooling solution. The GPU fan exhausts hot air directly out through the perforations on the top of the chassis.
ganeshts - Tuesday, January 24, 2023 - link
A gallery with pictures from the assembly process has now been added in the relevant section.The GPU is in the picture starting from https://www.anandtech.com/Gallery/Album/8223#31
1_rick - Wednesday, January 25, 2023 - link
Thanks, Ganesh.ballsystemlord - Monday, January 23, 2023 - link
@Ganesh Nice to see a Navi product being benchmarked. It's been a long time.RaiderJ - Monday, January 23, 2023 - link
I'm surprised they didn't go with a smaller ITX PSU. Seems like a simple way to reduce the size with minimal impact to cost/noise/heat.meacupla - Monday, January 23, 2023 - link
yeah, the back panel shows a mounting point for SFX PSUs. Asrock must have used an ATX for cost reasons.thomasjkenney - Monday, January 23, 2023 - link
Thanks, this is a good read."Unfortunately, the documentation is not clear from the documentation..."
You don't say? :)