The Intel Xeon W-3175X Review: 28 Unlocked Cores, $2999
by Ian Cutress on January 30, 2019 9:00 AM ESTCPU Performance: Web and Legacy Tests
While more the focus of low-end and small form factor systems, web-based benchmarks are notoriously difficult to standardize. Modern web browsers are frequently updated, with no recourse to disable those updates, and as such there is difficulty in keeping a common platform. The fast paced nature of browser development means that version numbers (and performance) can change from week to week. Despite this, web tests are often a good measure of user experience: a lot of what most office work is today revolves around web applications, particularly email and office apps, but also interfaces and development environments. Our web tests include some of the industry standard tests, as well as a few popular but older tests.
We have also included our legacy benchmarks in this section, representing a stack of older code for popular benchmarks.
All of our benchmark results can also be found in our benchmark engine, Bench.
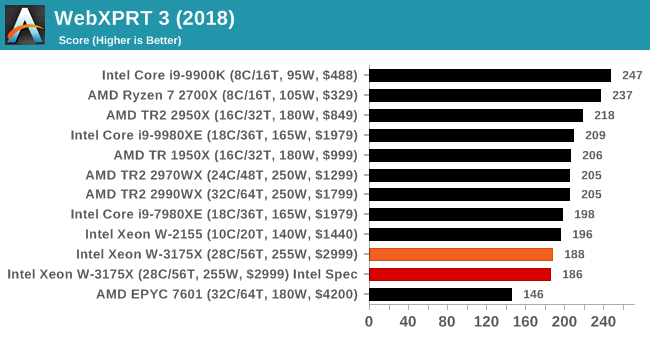
For our graphs, some of them have two values: a regular value in orange, and one in red called 'Intel Spec'. ASUS offers the option to 'open up' the power and current limits of the chip, so the CPU is still running at the same frequency but is not throttled. Despite Intel saying that they recommend 'Intel Spec', the system they sent to us to test was actually set up with the power limits opened up, and the results they provided for us to compare to internally also correlated with that setting. As a result, we're providing both sets results for our CPU tests.
WebXPRT 3: Modern Real-World Web Tasks, including AI
The company behind the XPRT test suites, Principled Technologies, has recently released the latest web-test, and rather than attach a year to the name have just called it ‘3’. This latest test (as we started the suite) has built upon and developed the ethos of previous tests: user interaction, office compute, graph generation, list sorting, HTML5, image manipulation, and even goes as far as some AI testing.
For our benchmark, we run the standard test which goes through the benchmark list seven times and provides a final result. We run this standard test four times, and take an average.
Users can access the WebXPRT test at http://principledtechnologies.com/benchmarkxprt/webxprt/
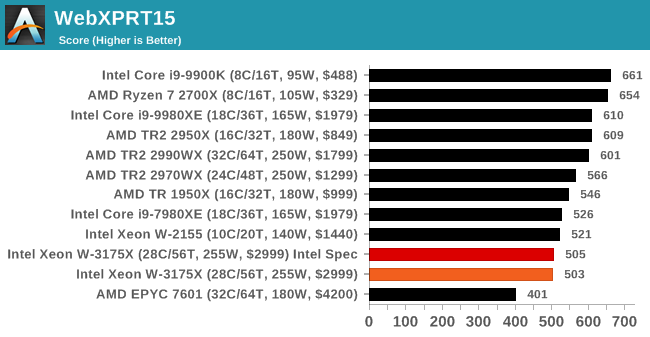
WebXPRT 2015: HTML5 and Javascript Web UX Testing
The older version of WebXPRT is the 2015 edition, which focuses on a slightly different set of web technologies and frameworks that are in use today. This is still a relevant test, especially for users interacting with not-the-latest web applications in the market, of which there are a lot. Web framework development is often very quick but with high turnover, meaning that frameworks are quickly developed, built-upon, used, and then developers move on to the next, and adjusting an application to a new framework is a difficult arduous task, especially with rapid development cycles. This leaves a lot of applications as ‘fixed-in-time’, and relevant to user experience for many years.
Similar to WebXPRT3, the main benchmark is a sectional run repeated seven times, with a final score. We repeat the whole thing four times, and average those final scores.
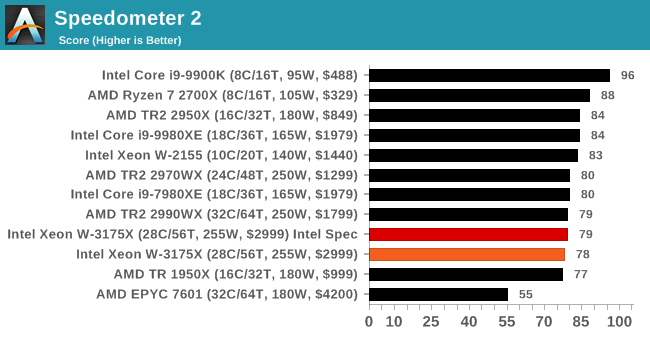
Speedometer 2: JavaScript Frameworks
Our newest web test is Speedometer 2, which is a accrued test over a series of javascript frameworks to do three simple things: built a list, enable each item in the list, and remove the list. All the frameworks implement the same visual cues, but obviously apply them from different coding angles.
Our test goes through the list of frameworks, and produces a final score indicative of ‘rpm’, one of the benchmarks internal metrics. We report this final score.
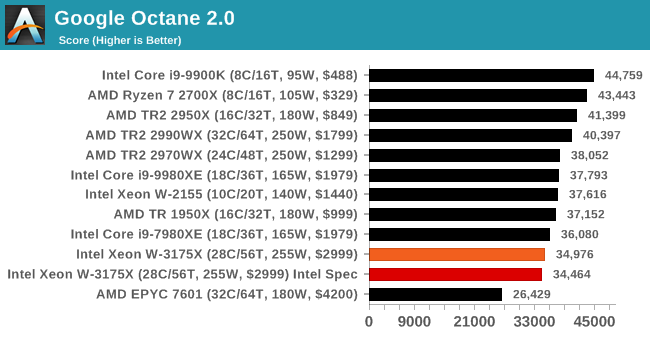
Google Octane 2.0: Core Web Compute
A popular web test for several years, but now no longer being updated, is Octane, developed by Google. Version 2.0 of the test performs the best part of two-dozen compute related tasks, such as regular expressions, cryptography, ray tracing, emulation, and Navier-Stokes physics calculations.
The test gives each sub-test a score and produces a geometric mean of the set as a final result. We run the full benchmark four times, and average the final results.
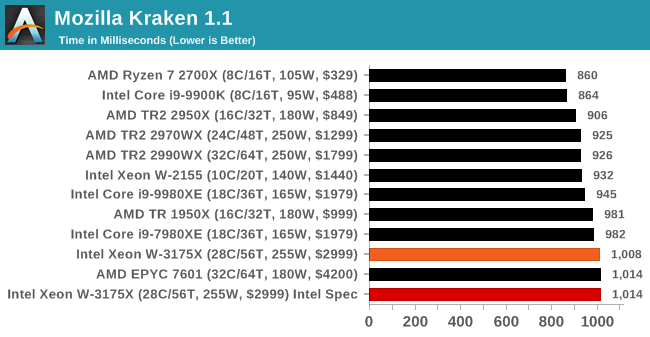
Mozilla Kraken 1.1: Core Web Compute
Even older than Octane is Kraken, this time developed by Mozilla. This is an older test that does similar computational mechanics, such as audio processing or image filtering. Kraken seems to produce a highly variable result depending on the browser version, as it is a test that is keenly optimized for.
The main benchmark runs through each of the sub-tests ten times and produces an average time to completion for each loop, given in milliseconds. We run the full benchmark four times and take an average of the time taken.
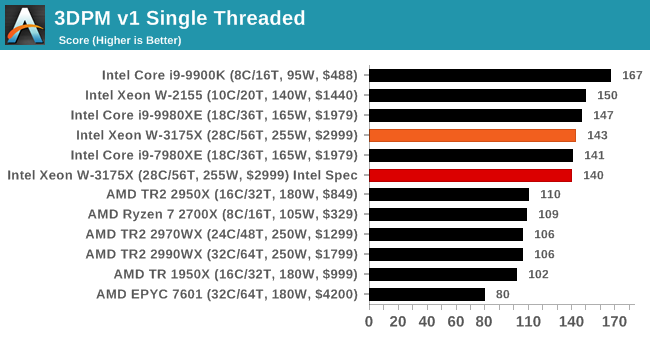
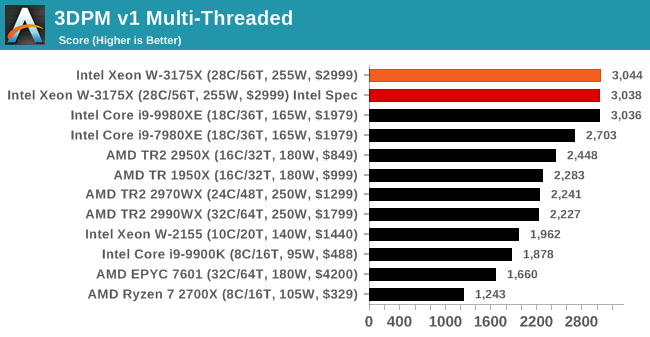
3DPM v1: Naïve Code Variant of 3DPM v2.1
The first legacy test in the suite is the first version of our 3DPM benchmark. This is the ultimate naïve version of the code, as if it was written by scientist with no knowledge of how computer hardware, compilers, or optimization works (which in fact, it was at the start). This represents a large body of scientific simulation out in the wild, where getting the answer is more important than it being fast (getting a result in 4 days is acceptable if it’s correct, rather than sending someone away for a year to learn to code and getting the result in 5 minutes).
In this version, the only real optimization was in the compiler flags (-O2, -fp:fast), compiling it in release mode, and enabling OpenMP in the main compute loops. The loops were not configured for function size, and one of the key slowdowns is false sharing in the cache. It also has long dependency chains based on the random number generation, which leads to relatively poor performance on specific compute microarchitectures.
3DPM v1 can be downloaded with our 3DPM v2 code here: 3DPMv2.1.rar (13.0 MB)
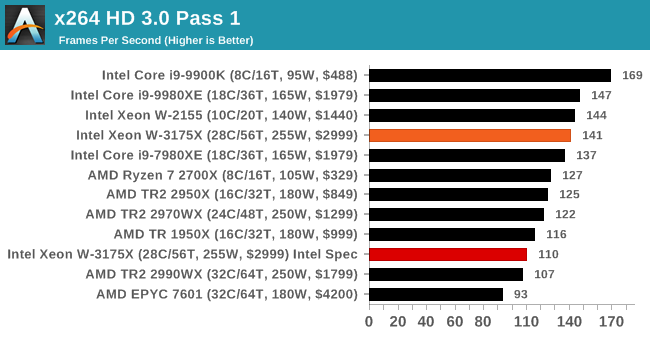
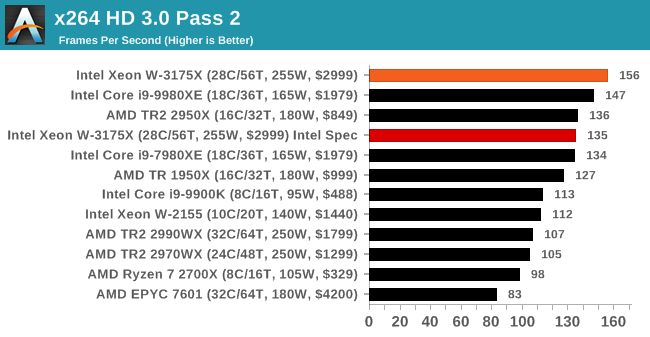
x264 HD 3.0: Older Transcode Test
This transcoding test is super old, and was used by Anand back in the day of Pentium 4 and Athlon II processors. Here a standardized 720p video is transcoded with a two-pass conversion, with the benchmark showing the frames-per-second of each pass. This benchmark is single-threaded, and between some micro-architectures we seem to actually hit an instructions-per-clock wall.


136 Comments
View All Comments
SaturnusDK - Wednesday, January 30, 2019 - link
The price is the only big surprise here. At $3000 for the CPU alone and three times that in system price it's actually pretty decently priced. The performance is as expected but it will soon be eclipsed. The only question is what price AMD will change for it's coming Zen2 based processors in the same performance bracket, we won't know until then if the W3175X is a worthwhile investment.HStewart - Wednesday, January 30, 2019 - link
I thought the rumors were that this chip was going to be $8000. I am curious what Covey version of this chip will perform and when it comes out.But lets be honest, unless you are extremely rich or crazy, buying any processor with large amount of cores is crazy - to me it seems like high end gaming market is being taking for ride with all this core war - buy high end core now just to say you have highest performance and then next year purchase a new one. Of course there is all the ridicules process stuff. It just interesting to find a 28 core beats a AMD 32 core with Skylake and 14nm on Intel.
As for Server side, I would think it more cost effective to blade multiple lower core units than less higher core units.
jakmak - Wednesday, January 30, 2019 - link
Its not really surprising to see an 28 Intel beating an 32Core AMD. After all, it is not a hidden mystery that the Intel chips not only have a small IPC advantage, but also are able to run with a higher clockrate (nevertheless the power wattage). In this case, the Xeon-W excells where these 2 advantages combined are working 28x, so the 2 more cores on AMD side wont cut it.It is also obvious that the massive advantage works mostly in those cases where clock rate is the most important part.
MattZN - Wednesday, January 30, 2019 - link
Well, it depends on whether you care about power consumption or not, jakmak. Traditionally the consumer space hasn't cared so much, but its a bit of a different story when whole-system power consumption starts reaching for the sky. And its definitely reaching for sky with this part.The stock intel part burns 312W on the Blender benchmark while the stock threadripper 2990WX burns 190W. The OC'd Intel part burns 672W (that's right, 672W without a GPU) while the OCd 2990WX burns 432W.
Now I don't know about you guys, but that kind of power dissipation in such a small area is not something I'm willing to put inside my house unless I'm physically there watching over it the whole time. Hell, I don't even trust my TR system's 330W consumption (at the wall) for continuous operation when some of the batches take several days to run. I run it capped at 250W.
And... I pay for the electricity I use. Its not cheap to run machines far away from their maximally efficient point on the curve. Commercial machines have lower clocks for good reason.
-Matt
joelypolly - Wednesday, January 30, 2019 - link
Do you not have a hair dryer or vacuum or oil heater? They can all push up to 1800W or moreevolucion8 - Wednesday, January 30, 2019 - link
That is a terrible example if you ask me.ddelrio - Wednesday, January 30, 2019 - link
lol How long do you keep your hair dryer going for?philehidiot - Thursday, January 31, 2019 - link
Anything up to one hour. I need to look pretty for my processor.MattZN - Wednesday, January 30, 2019 - link
Heh. That's is a pretty bad example. People don't leave their hair dryers turned on 24x7, nor floor heaters (I suppose, unless its winter). Big, big difference.Regardless, a home user is not likely to see a large bill unless they are doing something really stupid like crypto-mining. There is a fairly large distinction between the typical home-use of a computer vs a beefy server like the one being reviewed here, let alone a big difference between a home user, a small business environment (such as popular youtube tech channels), and a commercial setting.
If we just use an average electricity cost of around $0.20/kWh (actual cost depends on where you live and the time of day and can range from $0.08/kWh to $0.40/kWh or so)... but lets just $0.20/kWh.
For a gamer who is spending 4 hours a day burning 300W the cost of operation winds up being around $7/month. Not too bad. Your average gamer isn't going to break the bank, so to speak. Mom and Dad probably won't even notice the additional cost. If you live in cold environment, your floor heater will indeed cost more money to operate.
If you are a solo content creator you might be spending 8 to 12 hours a day in front of the computer. For the sake of argument, running blender or encoding jobs in the background. 12 hours of computer use a day @ 300W costs around $22/month.
If you are GN or Linus or some other popular YouTube site and you are running half a dozen servers 24x7 plus workstations for employees plus running numerous batch encoding jobs on top of that, the cost will begin to become very noticable. Now you are burning, say, 2000W 24x7 (pie in the sky rough average), costing around $290/month ($3480/year). That content needs to be making you money.
A small business or commercial setting can wind up spending a lot of money on energy if no care at all is taken with regards to power consumption. There are numerous knock-on costs, such as A/C in the summer which has to take away all the equipment heat on top of everything else. If A/C is needed (in addition to human A/C needs), the cost is doubled. If you are renting colocation space then energy is the #1 cost and network bandwidth is the #2 cost. If you are using the cloud then everything has bloated costs (cpu, network, storage, and power).
In anycase, this runs the gamut. You start to notice these things when you are the one paying the bills. So, yes, Intel is kinda playing with fire here trying to promote this monster. Gaming rigs that aren't used 24x7 can get away with high burns but once you are no longer a kid in a room playing a game these costs can start to matter. As machine requirements grow then running the machines closer to their maximum point of efficiency (which is at far lower frequencies) begins to trump other considerations.
If that weren't enough, there is also the lifespan of the equipment to consider. A $7000 machine that remains relevant for only one year and has as $3000/year electricity bill is a big cost compared to a $3000 machine that is almost as fast and only has $1500/year electricity bill. Or a $2000 machine. Or a $1000 machine. One has to weigh convenience of use against the total cost of ownership.
When a person is cognizant of the costs then there is much less of an incentive to O.C. the machines, or even run them at stock. One starts to run them like real servers... at lower frequencies to hit the maximum efficiency sweet spot. Once a person begins to think in these terms, buying something like this Xeon is an obvious and egregious waste of money.
-Matt
808Hilo - Thursday, January 31, 2019 - link
Most servers run at idle speed. That is a sad fact. The sadder fact is that they have no discernible effect on business processes because they are in fact projected and run by people in a corp that have a negative cost to benefit ratio. Most important apps still run on legacy mainframe or mini computers. You know the one that keep the electricity flowing, planes up, ticketing, aisles restocked, powerplants from exploding, ICBM tracking. Only social constructivists need an overclocked server. Porn, youtubers, traders, datacollectors comes to mind. Not making much sense.