The Corsair SP (Static Pressure), AF (High Airflow) 120/140mm Fan Review
by E. Fylladitakis on November 25, 2015 8:00 AM ESTCorsair's 120mm Performance
The AF120 Performance and AF120 Quiet Edition
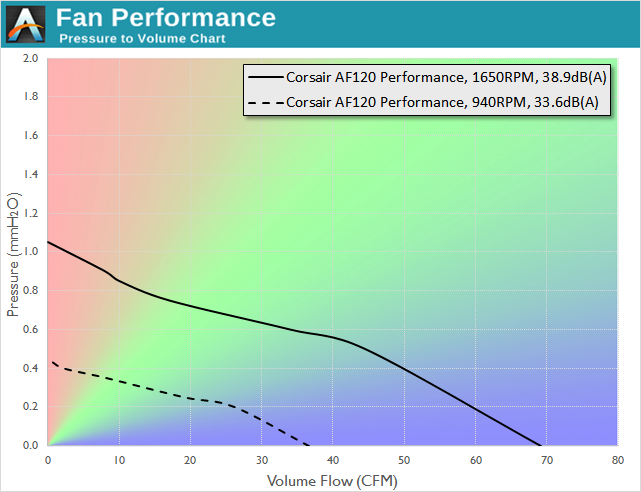
First one up is the 'High Airflow' variant of the 120mm line (non-LED), which comes in Performance and Quiet modes. This is the Performance variant pressure/volume response at 12V and 7V:
Whereas the quiet model has this response - note the axes are the same for both AF120 models in this case.
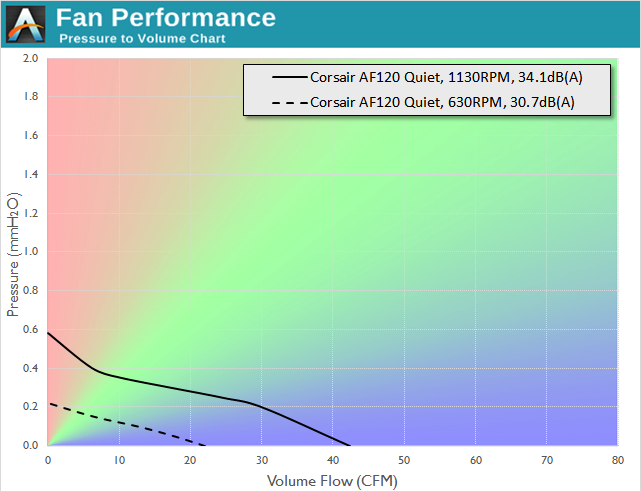
While both AF120 fans in the graphs above share the same shape and design, with the only difference being their rotational speed, the performance curves are of similar shape but different magnitude. The performance of the AF120 fans is low when the impedance is very high but their volume flow capacity greatly increases when the airflow impedance falls below medium levels.
The SP120 Performance and Quiet Edition
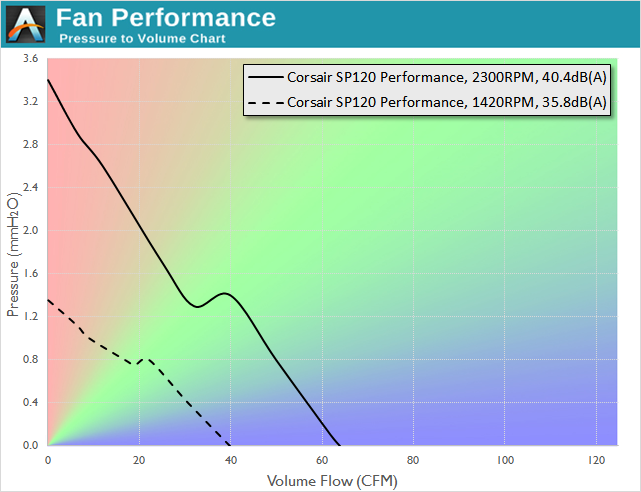
As we move onto the Static Pressure line of fans, featuring fewer but wider fan blades (only 7 vs 11), the expectations lie in higher airflow in high-impedance (dense liquid cooler) scenarios. First up, the Performance model at 12V and 7V:
The Quiet model has reduced fan speeds, which gives a very different graph:
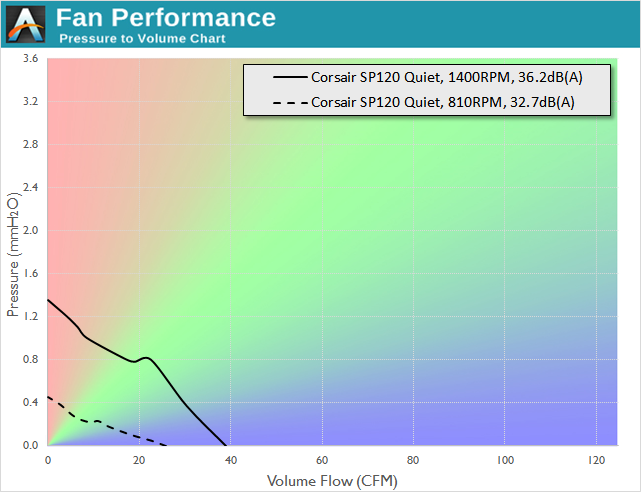
The performance of the SP120 is obviously much different than the AF120, as expected, but is also very different from the performance of the SP140 LED as well. The Performance Edition of the SP120 has an outrageous maximum speed of 2300 RPM and our instruments recorded an outstanding static pressure of 3.42 mmH2O at that speed. The curve declines sharply, with the SP120 displaying mediocre airflow gains as the airflow impedance decreases. It also has a significant stall area within the medium airflow impedance region.
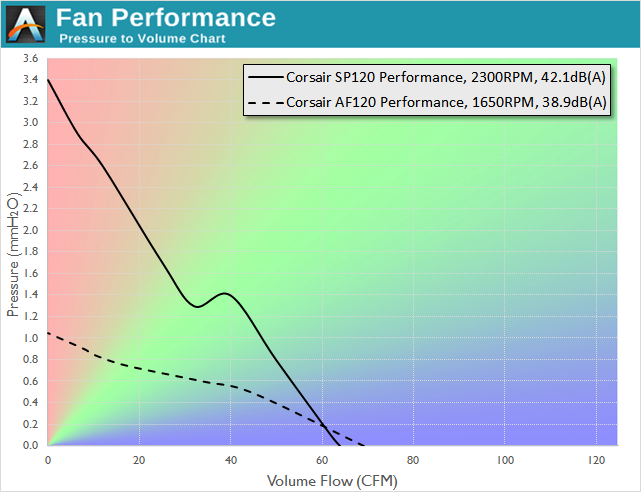
The SP120 Perfomance and AF120 Performance Comparison
As the speed of the SP120 Performance Edition at 7 Volts and the maximum speed of the SP120 Quiet Edition coincide, it can be noticed that the two fans have an almost identical performance curve when operating at the same speed. This is natural as only the rotational speed of the fans differs, the design of the fan itself is identical. But when we compare the SP120 and AF120 variants to each other, we get the following (again, at 12V and 7V)
And in the Quiet versions (note, different axes):
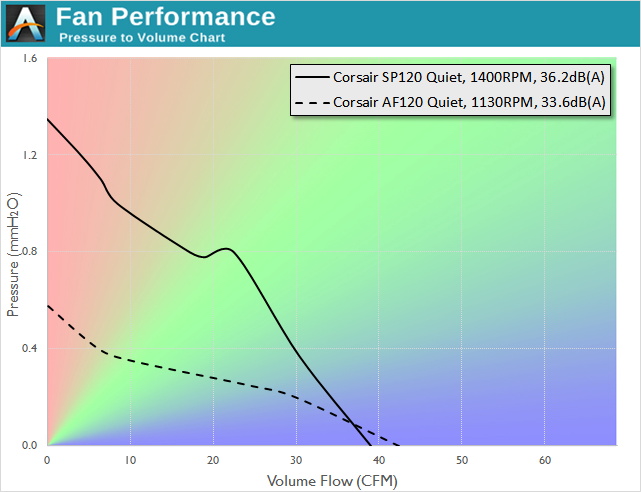
The above two comparisons between the Performance and Quiet versions of the SP120 and AF120 respectively are somewhat unfair. From just a quick look at the graphs, it appears that the SP120 outperforms the AF120 under almost any conditions when both fans are operating at their maximum stock speeds. That however is not correct, as the SP120 versions have a much higher top speed are are in both cases louder. With both the AF120 and the SP120 running at the same speed (and similar noise profiles) we got the following performance curves.
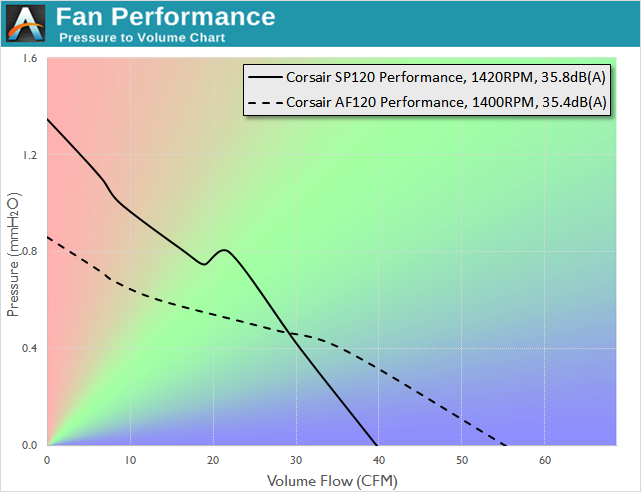
With both fans running at the same speed, the advantages and disadvantages of each design become more apparent. The AF120 provides higher air volume flow in low airflow impedance setups while the SP120 can maintain higher air volume flow levels when the airflow impedance is high. Strangely, even though the SP120 is moving considerably less air while entirely unobstructed, it generates about the same level of noise as the AF120. We can only assume that the large blades of the SP120 generate a very turbulent air flow.


92 Comments
View All Comments
DanNeely - Wednesday, November 25, 2015 - link
A suggestion for when you've got data on more fans. Since the scales on the graphs aren't constant; it would be really helpful for comparison if Bench was able to take the datapoints used to generate the performance curves and use them to create a single combined chart for the user selected set of fans/speeds.BurntMyBacon - Tuesday, December 1, 2015 - link
A max and min speed chart also needs to be in there as user selected fan speeds ignore the fact that some fans can spin quicker/slower than others are capable of spinning.Stuka87 - Wednesday, November 25, 2015 - link
My Corsair 380T came with the LED version of the fans and I was not happy with them at all. I ended up changing them out for the Enermax "Batwing" LED fans (which have removable blades for cleaning) which are much quieter but also have better airflow.supastar1568 - Wednesday, November 25, 2015 - link
Very well written write up with lots of good information.Curious, how did you go about increasing/decreasing the air resistance levels for the fans? As an mechanical engineer, I've been reading up on fan curves for work and I believe an adjustable duct type thing is common. I've always been curious to how this part is done.
Also, for anyone interested, the AMCA 210 Standard has lots of good info as well. A quick google search will bring you to the .pdf.
simonpschmitt - Wednesday, November 25, 2015 - link
Hey, nice to see a more in depth review of the matter.Just two suggestions:
First, why are you plotting pressure over volume? Iwould have done it the other way around.
Second, could you measure the impedance (ballpark figures) of some typical obstructions and post photos of them? For example finger guards, one or two tower coolers, typical filter (ideally clean and dirty, would be interessting to see the effect). Just to get a feel for the dimensions involved.
jann5s - Thursday, November 26, 2015 - link
+1EddyKilowatt - Thursday, December 3, 2015 - link
I think a necessary corollary of AT doing such a solid job of reviewing and explaining fan performance, is that they will also (have to) start measuring and publishing flow curves of the things they review that fans get hooked up to. I was mainly thinking of cases and coolers, but you are right, filters and guards qualify as well. Maybe someday that kind of data will be part of the specs that manufacturers publish.rocktober13 - Monday, November 30, 2015 - link
+1 to both suggestionsBurntMyBacon - Tuesday, December 1, 2015 - link
@simonpschmitt: "First, why are you plotting pressure over volume? Iwould have done it the other way around."Typically the controlled variable is X and the measured variable is Y. They are controlling pressure and measuring airflow so typically it would be represented as you state. That said, the data is all there and the author is technically free and correct to use R and W for variables if he chooses as long as the axis' are labeled. Though in the end, I'd just as soon have the author use the typical approach to avoid confusion.
@simonpschmitt: "Second, could you measure the impedance (ballpark figures) of some typical obstructions and post photos of them? For example finger guards, one or two tower coolers, typical filter (ideally clean and dirty, would be interessting to see the effect). Just to get a feel for the dimensions involved."
This. Very this. Also, since the author mentioned "dense radiators", measurements and photos of dense vs sparse radiators.
JanW1 - Wednesday, November 25, 2015 - link
"one Pascal is the pressure required to accelerate 1 kg of mass at a speed of 1 meters per second squared"Looks like you mixed up the definitions of a Newton and a Pascal. One Pascal is the pressure required to exert the force of one Newton per square meter. The square meter disappeared in your definition. I guess you could say "one Pascal is the pressure required to exert on a surface of one square meter the force required to accelerate 1 kg of mass at a speed of 1 meters per second squared".