The Intel 6th Gen Skylake Review: Core i7-6700K and i5-6600K Tested
by Ian Cutress on August 5, 2015 8:00 AM ESTComparing IPC on Skylake: Memory Latency and CPU Benchmarks
The following explanation of IPC has been previously used in our Broadwell review.
Being able to do more with less, in the processor space, allows both the task to be completed quicker and often for less power. While the concept of having devices with multiple cores has allowed many programs to run at once, purely parallel compute such as graphics and most things to run faster, we are all still limited by the fact that a lot of software is still relying on one line of code after another. This is referred to as the serial part of the software, and is the basis for many early programming classes – getting the software to compile and complete is more important than speed. But the truth is that having a few fast cores helps more than several thousand super slow cores. This is where IPC comes in to play.
The principles behind extracting IPC are quite complex as one might imagine. Ideally every instruction a CPU gets should be read, executed and finished in one cycle, however that is never the case. The processor has to take the instruction, decode the instruction, gather the data (depends on where the data is), perform work on the data, then decide what to do with the result. Moving has never been more complicated, and the ability for a processor to hide latency, pre-prepare data by predicting future events or keeping hold of previous events for potential future use is all part of the plan. All the meanwhile there is an external focus on making sure power consumption is low and the frequency of the processor can scale depending on what the target device actually is.
For the most part, Intel has successfully increased IPC every generation of processor. In most cases, 5-10% with a node change and 5-25% with an architecture change with the most recent large jumps being with the Core architecture and the Sandy Bridge architectures, ushering in new waves of super-fast computational power. As Broadwell to Skylake is an architecture change with what should be large updates, we should expect some good gains.
| Intel Desktop Processor Cache Comparison | |||||
| L1-D | L1-I | L2 | L3 | L4 | |
| Sandy Bridge i7 | 4 x 32 KB | 4 x 32 KB | 4 x 256 KB | 8 MB | |
| Ivy Bridge i7 | 4 x 32 KB | 4 x 32 KB | 4 x 256 KB | 8 MB | |
| Haswell i7 | 4 x 32 KB | 4 x 32 KB | 4 x 256 KB | 8 MB | |
| Broadwell i7 (Desktop / Iris Pro 6200) |
4 x 32 KB | 4 x 32 KB | 4 x 256 KB | 6 MB | 128 MB eDRAM |
| Skylake i7 | 4 x 32 KB | 4 x 32 KB | 4 x 256 KB | 8 MB | |
For this test we took Intel’s most recent high-end i7 processors from the last five generations and set them to 3.0 GHz and with HyperThreading disabled. As each platform uses DDR3, we set the memory across each to DDR3-1866 with a CAS latency of 9. For Skylake we also run at DDR4-2133 C15 as a default speed. From a pure cache standpoint, here is how each of the processors performed:
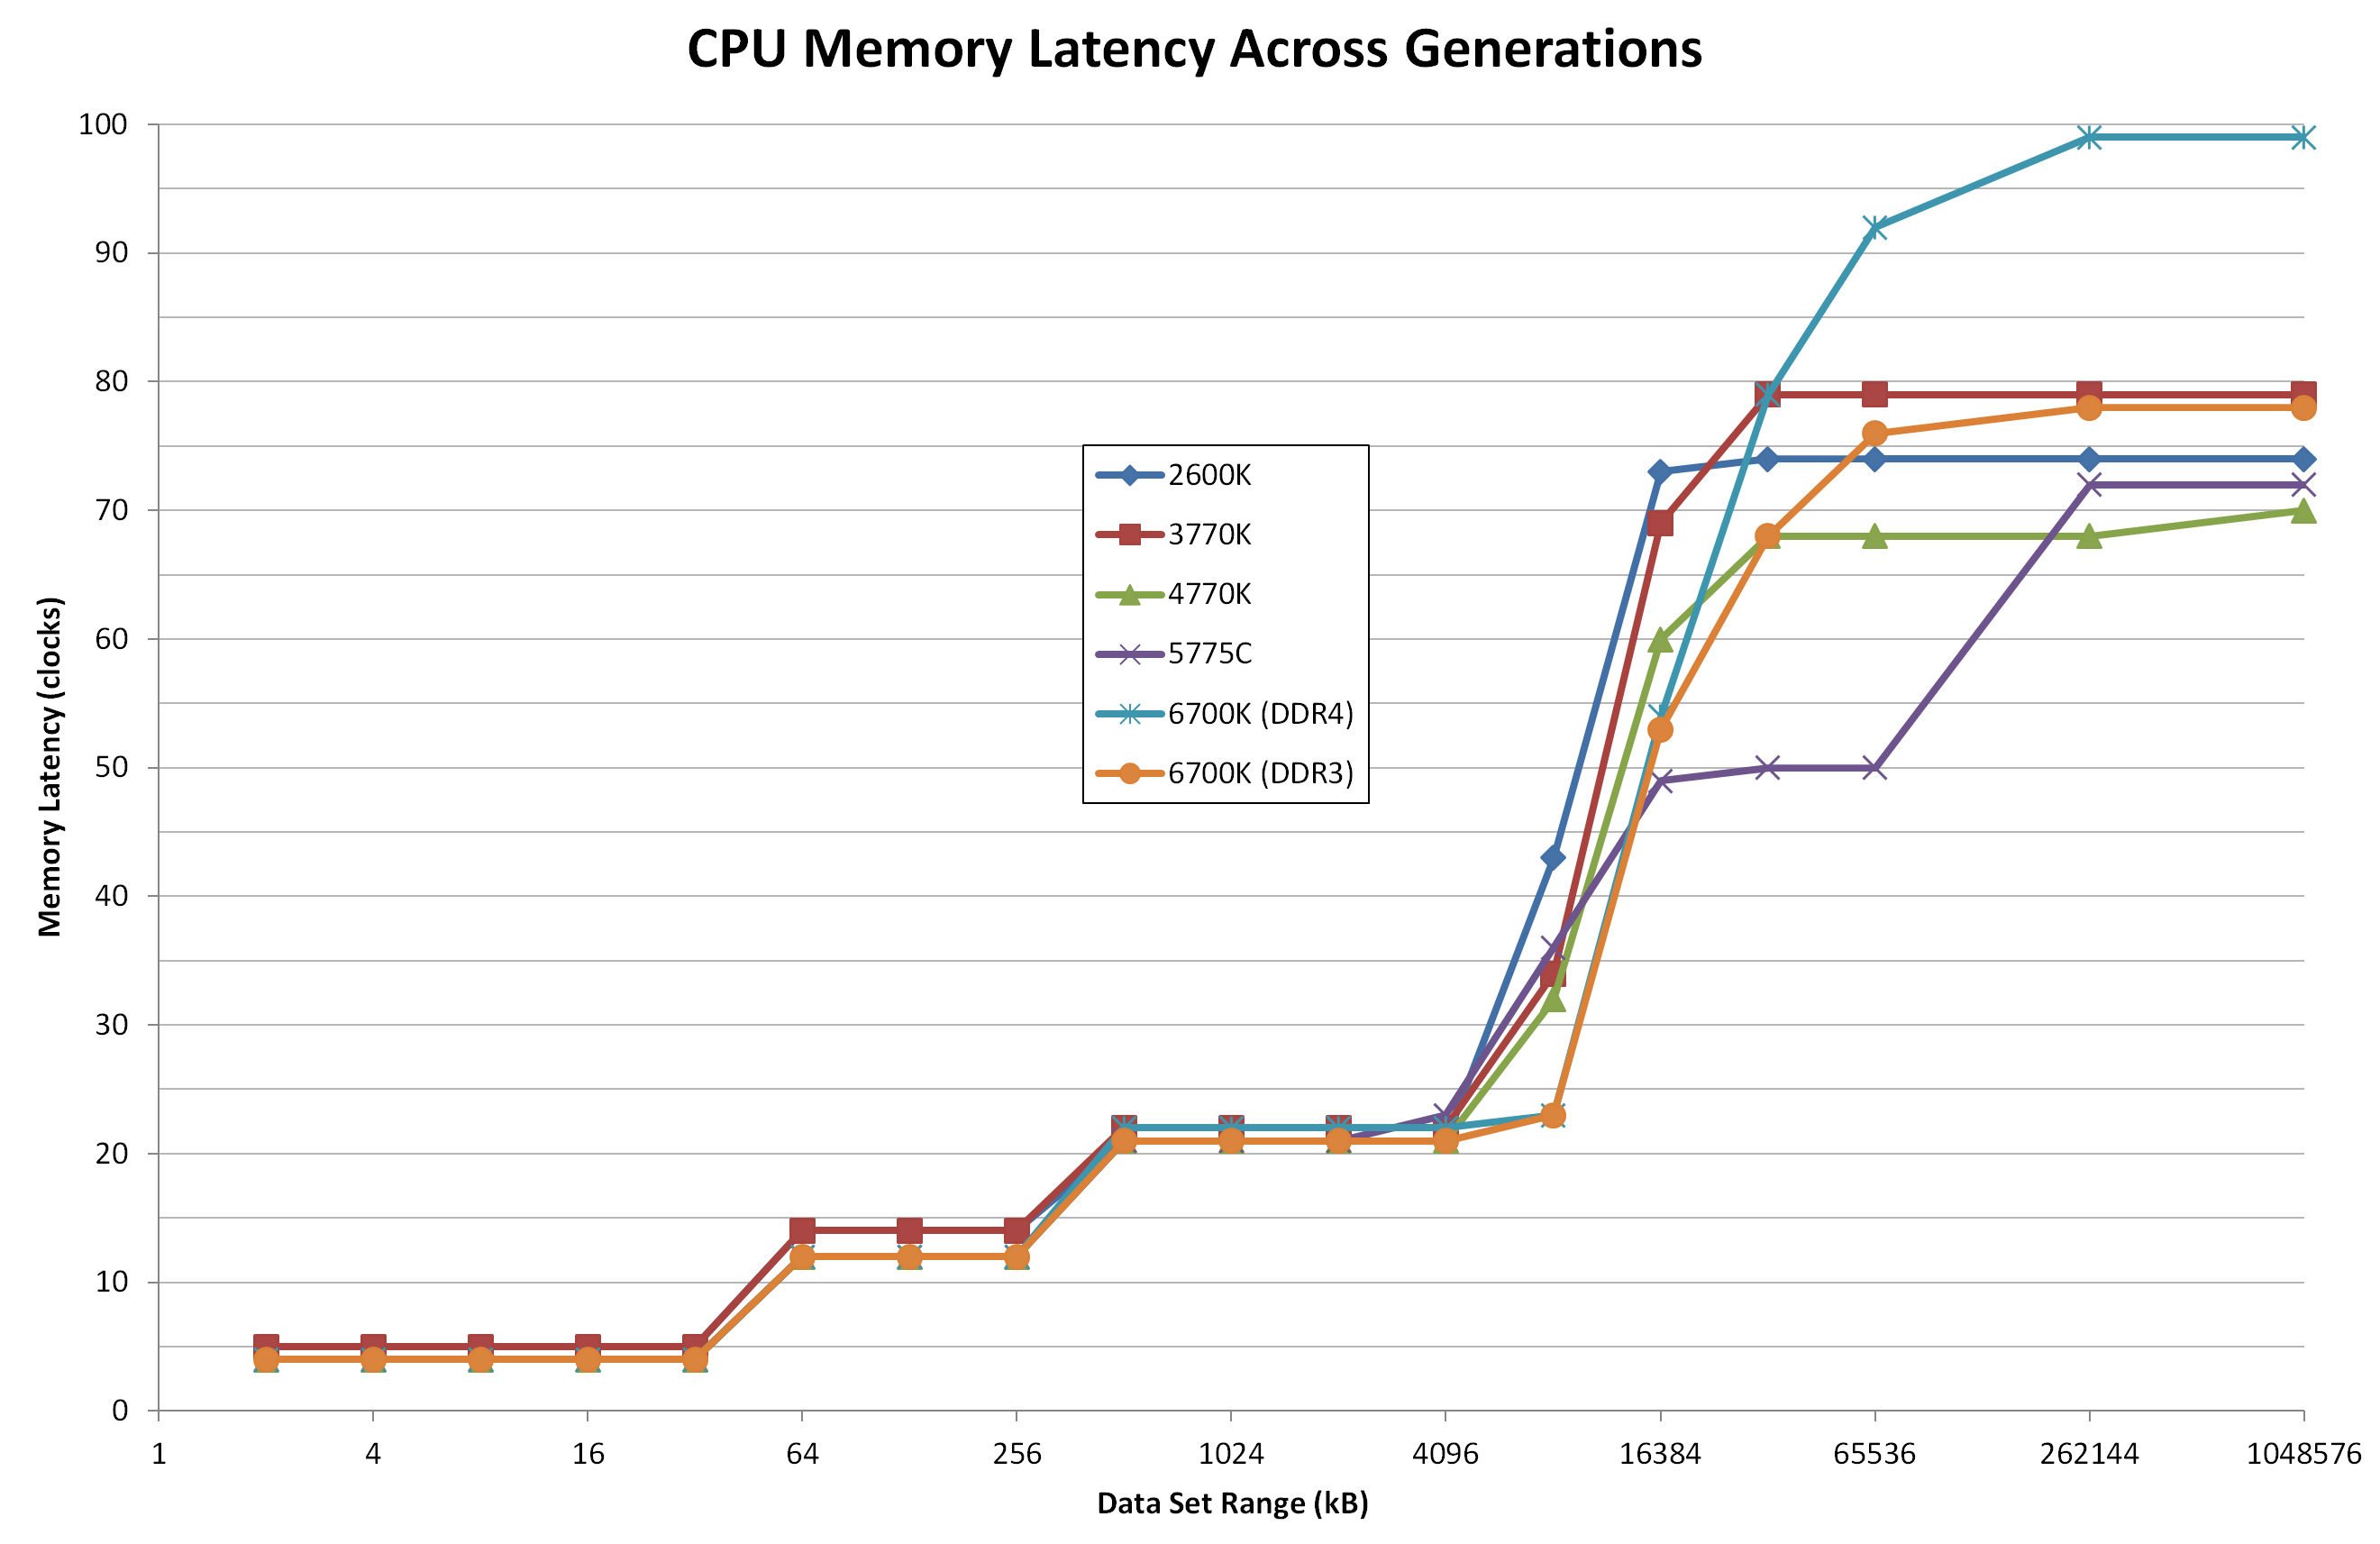
If we ignore Broadwell and its eDRAM, the purple line, especially from 16MB to 128MB, both of the lines for Skylake stay at the low latencies until 4MB. Between 4MB and 8MB, the cache latency still seems to be substantially lower than that of the previous generations.
Normally in this test, despite all of the CPUs having 8MB of L3 cache, the 8MB test has to spill out to main memory because some of the cache is already filled. If you have a more efficient caching and pre-fetch algorithm here, then the latency ‘at 8MB’ will be lower. So an update for Skylake, as shown in both the DDR4 and DDR3 results, is that the L3 caching algorithms or hardware resources have been upgraded.
At this point I would also compare the DDR3 to DDR4 results on Skylake above 16MB. It seems that the latency in this region is a lot higher than the others, showing nearly 100 clocks as we move up to 1GB. But it is worth remembering that these tests are against a memory clock of 2133 MHz, whereas the others are at 1866 MHz. As a result, the two lines are more or less equal in terms of absolute time, as we would expect.
Here are the generational CPU results at 3.0 GHz:
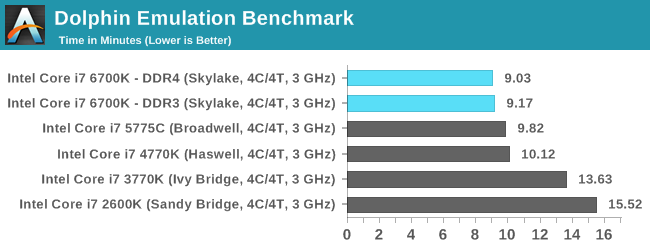
Dolphin Benchmark: link
Many emulators are often bound by single thread CPU performance, and general reports tended to suggest that Haswell provided a significant boost to emulator performance. This benchmark runs a Wii program that raytraces a complex 3D scene inside the Dolphin Wii emulator. Performance on this benchmark is a good proxy of the speed of Dolphin CPU emulation, which is an intensive single core task using most aspects of a CPU. Results are given in minutes, where the Wii itself scores 17.53 minutes.
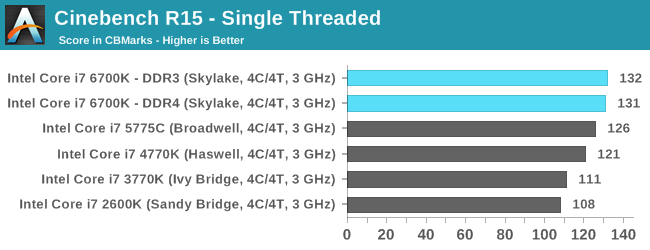
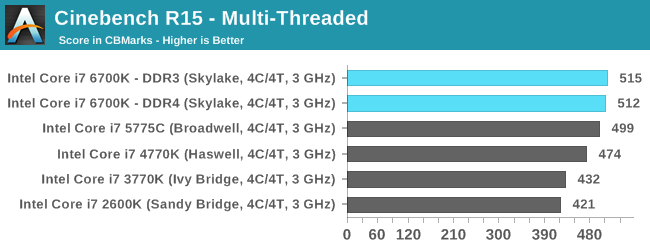
Cinebench R15
Cinebench is a benchmark based around Cinema 4D, and is fairly well known among enthusiasts for stressing the CPU for a provided workload. Results are given as a score, where higher is better.
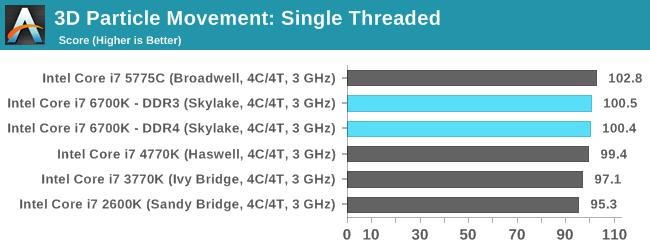
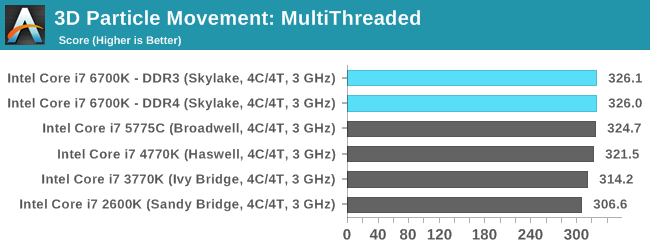
Point Calculations – 3D Movement Algorithm Test: link
3DPM is a self-penned benchmark, taking basic 3D movement algorithms used in Brownian Motion simulations and testing them for speed. High floating point performance, MHz and IPC wins in the single thread version, whereas the multithread version has to handle the threads and loves more cores. For a brief explanation of the platform agnostic coding behind this benchmark, see my forum post here.
Compression – WinRAR 5.0.1: link
Our WinRAR test from 2013 is updated to the latest version of WinRAR at the start of 2014. We compress a set of 2867 files across 320 folders totaling 1.52 GB in size – 95% of these files are small typical website files, and the rest (90% of the size) are small 30 second 720p videos.
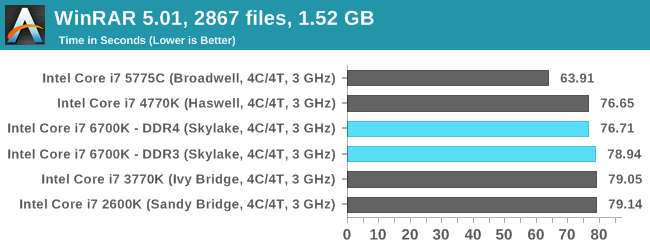
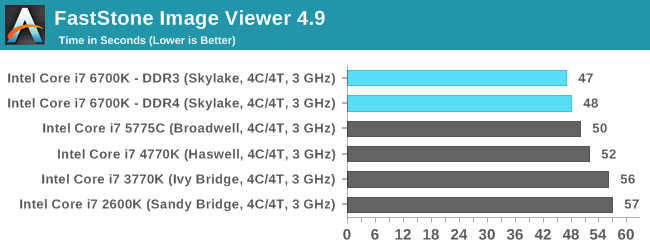
Image Manipulation – FastStone Image Viewer 4.9: link
Similarly to WinRAR, the FastStone test us updated for 2014 to the latest version. FastStone is the program I use to perform quick or bulk actions on images, such as resizing, adjusting for color and cropping. In our test we take a series of 170 images in various sizes and formats and convert them all into 640x480 .gif files, maintaining the aspect ratio. FastStone does not use multithreading for this test, and thus single threaded performance is often the winner.
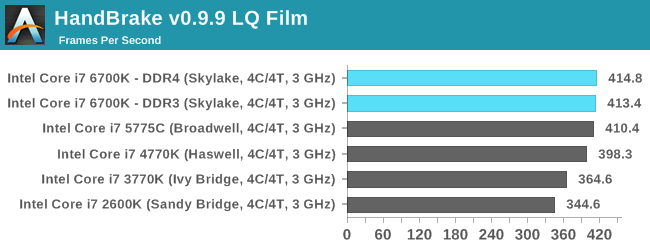
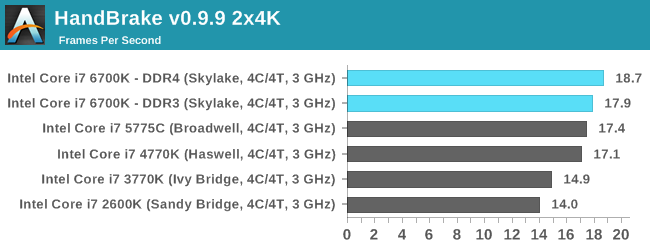
Video Conversion – Handbrake v0.9.9: link
Handbrake is a media conversion tool that was initially designed to help DVD ISOs and Video CDs into more common video formats. The principle today is still the same, primarily as an output for H.264 + AAC/MP3 audio within an MKV container. In our test we use the same videos as in the Xilisoft test, and results are given in frames per second.
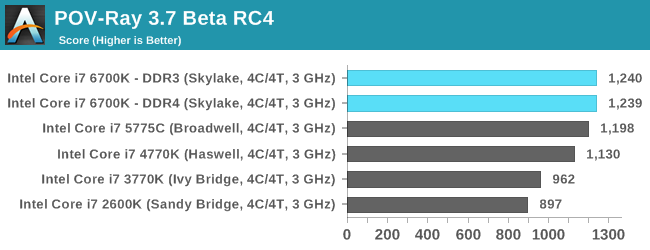
Rendering – PovRay 3.7: link
The Persistence of Vision RayTracer, or PovRay, is a freeware package for as the name suggests, ray tracing. It is a pure renderer, rather than modeling software, but the latest beta version contains a handy benchmark for stressing all processing threads on a platform. We have been using this test in motherboard reviews to test memory stability at various CPU speeds to good effect – if it passes the test, the IMC in the CPU is stable for a given CPU speed. As a CPU test, it runs for approximately 2-3 minutes on high end platforms.
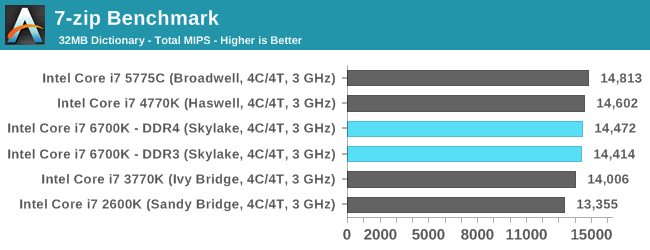
Synthetic – 7-Zip 9.2: link
As an open source compression tool, 7-Zip is a popular tool for making sets of files easier to handle and transfer. The software offers up its own benchmark, to which we report the result.
Overall: CPU IPC
Removing WinRAR as a benchmark because it gets boosted by the eDRAM in Broadwell, we get an interesting look at how each generation has evolved over time. Taking Sandy Bridge (i7-2600K) as the base, we have the following:
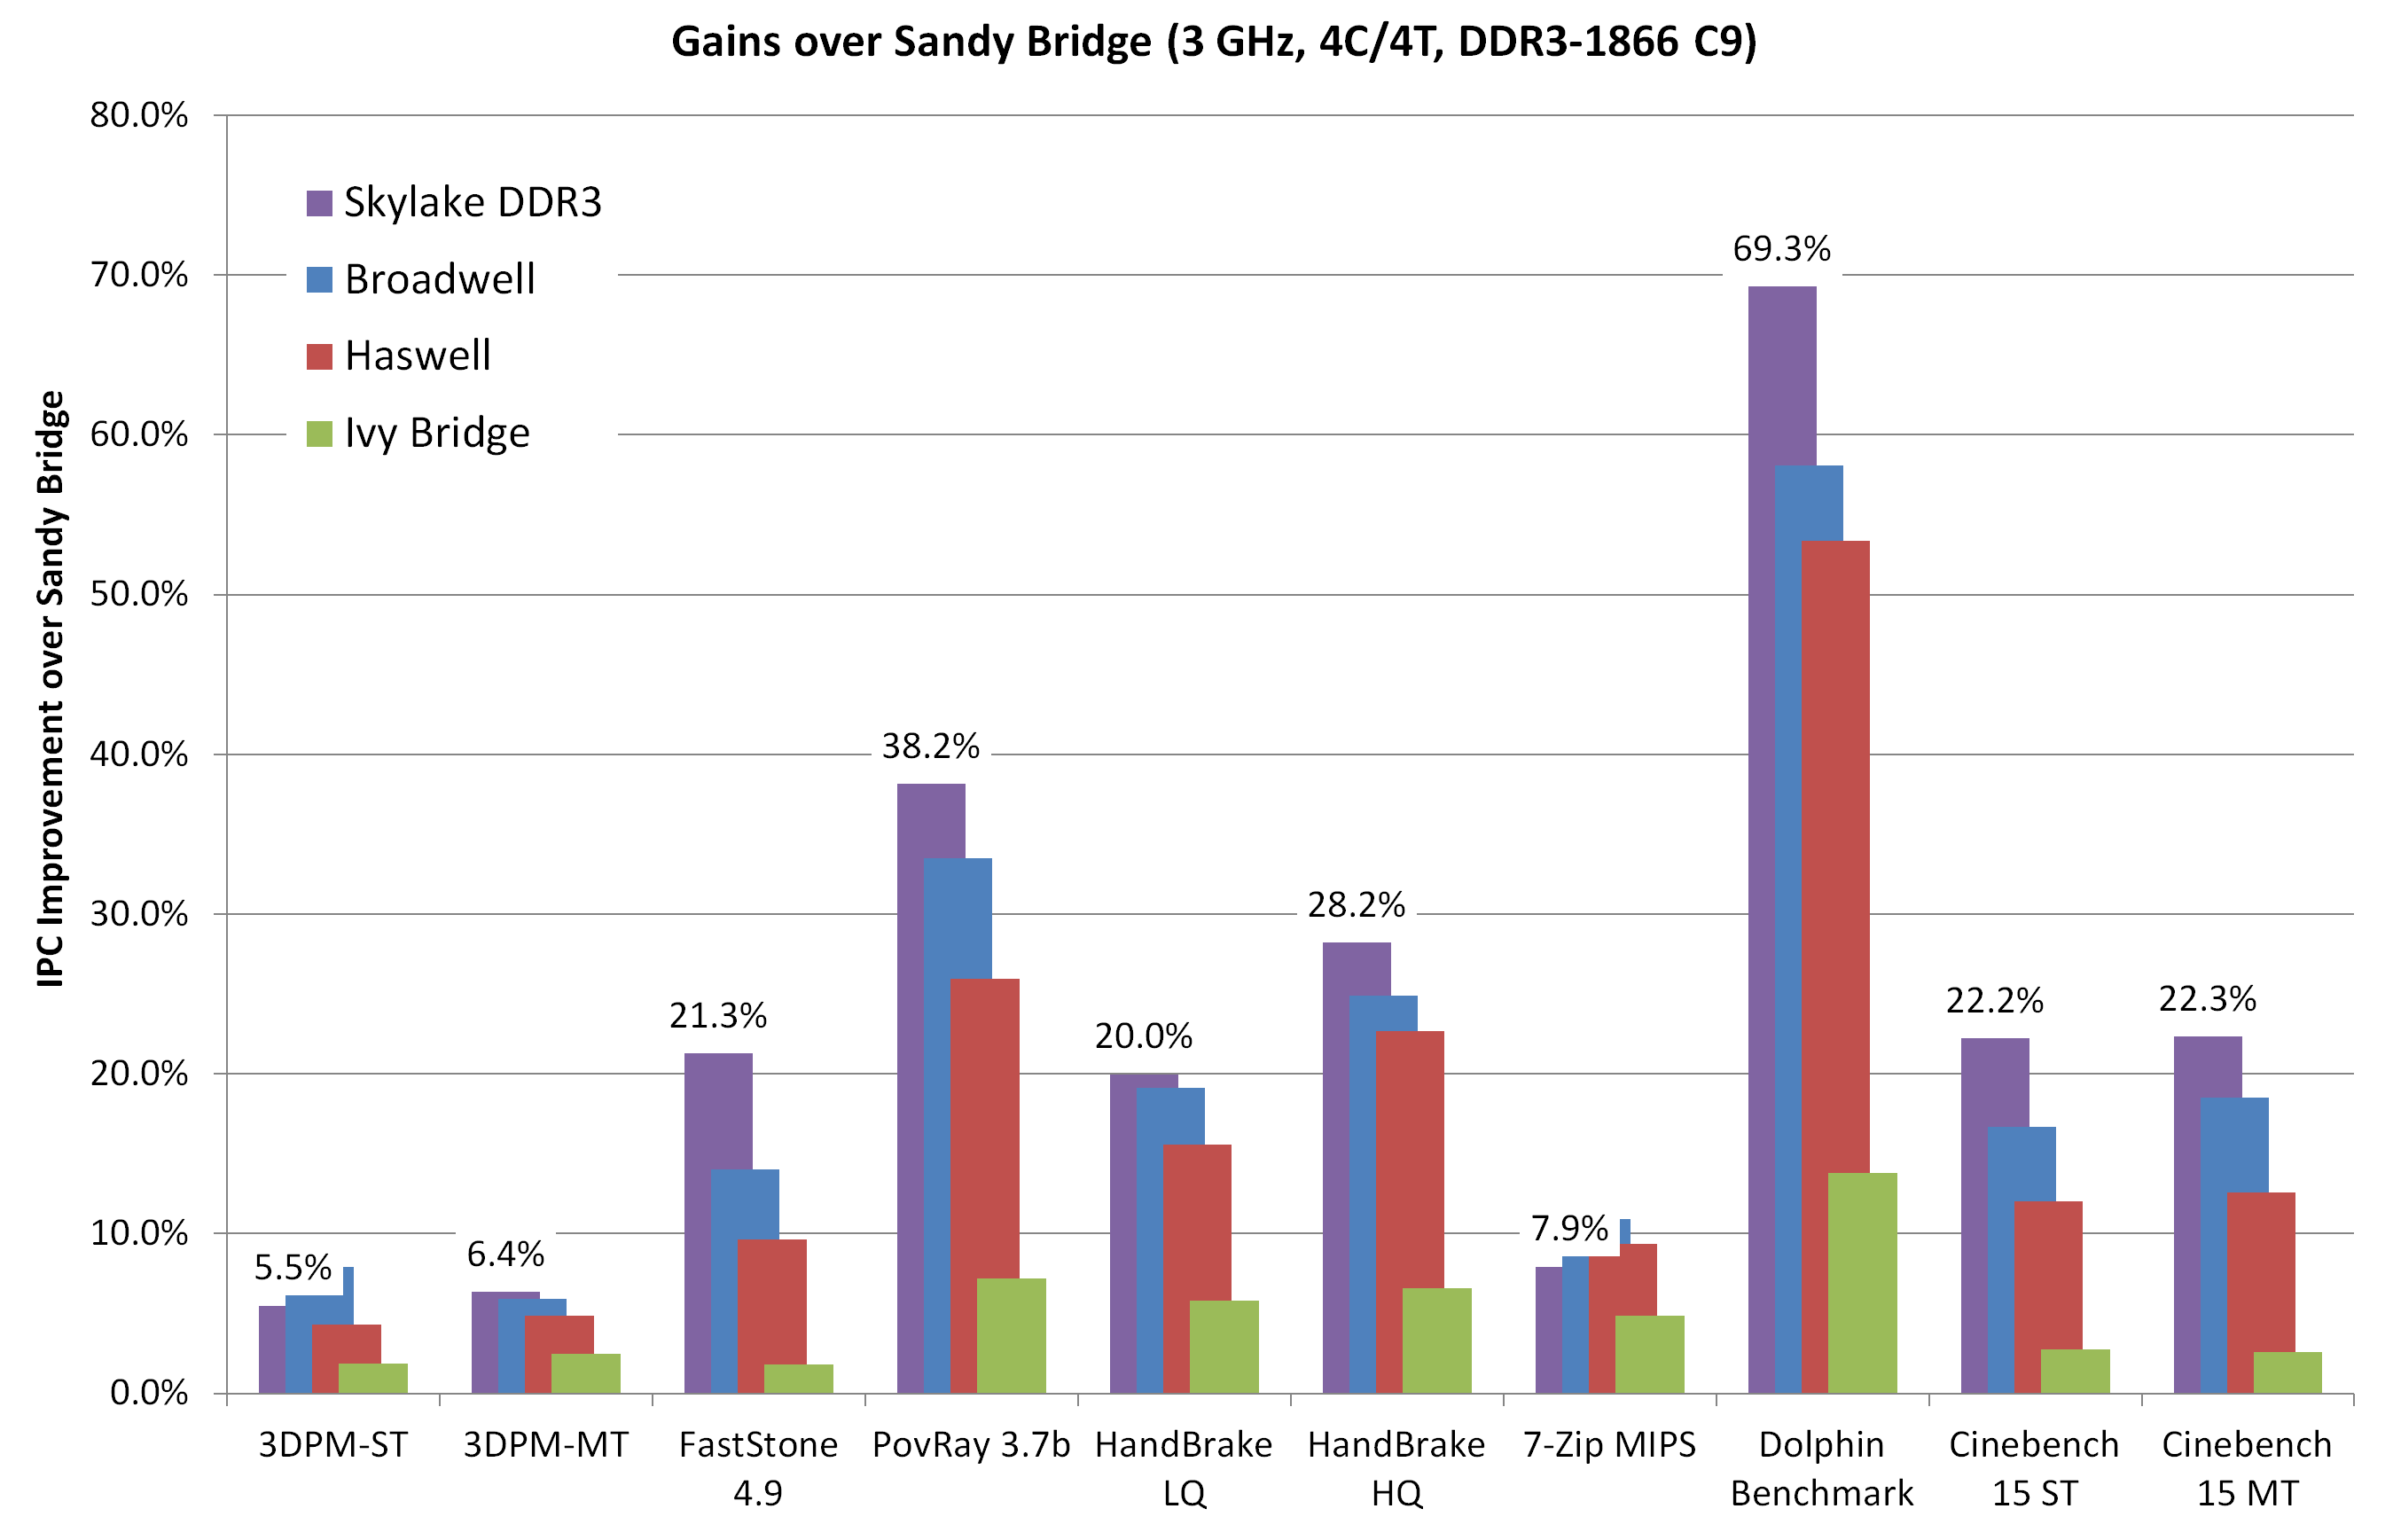
From a pure upgrade perspective, the IPC gain here for Skylake does not look great. In fact in two benchmarks the IPC seems to have decreased – 3DPM in single thread mode and 7-ZIP. What makes 3DPM interesting is that the multithread version still has some improvement at least, if only minor. This difference between MT and ST is more nuanced than first appearances suggest. Throughout the testing, it was noticeable that multithreaded results seem to (on average) get a better kick out of the IPC gain than single threaded. If this is true, it would suggest that Intel has somehow improved its thread scheduler or offered new internal hardware to deal with thread management. We’ll probably find out more at IDF later in the year.
If we adjust this graph to show generation to generation improvement and include the DDR4 results:
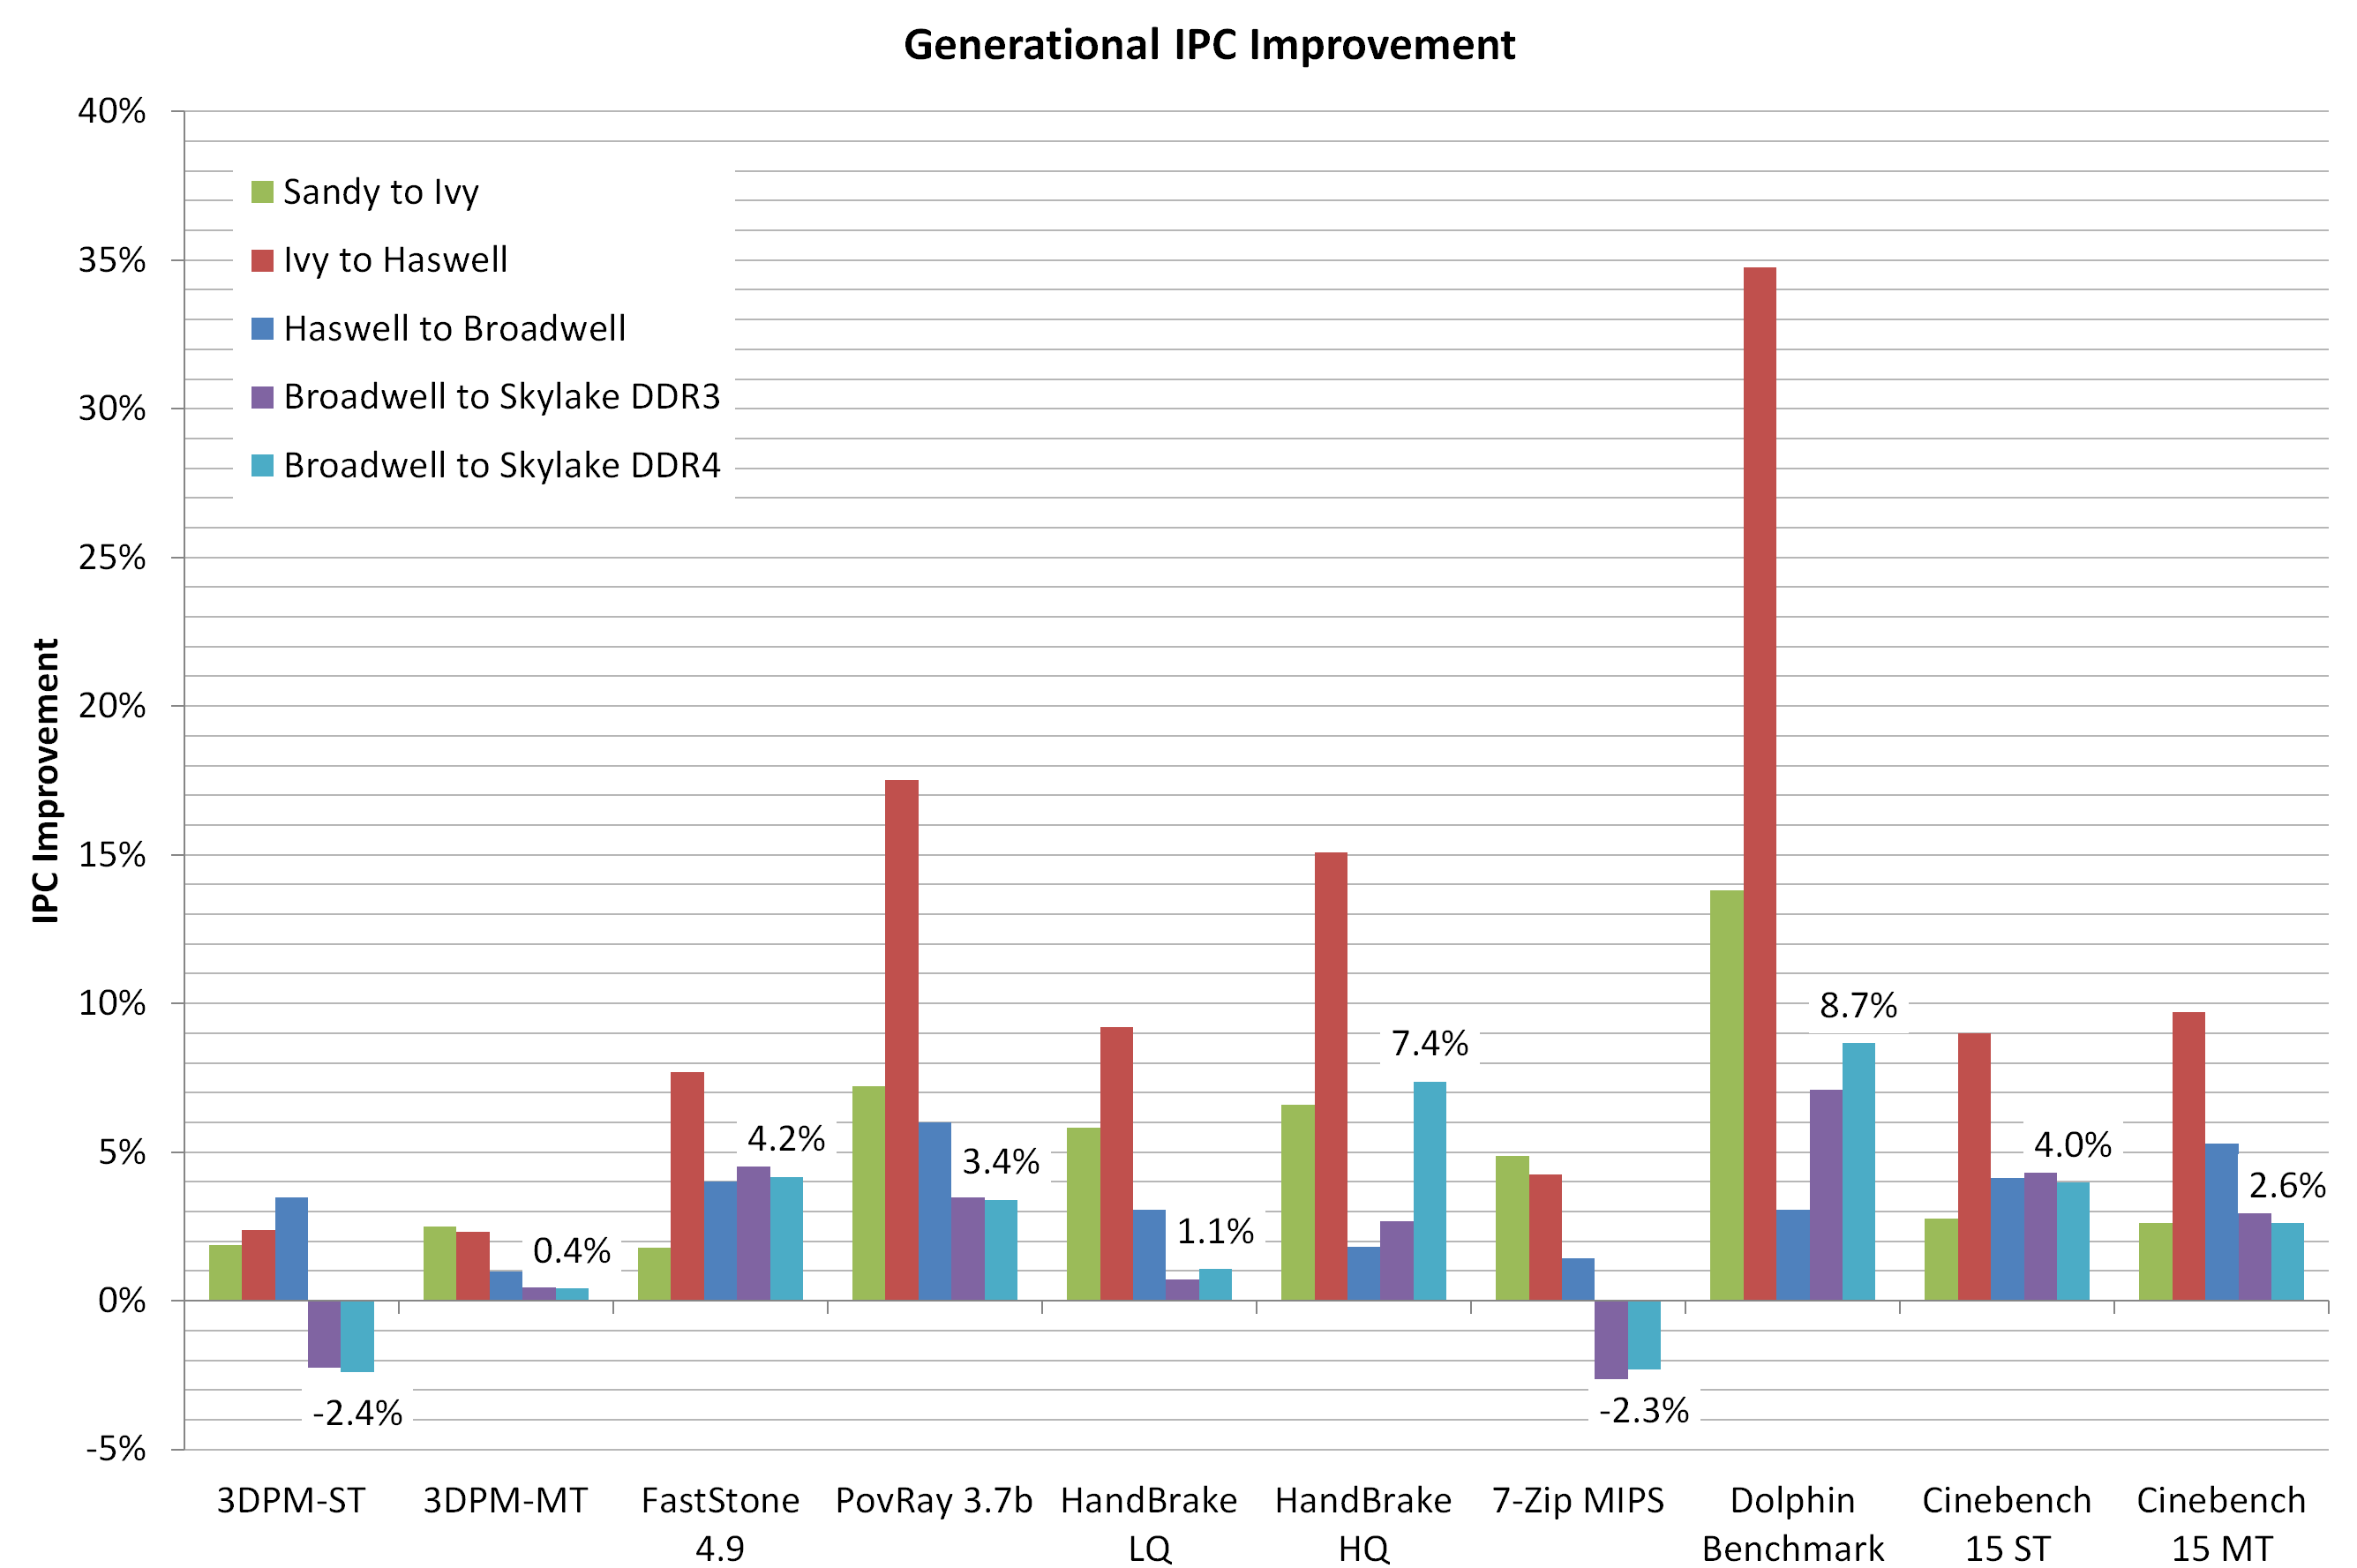
This graph shows that:
Sandy Bridge to Ivy Bridge: Average ~5.8% Up
Ivy Bridge to Haswell: Average ~11.2% Up
Haswell to Broadwell: Average ~3.3% Up
Broadwell to Skylake (DDR3): Average ~2.4% Up
Broadwell to Skylake (DDR4): Average ~2.7% Up
Oh dear. Typically with an architecture update we see a bigger increase in performance than 2.7% IPC. Looking at matters purely from this perspective, Skylake does not come out well. These results suggest that Skylake is merely another minor upgrade in the performance metrics, and that a clock for clock result compared to Broadwell is not favorable. However, consider that very few people actually invested in Broadwell. If anything, Haswell was the last major mainstream processor generation that people actually purchased, which means that:
Haswell to Skylake (DDR3): Average ~5.7% Up.
This is more of a bearable increase, and it takes advantage of the fact that Broadwell on the desktop was a niche focused launch. The other results in the review will be interesting to see.


477 Comments
View All Comments
Chaser - Thursday, August 6, 2015 - link
Now even more pleased with my 5820K rig I bought two months ago.Artas1984 - Thursday, August 6, 2015 - link
I disagree with the statement that Skylake should now be a definitive replacement for Sandy Bridge.It's like saying that your game runs at 200 FPS slowly, so now you have to upgrade to get 250 FPS. Of course i am not talking about games directly, it's a metaphor, but you get the point.
Also with the way how fast computer electronics develop, people are "forced" to up their quality of life at the expense of buying more important things in this short fu+kin life. Just because there are things manufactured does not mean you have to live someone else's life! I for one give a shit about smart phones and will never use them anyway, i will never use 3D googles or monitors in movies or gaming just because they exist.
On top of that:
AMD's chips have not yet reached the performance levels of Sandy Bridge. The piece of crap FX 9590 falls behind 2600K in every multi-threaded bench and get's beaten by 2500K in every game!
Oxford Guy - Friday, August 7, 2015 - link
Take a look at this: http://www.techspot.com/review/1006-the-witcher-3-...Oxford Guy - Friday, August 7, 2015 - link
It seems there's a reason why Anandtech never puts the FX chips into its charts and instead chooses the weak APUs... Is it because the FX is holding its own nicely now that games like Witcher 3 are finally using all of its threads?Oxford Guy - Friday, August 7, 2015 - link
A 2012 chip priced as low as $100 (8320E) with a $40 motherboard discount (combo with UD3P set me back a total of $133.75 with tax from Microcenter a few months ago) is holding its own with i7 chips when overclocked, and at least i5s. Too bad for AMD that they released that chip so many years before the gaming industry would catch up. Imagine if it was on 14nm right now instead of 32.boeush - Friday, August 7, 2015 - link
Oh yeah, real impressive: FX 9590 @ 4.7 Ghz is a whole 1% faster than the 4 year old i5 2500K @ 3.3 Ghz. I'm blown away... Particularly since the 9590 overclocks to maybe 5 Ghz if you are lucky, at 200 W with water cooling, while the 2500K overclocks to 4.5 Ghz on air. And it's not as if that game isn't GPU limited like most of the others...Fanboi, please.
Oxford Guy - Friday, August 7, 2015 - link
You're missing the point completely, but that's OK. Anyone who looks at the charts can figure it out for themselves, as the reviewer noted. Also, if you would have taken the time to look at that page before spouting off nonsense, you would have noticed that a high clock rate is not necessary for that chip to have decent performance -- negating the entire argument that extreme overclocking is needed. The game clearly does a better job of load balancing between the 8 threads than prior games have, resulting in a much more competitive situation for the FX (especially the 8 thread FX).As for being a fanboy. A fanboy is someone who won't put in an FX and instead just puts in a bunch of weaker APUs, the same thing that has been happening in multiple reviews. Name-calling is not a substitute for actually looking at the data I cited and responding to it accurately.
Markstar - Friday, August 7, 2015 - link
I totally agree - looking at the numbers it is very obvious to me that upgrading is not worth it unless you are heavily into video encoding. Especially for gaming, spending the money on a better graphic card is clearly the better investment as the difference is usually between 1-3%.My i5-2500K is "only" at 4.5GHz and I don't see myself upgrading anytime soon, though I have put some money aside for exactly that purpose.
sonny73n - Friday, August 7, 2015 - link
I don't agree with your bold statement: "Sandy Bridge, your time is up". Why do you even compare Skylake and SB K series at their stock speeds? I have my i5-2500K at 4.2GHz now with Prime95 stress test max temp at 64C on air cool. I can easily clock it to 4.8GHz and I have so but never felt the need for that high of clocks. With ~25% overall system improvement in benchmarks and only 3 to 5% in games, this upgrade doesn't justify the cost of a new MB, DDR4 and CPU. I'm sure a few people can utilize this ~25% improvement but I doubt it would make any difference for me on my daily usage. Secondly, Skylake system alone can't run games. Why upgrade my SB when it can run all the games with Evga 780 that I wanted it to? For gamers, wouldn't it be a lot wiser and cheaper to spend on another 780 instead of spending on a new system? And all that upgrade cost is just for 3 to 5% improvement in games? Sorry, I'll pass.MrSpadge - Friday, August 7, 2015 - link
Ian, when testing the memory scaling or comparing DDR3 and 4 you shouldn't underclock the CPUs. Fixing their frequency is good, but not reducing it. The reason: at lower clock speeds the throughput is reduced, which in turn reduces the need for memory bandwidth. At 3 vs. 4 GHz we're already talking about approximately 75% the bandwidth requirement that a real user would experience. In this case memory latency still matters, of course, but the advantage of higher bandwidth memory is significantly reduced.