Analyzing Intel Core M Performance: How 5Y10 can beat 5Y71 & the OEMs' Dilemma
by Brett Howse & Ian Cutress on April 8, 2015 8:00 AM ESTPCMark 8 Home Results
PCMark 8 Home is a much different workload than Cinebench. Cinebench thrives on sustained performance over the duration of the workload, with the CPU utilization staying around 100% for the duration. While an important metric, most people do not use their computers like that in their day to day lives, so Futuremark has crafted the PCMark suite to perform tasks which are more akin to what the average person will do in a day. Home includes workloads for web browsing, writing, gaming, photo editing, and video chat, and the nature of these loads mean that there is a lot more burst performance needed, so the race to sleep mentality of the Core M can be more effective in this scenario.
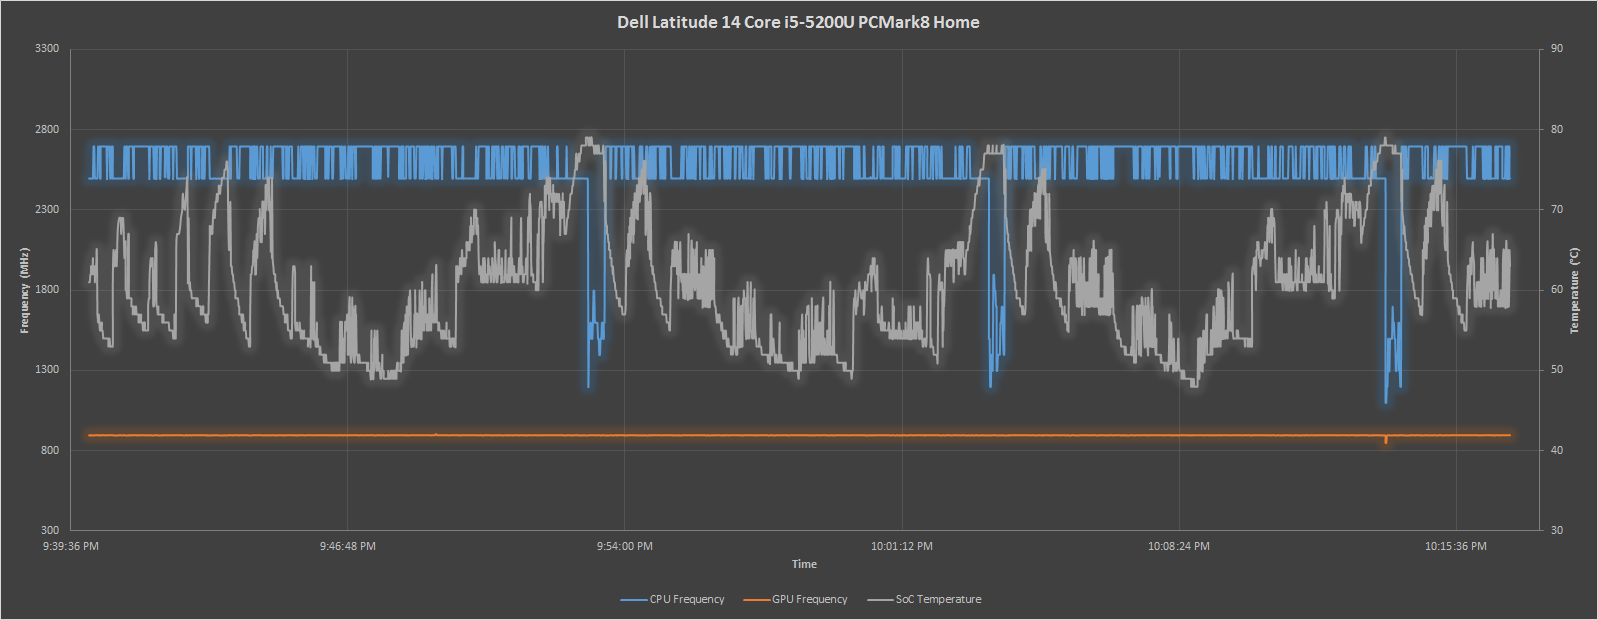
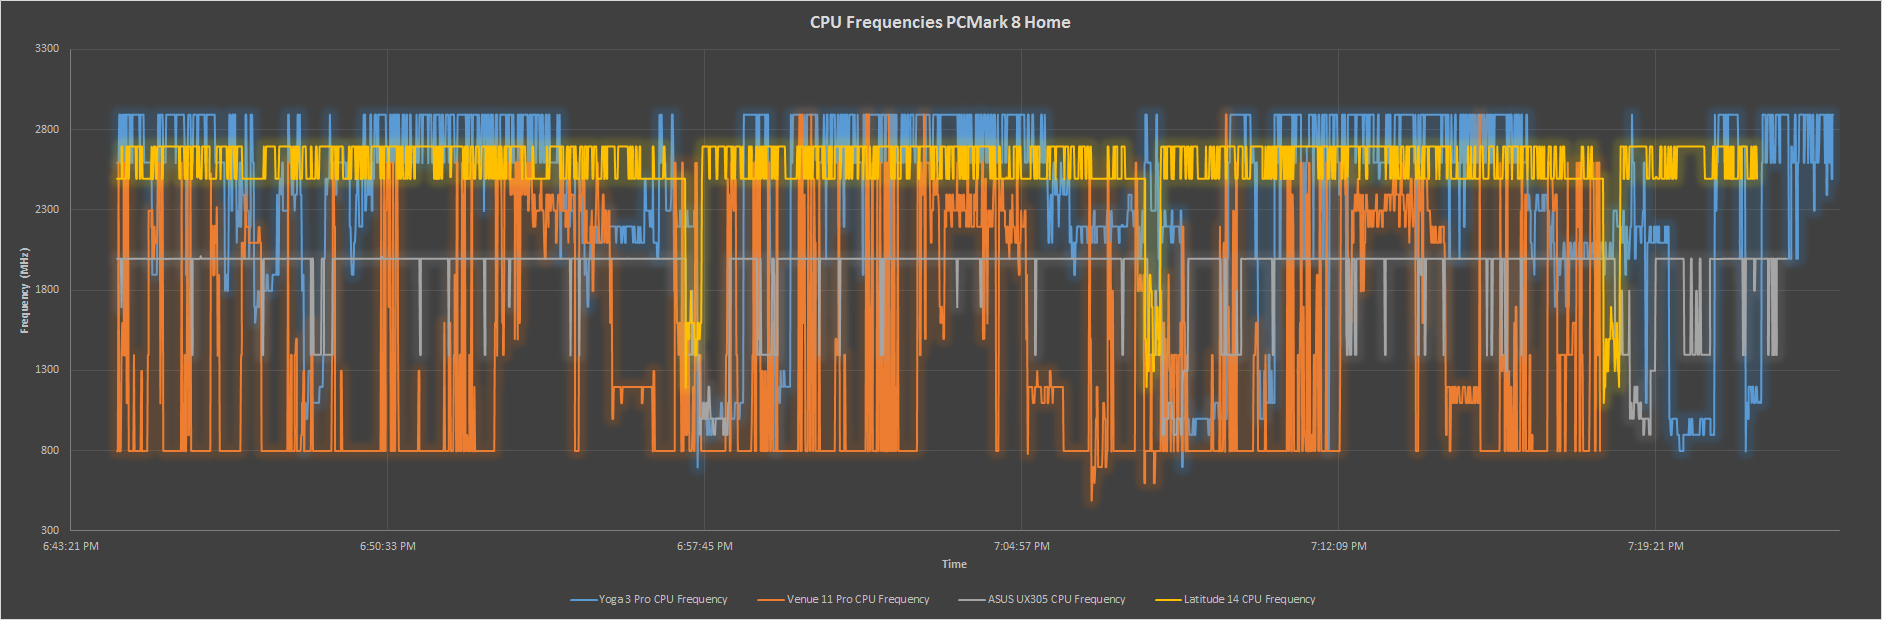
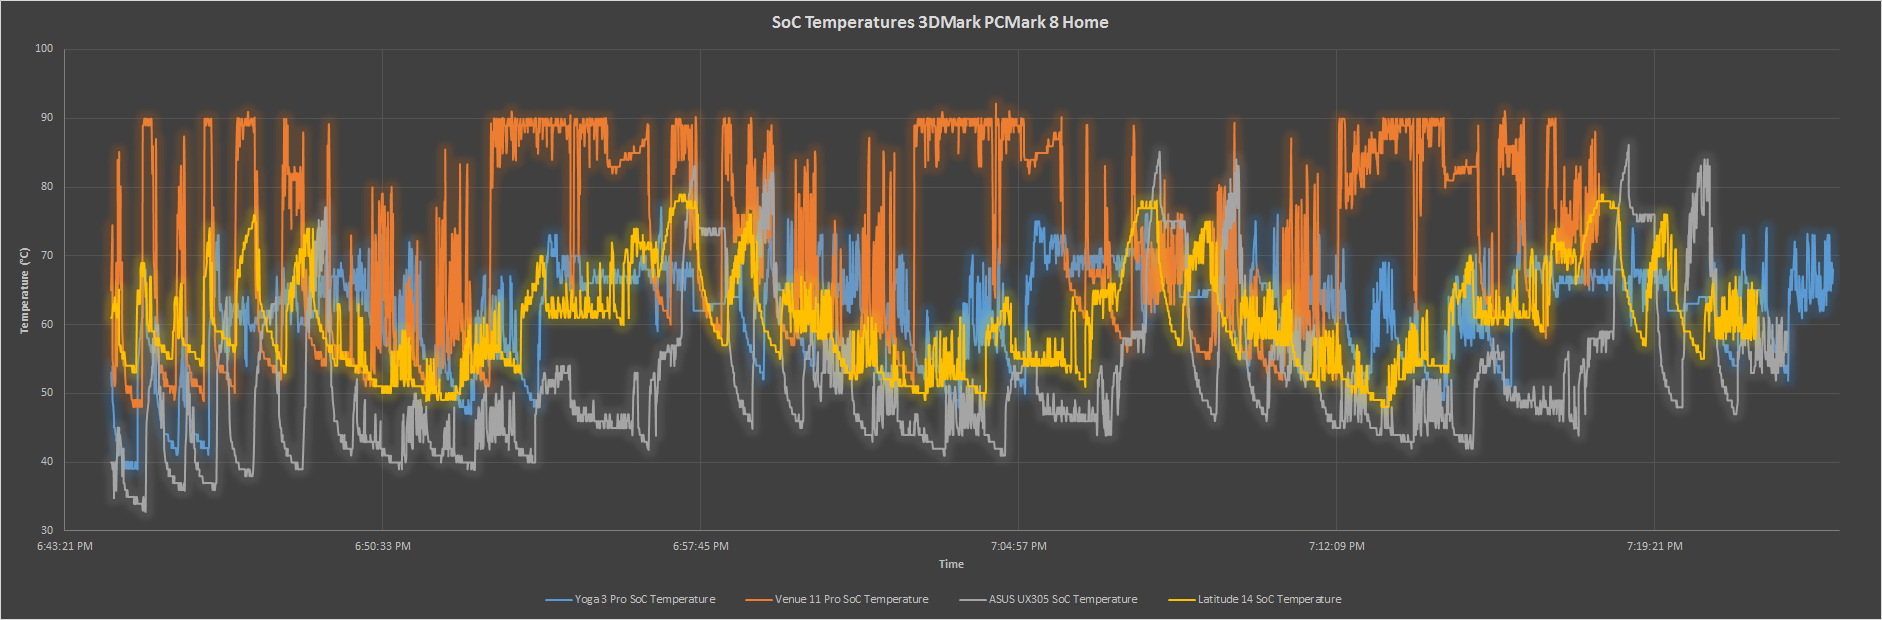
The burst nature of this benchmark is apparent just looking at the Core i5. No longer is the CPU frequency consistent across the board, and the temperatures ramp up and down as the work is performed and finished. Even more pronounced is the Dell tablet, which spikes up and down from its maximum temperature, but at the same time ramping clock speeds up quite high as well. The incredible cooling of the ASUS UX305 passive solution makes a big difference here, with the UX305 being able to maintain almost its maximum frequency for the duration of this benchmark. The Yoga 3 Pro really shines here though, with it maintaining quite high speeds for almost the entire duration of the benchmark.
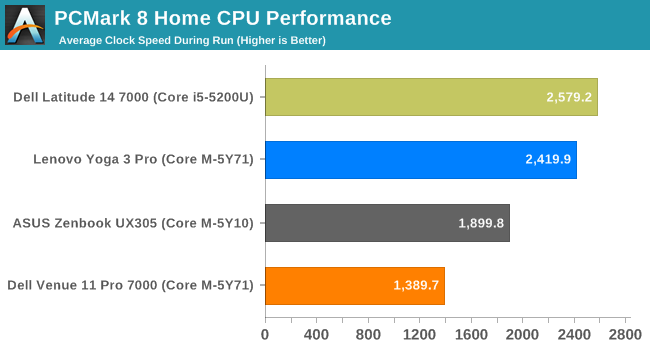
Average CPU frequencies on the other hand show an unexpected disparity between the results we saw above and what the averages end up being. It's the cool Yoga 3 Pro that holds the highest average clockspeeds, followed by the UX305, and finally bringing up the rear is the Venure 11 Pro 7000.
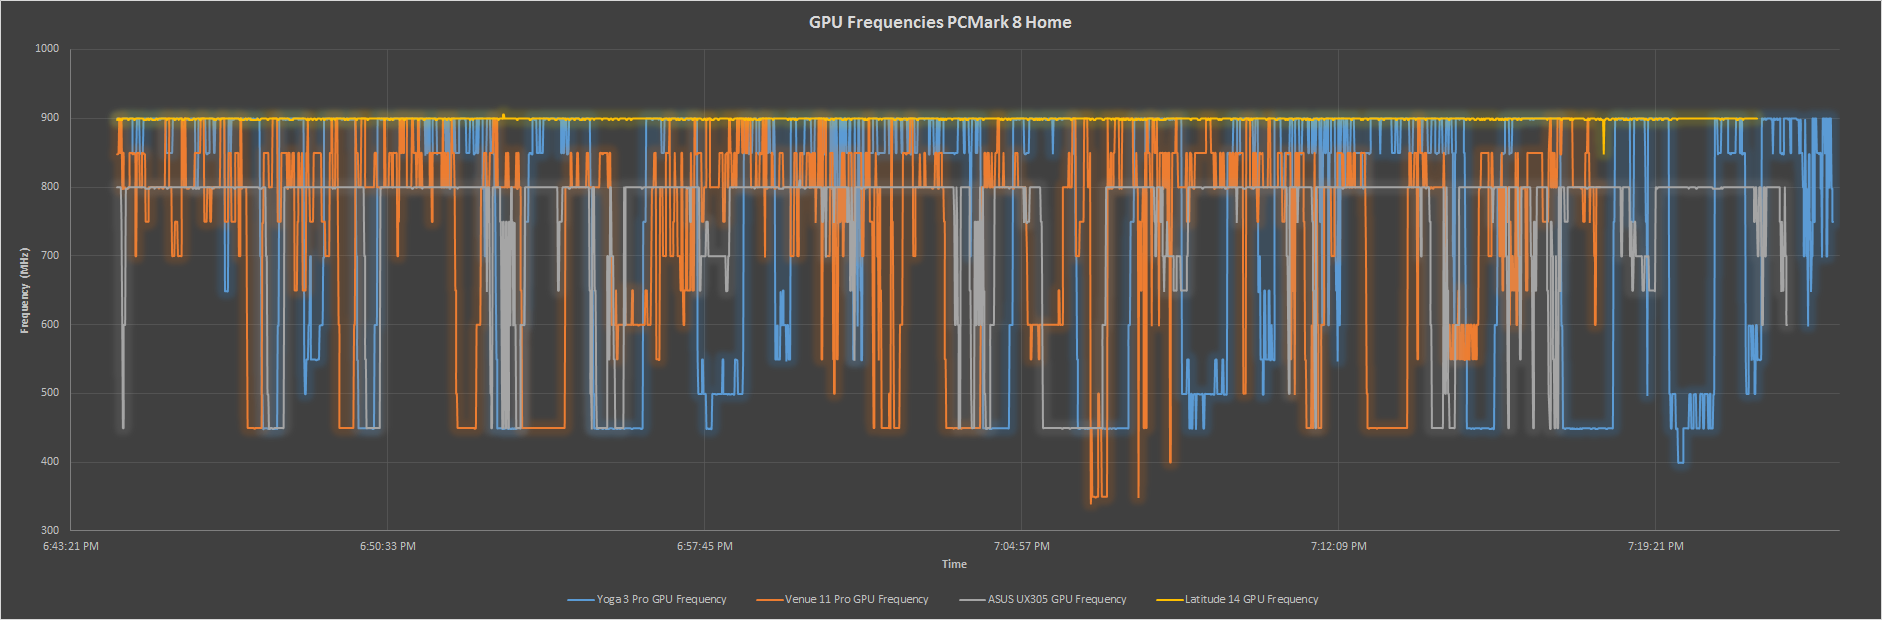
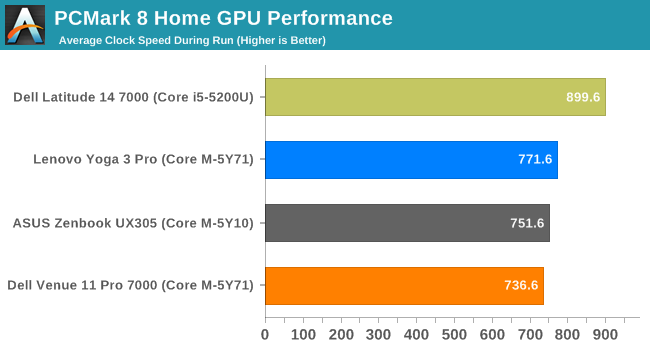
The GPU averages for the three Core M devices are very similar overall, although none are at their maximum. Only the 15 watt Core i5 can maintain its maximum GPU frequency for the duration of this test. As we will see later, GPUs can draw a lot of power.
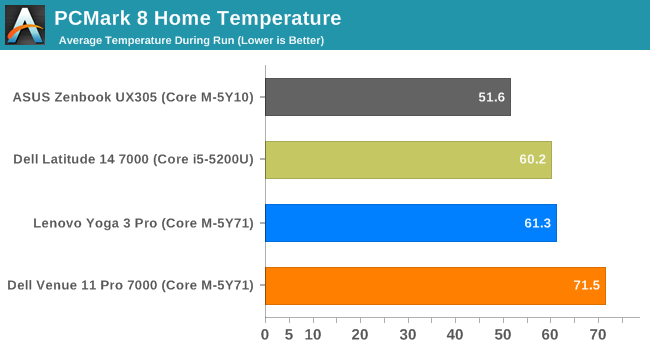
Moving on to temperature, with the burst nature of this benchmark, all of the devices have a reasonable time to cool off between workloads. The ASUS shows its amazing cooling capabilities again, with a significantly lower temperature than even both of the active cooled devices, but none of them are too close to their maximum allowed temperature over the duration.

Looking at the end result of this benchmark kind of throws everything we have seen in the above graphs on its head. The Yoga 3 Pro, despite sustaining a CPU frequency higher than all of the other Core M devices in this test, ends up scoring the worst, however the overall result by the Yoga 3 Pro is disadvantaged in this benchmark by the gaming test, due to the high resolution display on the Yoga 3 Pro. This is very similar to the results seen in the Dell XPS 13 review, where the QHD+ model only scored 2691 and the FHD model scored 3042 with the same processor. However the ASUS UX305 beats the other Core M devices, although it does so with a much lower resolution display than the Yoga 3 Pro which would certainly beat it otherwise.


110 Comments
View All Comments
zodiacfml - Wednesday, April 8, 2015 - link
A long for this look at the performance Core M. Thanks. Like all nice, popular movies the end is pretty expected after a review from the Asus UX305. It's also good that the Dell is there to provide the scores for no limitation on cooling for long continuous loads.After all this, I don't see any problem. The performance of the Asus is pretty expected as well having a tradional notebook design which is fairly overkill for the SDP/TDP.
I was a PC overclocker many years ago and then realized that underclocking and overclocking at the same time would be ideal. I believe the race to wider CPU dynamic range has become mainstream.
dragonsqrrl - Wednesday, April 8, 2015 - link
"Each model comes with 4MB of L2 cache" On the first page.Shouldn't that be L3 cache?
dananski - Wednesday, April 8, 2015 - link
I love how the Asus tries to draw a piano keyboard in the PCMark 8 Creative graph. Very creative of it.DryAir - Wednesday, April 8, 2015 - link
The temperature x time graphs are all messed up. The lines goes "back" on many ocasions, indicating 2 different temperatures on a same time stamp. You should check the settings on whatever program you are using to generate these graphics.be_prime - Wednesday, April 8, 2015 - link
I just signed up to comment on the same thing -- the graphs are so clearly distorted by some (no doubt well-intentioned) spline/smoothing that much (even most?) of the data we see here may be the product of a spline or interpolation process, and not represent a data measurement. Where the line goes "back", as DryAir pointed out, it implies time travel.That's a very big miss for a site that I've considered to be thoughtful and authoritative. The approach you took here presents false and interpolated data and obscures the quality of your research. Don't let the goal of an attractive graph ruin the whole point of the graph: showing the data.
These graphs are obviously impossible due to the spline/interpolation used, and should be replaced by a scatter plot or normal line graph.
Brett Howse - Wednesday, April 8, 2015 - link
As I mentioned on the Devices and Test page, sometimes the devices were very heavily loaded and they were not able to log consistently. Sometimes they would log twice in the same second, but with slightly different values. One log would be time 0:00:01:05, and another would log 0:00:01:95 (for instance), but both would be truncated to the same second. Unfortunately that's just the limit of the software, since it only logs time to the nearest second. A second can be a lot of time for a CPU.be_prime - Thursday, April 9, 2015 - link
That's fine because those data points represent measurements.The problem here is you've used interpolated splines/curves which, in this case, actually show impossible or false information: the curve leaning "left" implies that the x-axis (time) is decreasing: that's time travel, and it'd be a bigger story than the Core M for sure, right?
Also recognize that if you're gathering data points, but drawing a line, you're always implicitly creating an interpolation between those points (at least in viewers minds). Usually, it doesn't matter so much. Here, the resulting lines are false, and I think Anandtech is a better publication than that.
As it stands, the interpolation/smoothing on your graphs implies time travel. Respectfully: please correct this (or, patent the relevant technology and profit!). If you're going to make your graphs look "pretty" and don't care if they're correct, I can't trust your results.
DryAir - Friday, April 10, 2015 - link
Sarcastic time travel jokes aside, I agree that you should change it somehow. Perhaps just change the data points to be connected to a straith line, instead of a smoothed one. Right now its looking very amateuristic, not matching an otherwise great and highly technical review.Brett Howse - Friday, April 10, 2015 - link
Ice Storm was the worst offender so I've re-generated the graphs with straight lines. There just was not enough data points on that one because it was so short.gw74 - Wednesday, April 8, 2015 - link
I am furious that OEMs are using Core M in ultrabooks. It is the solution to a problem which does not exist. The Samsung Series 9 / ATIV 9 Plus use full fat i5 and i7 ULVs and the 2 tiny fans hardly ever come on. when they do, they sound like mice whispering. and huge battery life.Core M is not progress when used in the ultrabook factor. it is a step backwards and a ripoff.