Intel SSD 750 PCIe SSD Review: NVMe for the Client
by Kristian Vättö on April 2, 2015 12:00 PM ESTMixed Random Read/Write Performance
Mixed read/write tests are also a new addition to our test suite. In real world applications a significant portion of workloads are mixed, meaning that there are both read and write IOs. Our Storage Bench benchmarks already illustrate mixed workloads by being based on actual real world IO traces, but until now we haven't had a proper synthetic way to measure mixed performance.
The benchmark is divided into two tests. The first one tests mixed performance with 4KB random IOs at six different read/write distributions starting at 100% reads and adding 20% of writes in each phase. Because we are dealing with a mixed workload that contains reads, the drive is first filled with 128KB sequential data to ensure valid results. Similarly, because the IO pattern is random, I've limited the LBA span to 16GB to ensure that the results aren't affected by IO consistency. The queue depth of the 4KB random test is three.
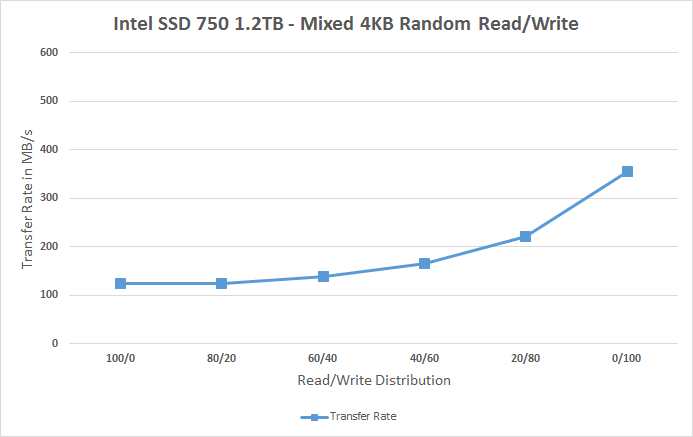
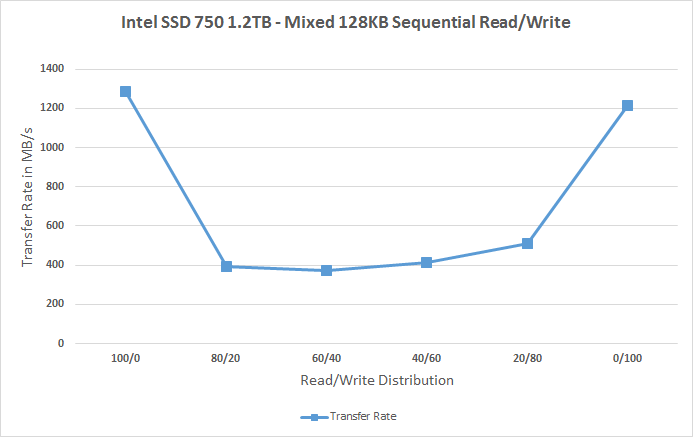
Again, for the sake of readability, I provide both an average based bar graph as well as a line graph with the full data on it. The bar graph represents an average of all six read/write distribution data rates for quick comparison, whereas the line graph includes a separate data point for each tested distribution.
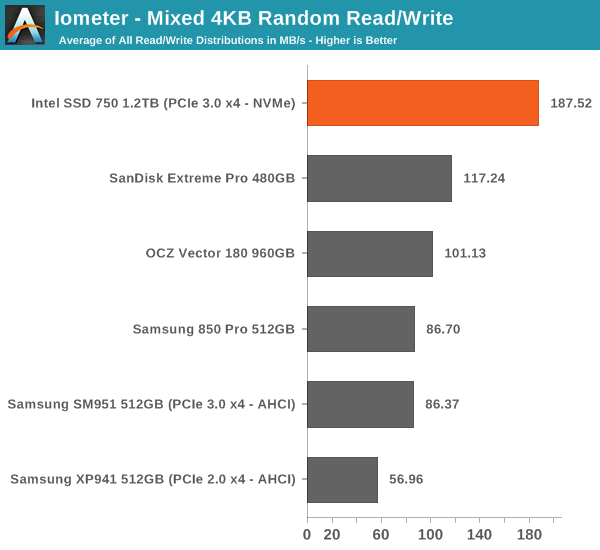
The SSD 750 does very well in mixed random workloads, especially when compared to the SM951 that is slower than most high-end SATA drives. The performance scales quite nicely as the portion of writes is increased.
 |
|||||||||
Mixed Sequential Read/Write Performance
The sequential mixed workload tests are also tested with a full drive, but I've not limited the LBA range as that's not needed with sequential data patterns. The queue depth for the tests is one.
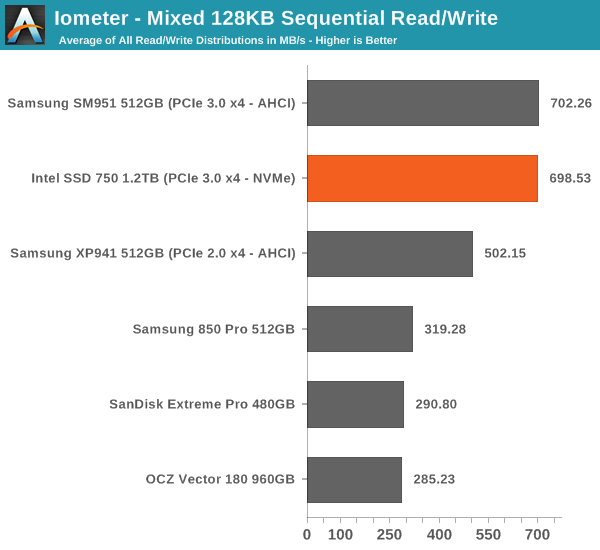
In mixed sequential workloads, however, the SSD 750 and SM951 are practically indentical. Both deliver excellent performance at 100% reads and writes, but the performance does drop significantly once reads and writes are mixed. Even with the drop, the two push out 400MB/s whereas most SATA drives manage ~200MB/s, so PCIe certainly has a big advantage here.
 |
|||||||||


132 Comments
View All Comments
knweiss - Thursday, April 2, 2015 - link
Kristian, you wrote "for up to 4GB/s of bandwidth with PCIe 3.0 (although in real world the maximum bandwidth is about 3.2GB/s due to PCIe inefficiency)". Is this really true? PCIe 2.0 uses 8b/10b encoding with 20% bandwidth overhead which would match your numbers. However, PCIe 3.0 uses 128b/130b encoding with only 1.54% bandwidth overhead. Could you please explain the inefficiency you mentioned? Thanks in advance!DanNeely - Thursday, April 2, 2015 - link
The real world number includes the bandwidth consumed by PCIe packet headers, NVME packet headers, NVME command messages, etc. Those are over and above the penalty from the encoding scheme on the bus itself.IntelUser2000 - Thursday, April 2, 2015 - link
The 4GB bandwidth takes into account the encoding scheme.Each lane of v1 PCI-Express had 2.5GT/s so with 8b/10b encoding you end up with 2.5G/10 = 250MB/s. Quadruple that for four lanes and you end up with 1GB/s.
v2 of PCI-Express is double that and v3 of PCI-Express is further double that and there is the 4GB number.
aggrokalle - Thursday, April 2, 2015 - link
i'm interrested in this as well...so how many nand-channels got the 1.2tb and 400gb version Kristian?tspacie - Thursday, April 2, 2015 - link
Was there an approximate release date?gforce007 - Thursday, April 2, 2015 - link
When will these be available for purchase? Also I have a m.2 slot on my motherboard (z10PE-D8 WS) Id rather utilize the 2.5 15mm form factor. I am a bit confused. I dont think that board has SFF-8639. Is there an adapter. Will that affect performance? I assume so and by how much?knweiss - Thursday, April 2, 2015 - link
The motherboard (host) end of the cable has a square-shaped SFF-8643(!) connector. E.g. ASUS ships an M.2 adapter card for the X99 Sabertooth that offers a suitable port. SFF-8639 is on the drive's end.emn13 - Thursday, April 2, 2015 - link
That endurance number is scarily low for a 1.2TB drive. 70GB a day for 5 years - thats about 128 TB of writes total, and that's just 100 drive writes! Put another way, at around 1GB/sec (which this drive can easily do), you'd reach those 100 drive writes in just 36 hours.Of course, that's an extremely intensive workload, but I sure hope this is just intel trying to avoid giving any warrantee rather than an every remotely realistic assessment of the drives capabilities.
p1esk - Thursday, April 2, 2015 - link
This is a consumer drive. What's your use case where you write more than 70GB a day?juhatus - Friday, April 3, 2015 - link
Raw 4k video and its not even close to being enough.At 4K (4096 x 2160) it registers 1697 Mbps which equals 764 GB/hour of 4K video footage. A single camera large Hollywood production can often shoot 100 hours of footage. That’s 76 TB of 4K ProRes 4444 XQ footage.
The upcoming David Fincher film GONE GIRL crept up on 500 hours of raw footage during its multi camera 6K RED Dragon production. That equates to roughly 315 TB of RED 6K (4:1) footage. Shit just got real for data management and post production workflows.