Intel SSD 750 PCIe SSD Review: NVMe for the Client
by Kristian Vättö on April 2, 2015 12:00 PM ESTAnandTech Storage Bench - The Destroyer
The Destroyer has been an essential part of our SSD test suite for nearly two years now. It was crafted to provide a benchmark for very IO intensive workloads, which is where you most often notice the difference between drives. It's not necessarily the most relevant test to an average user, but for anyone with a heavier IO workload The Destroyer should do a good job at characterizing performance.
| AnandTech Storage Bench - The Destroyer | ||||||||||||
| Workload | Description | Applications Used | ||||||||||
| Photo Sync/Editing | Import images, edit, export | Adobe Photoshop CS6, Adobe Lightroom 4, Dropbox | ||||||||||
| Gaming | Download/install games, play games | Steam, Deus Ex, Skyrim, Starcraft 2, BioShock Infinite | ||||||||||
| Virtualization | Run/manage VM, use general apps inside VM | VirtualBox | ||||||||||
| General Productivity | Browse the web, manage local email, copy files, encrypt/decrypt files, backup system, download content, virus/malware scan | Chrome, IE10, Outlook, Windows 8, AxCrypt, uTorrent, AdAware | ||||||||||
| Video Playback | Copy and watch movies | Windows 8 | ||||||||||
| Application Development | Compile projects, check out code, download code samples | Visual Studio 2012 | ||||||||||
The table above describes the workloads of The Destroyer in a bit more detail. Most of the workloads are run independently in the trace, but obviously there are various operations (such as backups) in the background.
| AnandTech Storage Bench - The Destroyer - Specs | ||||||||||||
| Reads | 38.83 million | |||||||||||
| Writes | 10.98 million | |||||||||||
| Total IO Operations | 49.8 million | |||||||||||
| Total GB Read | 1583.02 GB | |||||||||||
| Total GB Written | 875.62 GB | |||||||||||
| Average Queue Depth | ~5.5 | |||||||||||
| Focus | Worst case multitasking, IO consistency | |||||||||||
The name Destroyer comes from the sheer fact that the trace contains nearly 50 million IO operations. That's enough IO operations to effectively put the drive into steady-state and give an idea of the performance in worst case multitasking scenarios. About 67% of the IOs are sequential in nature with the rest ranging from pseudo-random to fully random.
| AnandTech Storage Bench - The Destroyer - IO Breakdown | |||||||||||
| IO Size | <4KB | 4KB | 8KB | 16KB | 32KB | 64KB | 128KB | ||||
| % of Total | 6.0% | 26.2% | 3.1% | 2.4% | 1.7% | 38.4% | 18.0% | ||||
I've included a breakdown of the IOs in the table above, which accounts for 95.8% of total IOs in the trace. The leftover IO sizes are relatively rare in between sizes that don't have a significant (>1%) share on their own. Over a half of the transfers are large IOs with one fourth being 4KB in size.
| AnandTech Storage Bench - The Destroyer - QD Breakdown | ||||||||||||
| Queue Depth | 1 | 2 | 3 | 4-5 | 6-10 | 11-20 | 21-32 | >32 | ||||
| % of Total | 50.0% | 21.9% | 4.1% | 5.7% | 8.8% | 6.0% | 2.1% | 1.4% | ||||
Despite the average queue depth of 5.5, a half of the IOs happen at queue depth of one and scenarios where the queue depths is higher than 10 are rather infrequent.
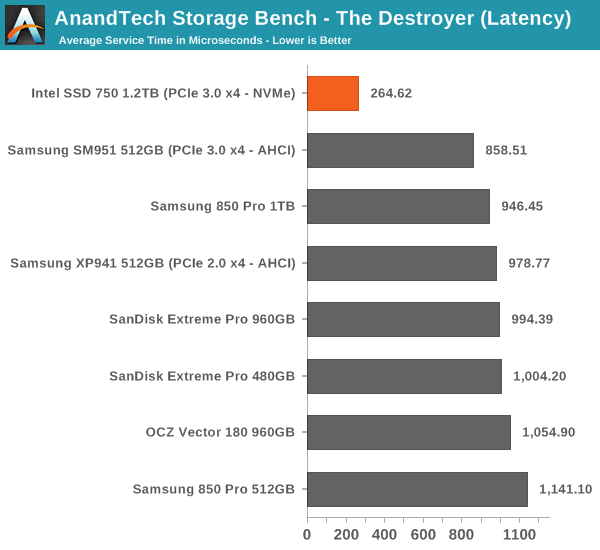
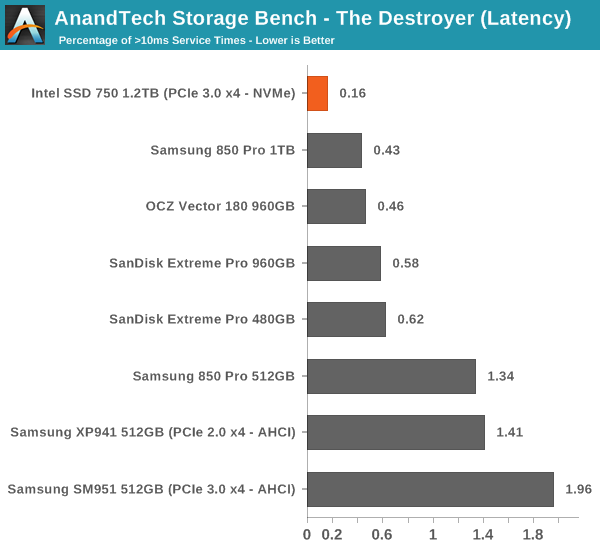
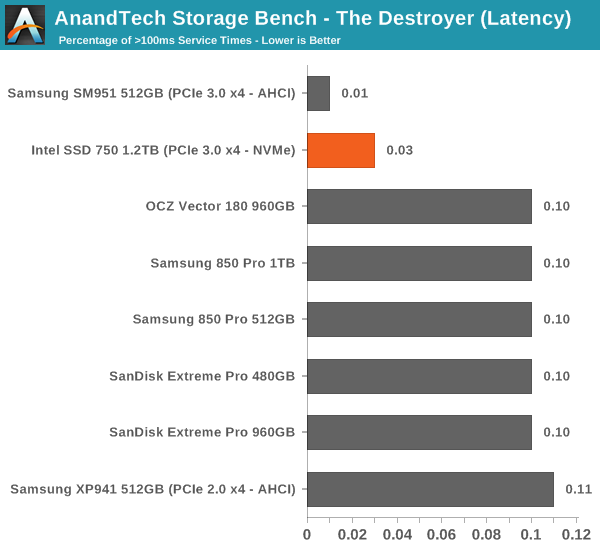
The two key metrics I'm reporting haven't changed and I'll continue to report both data rate and latency because the two have slightly different focuses. Data rate measures the speed of the data transfer, so it emphasizes large IOs that simply account for a much larger share when looking at the total amount of data. Latency, on the other hand, ignores the IO size, so all IOs are given the same weight in the calculation. Both metrics are useful, although in terms of system responsiveness I think the latency is more critical. As a result, I'm also reporting two new stats that provide us a very good insight to high latency IOs by reporting the share of >10ms and >100ms IOs as a percentage of the total.
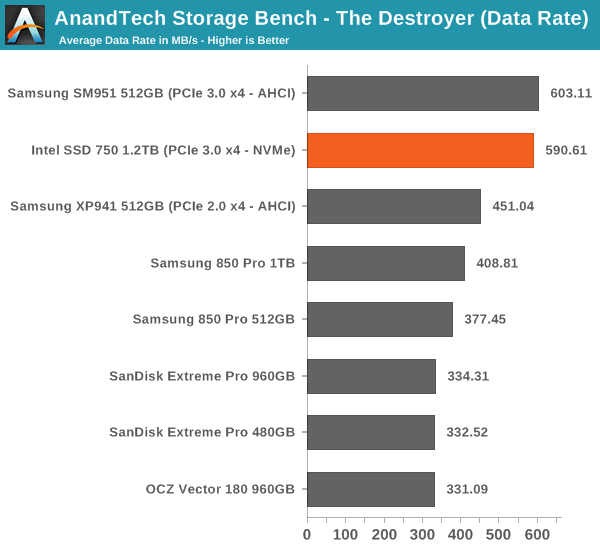
In terms of throughput, the SSD 750 is actually marginally slower than the SM951, although when you look at latency the SD 750 wins by a large margin. The difference in these scores is explained by Intel's focus on random performance as Intel specifically optimized the firmware for high random IO performance, which does have some impact on the sequential performance. As I've explained above, data rate has more emphasis on large IO size transfers, whereas latency treats all IOs the same regardless of their size.
The number of high latency IOs is also excellent and in fact the best we have tested. The SSD 750 is without a doubt a very consistent drive.


132 Comments
View All Comments
knweiss - Thursday, April 2, 2015 - link
Kristian, you wrote "for up to 4GB/s of bandwidth with PCIe 3.0 (although in real world the maximum bandwidth is about 3.2GB/s due to PCIe inefficiency)". Is this really true? PCIe 2.0 uses 8b/10b encoding with 20% bandwidth overhead which would match your numbers. However, PCIe 3.0 uses 128b/130b encoding with only 1.54% bandwidth overhead. Could you please explain the inefficiency you mentioned? Thanks in advance!DanNeely - Thursday, April 2, 2015 - link
The real world number includes the bandwidth consumed by PCIe packet headers, NVME packet headers, NVME command messages, etc. Those are over and above the penalty from the encoding scheme on the bus itself.IntelUser2000 - Thursday, April 2, 2015 - link
The 4GB bandwidth takes into account the encoding scheme.Each lane of v1 PCI-Express had 2.5GT/s so with 8b/10b encoding you end up with 2.5G/10 = 250MB/s. Quadruple that for four lanes and you end up with 1GB/s.
v2 of PCI-Express is double that and v3 of PCI-Express is further double that and there is the 4GB number.
aggrokalle - Thursday, April 2, 2015 - link
i'm interrested in this as well...so how many nand-channels got the 1.2tb and 400gb version Kristian?tspacie - Thursday, April 2, 2015 - link
Was there an approximate release date?gforce007 - Thursday, April 2, 2015 - link
When will these be available for purchase? Also I have a m.2 slot on my motherboard (z10PE-D8 WS) Id rather utilize the 2.5 15mm form factor. I am a bit confused. I dont think that board has SFF-8639. Is there an adapter. Will that affect performance? I assume so and by how much?knweiss - Thursday, April 2, 2015 - link
The motherboard (host) end of the cable has a square-shaped SFF-8643(!) connector. E.g. ASUS ships an M.2 adapter card for the X99 Sabertooth that offers a suitable port. SFF-8639 is on the drive's end.emn13 - Thursday, April 2, 2015 - link
That endurance number is scarily low for a 1.2TB drive. 70GB a day for 5 years - thats about 128 TB of writes total, and that's just 100 drive writes! Put another way, at around 1GB/sec (which this drive can easily do), you'd reach those 100 drive writes in just 36 hours.Of course, that's an extremely intensive workload, but I sure hope this is just intel trying to avoid giving any warrantee rather than an every remotely realistic assessment of the drives capabilities.
p1esk - Thursday, April 2, 2015 - link
This is a consumer drive. What's your use case where you write more than 70GB a day?juhatus - Friday, April 3, 2015 - link
Raw 4k video and its not even close to being enough.At 4K (4096 x 2160) it registers 1697 Mbps which equals 764 GB/hour of 4K video footage. A single camera large Hollywood production can often shoot 100 hours of footage. That’s 76 TB of 4K ProRes 4444 XQ footage.
The upcoming David Fincher film GONE GIRL crept up on 500 hours of raw footage during its multi camera 6K RED Dragon production. That equates to roughly 315 TB of RED 6K (4:1) footage. Shit just got real for data management and post production workflows.