Intel SSD 750 PCIe SSD Review: NVMe for the Client
by Kristian Vättö on April 2, 2015 12:00 PM ESTAnandTech Storage Bench - The Destroyer
The Destroyer has been an essential part of our SSD test suite for nearly two years now. It was crafted to provide a benchmark for very IO intensive workloads, which is where you most often notice the difference between drives. It's not necessarily the most relevant test to an average user, but for anyone with a heavier IO workload The Destroyer should do a good job at characterizing performance.
| AnandTech Storage Bench - The Destroyer | ||||||||||||
| Workload | Description | Applications Used | ||||||||||
| Photo Sync/Editing | Import images, edit, export | Adobe Photoshop CS6, Adobe Lightroom 4, Dropbox | ||||||||||
| Gaming | Download/install games, play games | Steam, Deus Ex, Skyrim, Starcraft 2, BioShock Infinite | ||||||||||
| Virtualization | Run/manage VM, use general apps inside VM | VirtualBox | ||||||||||
| General Productivity | Browse the web, manage local email, copy files, encrypt/decrypt files, backup system, download content, virus/malware scan | Chrome, IE10, Outlook, Windows 8, AxCrypt, uTorrent, AdAware | ||||||||||
| Video Playback | Copy and watch movies | Windows 8 | ||||||||||
| Application Development | Compile projects, check out code, download code samples | Visual Studio 2012 | ||||||||||
The table above describes the workloads of The Destroyer in a bit more detail. Most of the workloads are run independently in the trace, but obviously there are various operations (such as backups) in the background.
| AnandTech Storage Bench - The Destroyer - Specs | ||||||||||||
| Reads | 38.83 million | |||||||||||
| Writes | 10.98 million | |||||||||||
| Total IO Operations | 49.8 million | |||||||||||
| Total GB Read | 1583.02 GB | |||||||||||
| Total GB Written | 875.62 GB | |||||||||||
| Average Queue Depth | ~5.5 | |||||||||||
| Focus | Worst case multitasking, IO consistency | |||||||||||
The name Destroyer comes from the sheer fact that the trace contains nearly 50 million IO operations. That's enough IO operations to effectively put the drive into steady-state and give an idea of the performance in worst case multitasking scenarios. About 67% of the IOs are sequential in nature with the rest ranging from pseudo-random to fully random.
| AnandTech Storage Bench - The Destroyer - IO Breakdown | |||||||||||
| IO Size | <4KB | 4KB | 8KB | 16KB | 32KB | 64KB | 128KB | ||||
| % of Total | 6.0% | 26.2% | 3.1% | 2.4% | 1.7% | 38.4% | 18.0% | ||||
I've included a breakdown of the IOs in the table above, which accounts for 95.8% of total IOs in the trace. The leftover IO sizes are relatively rare in between sizes that don't have a significant (>1%) share on their own. Over a half of the transfers are large IOs with one fourth being 4KB in size.
| AnandTech Storage Bench - The Destroyer - QD Breakdown | ||||||||||||
| Queue Depth | 1 | 2 | 3 | 4-5 | 6-10 | 11-20 | 21-32 | >32 | ||||
| % of Total | 50.0% | 21.9% | 4.1% | 5.7% | 8.8% | 6.0% | 2.1% | 1.4% | ||||
Despite the average queue depth of 5.5, a half of the IOs happen at queue depth of one and scenarios where the queue depths is higher than 10 are rather infrequent.
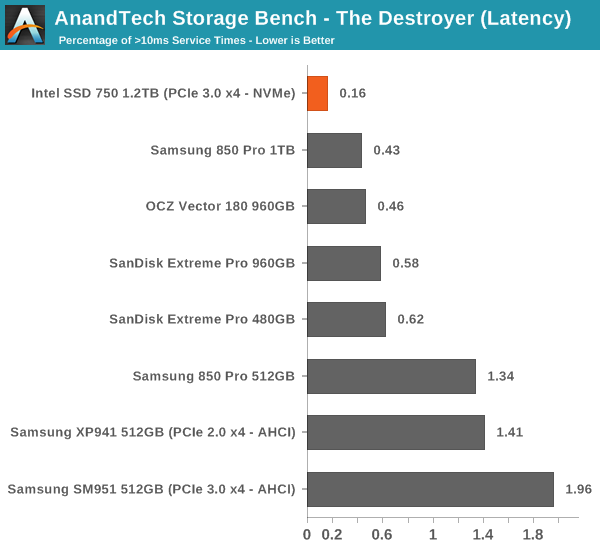
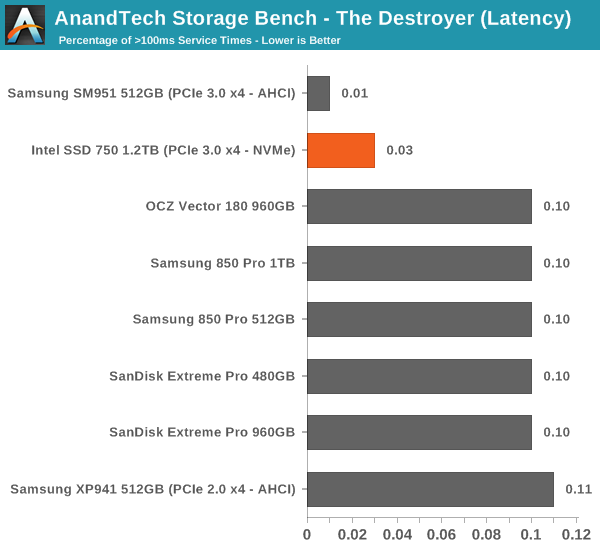
The two key metrics I'm reporting haven't changed and I'll continue to report both data rate and latency because the two have slightly different focuses. Data rate measures the speed of the data transfer, so it emphasizes large IOs that simply account for a much larger share when looking at the total amount of data. Latency, on the other hand, ignores the IO size, so all IOs are given the same weight in the calculation. Both metrics are useful, although in terms of system responsiveness I think the latency is more critical. As a result, I'm also reporting two new stats that provide us a very good insight to high latency IOs by reporting the share of >10ms and >100ms IOs as a percentage of the total.
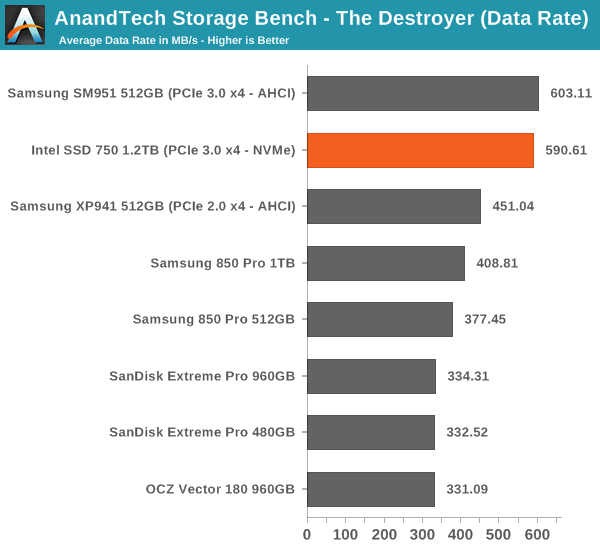
In terms of throughput, the SSD 750 is actually marginally slower than the SM951, although when you look at latency the SD 750 wins by a large margin. The difference in these scores is explained by Intel's focus on random performance as Intel specifically optimized the firmware for high random IO performance, which does have some impact on the sequential performance. As I've explained above, data rate has more emphasis on large IO size transfers, whereas latency treats all IOs the same regardless of their size.
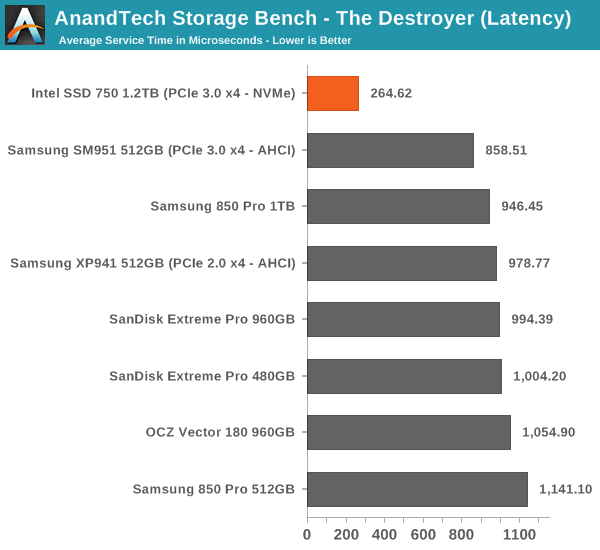
The number of high latency IOs is also excellent and in fact the best we have tested. The SSD 750 is without a doubt a very consistent drive.


132 Comments
View All Comments
Per Hansson - Saturday, April 4, 2015 - link
It's most likely due to the poor performance of file transfers below 4KB with this drive.Shadowmaster625 - Thursday, April 2, 2015 - link
The funny thing is that the X25-M is STILL a great product. You can buy one on ebay and place it into a new build and it works just fine. And will continue to work just fine for many more years.eanazag - Thursday, April 2, 2015 - link
I have 4 X25-M 80 GB drives in RAID 0. The 750 is cheaper and faster than my setup. Price is based on what I paid several years ago for them.I would need a new motherboard and CPU to make this drive bootable. I do want.
Intel's PCIe lane bottleneck is pathetic. It seems to be a constant concern. X99 and Haswell-E is not the best answer to the problem. I am really skeptical about waiting for Skylake and the associated chipset. Broadwell for desktop hasn't even been released yet. Skylake for desktop will likely be next year at this rate.
DanNeely - Thursday, April 2, 2015 - link
Intel's never waivered from stating that SkyLake will launch on time and that all of the 14nm ramping delays will be absorbed by shortening broadwell's life. At this point I am wondering if desktop broadwell might end up being cut entirely in the mainstream market segment; with only the LGA2011 variant and possibly the LGA1150 celeron/pentium class chips that normally launch about a year after the rest of the product line on the desktop.r3loaded - Friday, April 3, 2015 - link
Skylake will bring 20 PCIe 3.0 lanes on the PCH, in addition to the PCIe 3.0 lanes coming off the CPU (Skylake-E CPUs will introduce PCIe 4.0) as well as support for up to three SATA Express/M.2 devices. Don't worry, Intel is well aware of the bandwidth bottleneck and they're addressing it.Hung_Low - Thursday, April 2, 2015 - link
So is thisi 750 the long rumoured P3500?Shadowmaster625 - Thursday, April 2, 2015 - link
I'm not satisfied with the explanations of why this product is slower than the SM951. By all rights it should be faster. Why would it still get a recommendation by anandtech?Kristian Vättö - Thursday, April 2, 2015 - link
It's only slower in the Heavy and Light traces, which focus more on peak performance rather than consistency. In The Destroyer trace the SSD 750 has significantly lower IO latency and that's what's critical for power users and professionals since it translates to more responsive system. The Heavy and Light traces don't really illustrate the workloads where the SSD 750 is aimed for, hence the SM951 is faster in those.BD2003 - Thursday, April 2, 2015 - link
Is it really measureably more responsive though? I guess I have a hard time believing that latencies measured in microseconds are going to bare out into any real world difference. Maybe it makes a difference on the single digit millisecond scale, but I'm talking real world here. Like is there any scenario where you'd be able to measure the *actual responsiveness*, meaning the time between clicking something and it actually responding to your command is measurably better? Even if it's just something minor like notepad opens in 50ms vs 100ms while you're compiling and backing up at the same time?Their target market is consumers so I feel like they've got to justify it on the basis of real world usage, not theory or benchmarks. From what I'm seeing here the SM951 looks like a better buy in every single way that matters.
SirPerro - Monday, April 6, 2015 - link
It's not about "clicking and responding". It's about different servers/databases handling hundreds of requests per second in a heavily multithreaded scenario.For UI interaction you probably cannot make the difference between this and the cheapest SSD on the market unless compared side by side.
As the review explains, this is targeted to a very specific niche. Whether people understand the scope of that niche or not is a different thing.