Intel SSD 750 PCIe SSD Review: NVMe for the Client
by Kristian Vättö on April 2, 2015 12:00 PM ESTMixed Random Read/Write Performance
Mixed read/write tests are also a new addition to our test suite. In real world applications a significant portion of workloads are mixed, meaning that there are both read and write IOs. Our Storage Bench benchmarks already illustrate mixed workloads by being based on actual real world IO traces, but until now we haven't had a proper synthetic way to measure mixed performance.
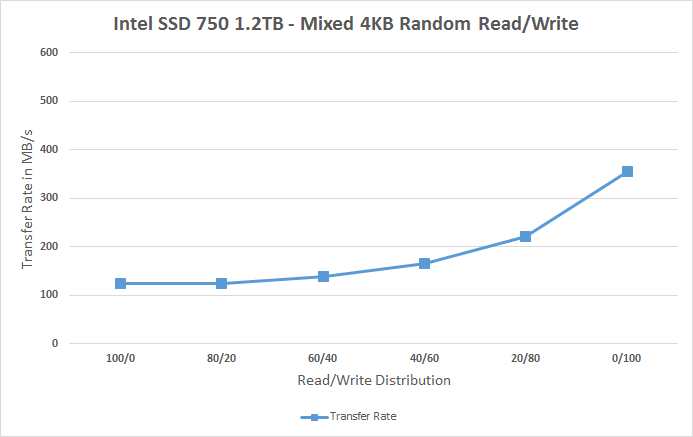
The benchmark is divided into two tests. The first one tests mixed performance with 4KB random IOs at six different read/write distributions starting at 100% reads and adding 20% of writes in each phase. Because we are dealing with a mixed workload that contains reads, the drive is first filled with 128KB sequential data to ensure valid results. Similarly, because the IO pattern is random, I've limited the LBA span to 16GB to ensure that the results aren't affected by IO consistency. The queue depth of the 4KB random test is three.
Again, for the sake of readability, I provide both an average based bar graph as well as a line graph with the full data on it. The bar graph represents an average of all six read/write distribution data rates for quick comparison, whereas the line graph includes a separate data point for each tested distribution.
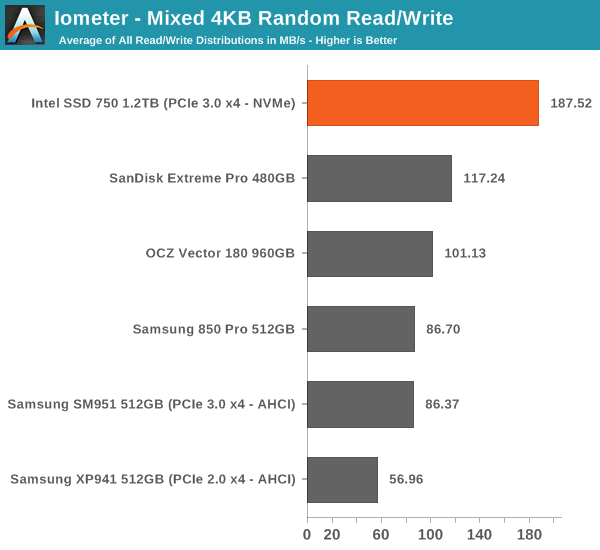
The SSD 750 does very well in mixed random workloads, especially when compared to the SM951 that is slower than most high-end SATA drives. The performance scales quite nicely as the portion of writes is increased.
 |
|||||||||
Mixed Sequential Read/Write Performance
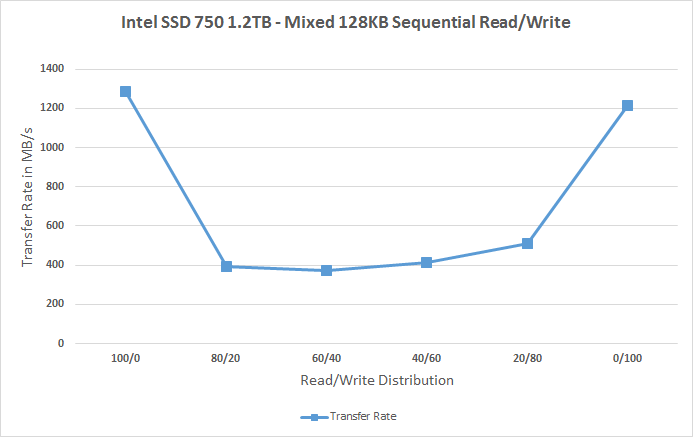
The sequential mixed workload tests are also tested with a full drive, but I've not limited the LBA range as that's not needed with sequential data patterns. The queue depth for the tests is one.
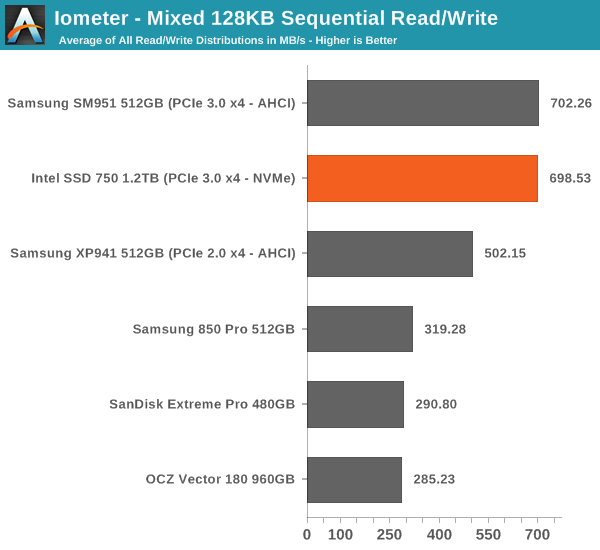
In mixed sequential workloads, however, the SSD 750 and SM951 are practically indentical. Both deliver excellent performance at 100% reads and writes, but the performance does drop significantly once reads and writes are mixed. Even with the drop, the two push out 400MB/s whereas most SATA drives manage ~200MB/s, so PCIe certainly has a big advantage here.
 |
|||||||||


132 Comments
View All Comments
kaisellgren - Friday, May 1, 2015 - link
Do not forget the Fiji 390x!dzezik - Saturday, May 7, 2016 - link
who needs chipset for PCIe if You have 40 lanes directly from CPU. it is step back in the configuration. it was big step ahead to put memory and PCIe to CPU. the chipset is useless.zrav - Thursday, April 2, 2015 - link
>It's again a bit disappointing that the SSD 750 isn't that well optimized for sequential IO because there's prcatically no scaling at allThat's a weird conclusion. I'd say it is quite impressive that the drive almost reaches peak throughput at QD 1 already. Requiring higher QD to achieve more throughput is a not a positive characteristic. But if that matters depends on the usage scenario ofc.
Kristian Vättö - Thursday, April 2, 2015 - link
It's impressive that the performance is almost the same regardless of queue depth, but I don't find 1.2GB/s to be very impressive for a 1.2TB PCIe drive.futrtrubl - Thursday, April 2, 2015 - link
Unfortunately your use of un-normalised standard deviation for performance consistency makes them a barrier to understanding. A 1000 IOPS drive with 5% variance is going to have lower standard deviation and by the way you have presented it "better consistency" than a 10000 IOPS drive with 1% variance.Kristian Vättö - Thursday, April 2, 2015 - link
Any suggestions for improving the metric? Perhaps divide by the average IOPS or its square root to take that into account as well?futrtrubl - Thursday, April 2, 2015 - link
Yes, I think dividing by the average IOPs would be perfect. You could even x100 to get it to a sort of percentage deviation.bricko - Saturday, April 4, 2015 - link
Here is test and review of the new 750, what is up with boot time...its SLOWEST of 14 drives. Everything else is great, but boot time. The Plextor M6 is 15 seconds, the 750 is 34 sec....ideashttp://techreport.com/review/28050/intel-750-serie...
Ethos Evoss - Saturday, April 4, 2015 - link
Plextor SSDs - BESTbricko - Saturday, April 4, 2015 - link
Its only slow on the boot time, otherwise it beats ALL other ssd on different loads and tests , by 2 - 3 times....odd it seems