Intel SSD 750 PCIe SSD Review: NVMe for the Client
by Kristian Vättö on April 2, 2015 12:00 PM ESTPerformance Consistency
We've been looking at performance consistency since the Intel SSD DC S3700 review in late 2012 and it has become one of the cornerstones of our SSD reviews. Back in the days many SSD vendors were only focusing on high peak performance, which unfortunately came at the cost of sustained performance. In other words, the drives would push high IOPS in certain synthetic scenarios to provide nice marketing numbers, but as soon as you pushed the drive for more than a few minutes you could easily run into hiccups caused by poor performance consistency.
Once we started exploring IO consistency, nearly all SSD manufacturers made a move to improve consistency and for the 2015 suite, I haven't made any significant changes to the methodology we use to test IO consistency. The biggest change is the move from VDBench to Iometer 1.1.0 as the benchmarking software and I've also extended the test from 2000 seconds to a full hour to ensure that all drives hit steady-state during the test.
For better readability, I now provide bar graphs with the first one being an average IOPS of the last 400 seconds and the second graph displaying the standard deviation during the same period. Average IOPS provides a quick look into overall performance, but it can easily hide bad consistency, so looking at standard deviation is necessary for a complete look into consistency.
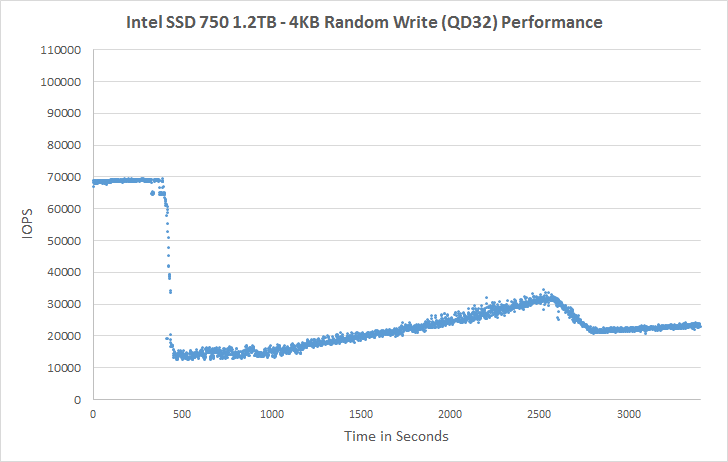
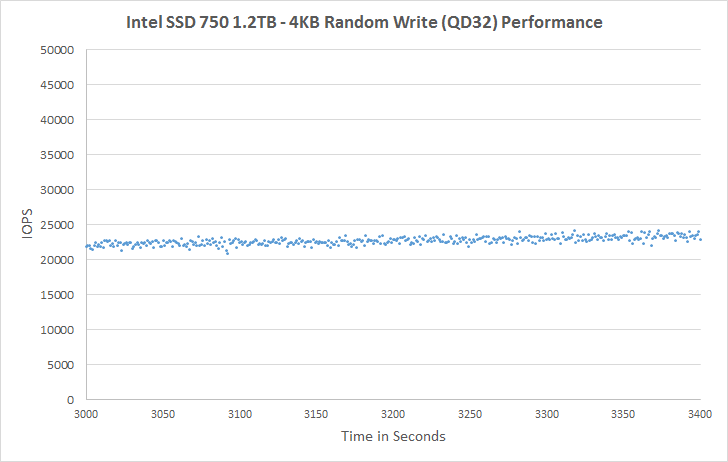
I'm still providing the same scatter graphs too, of course. However, I decided to dump the logarithmic graphs and go linear-only since logarithmic graphs aren't as accurate and can be hard to interpret for those who aren't familiar with them. I provide two graphs: one that includes the whole duration of the test and another that focuses on the last 400 seconds of the test to get a better scope into steady-state performance.
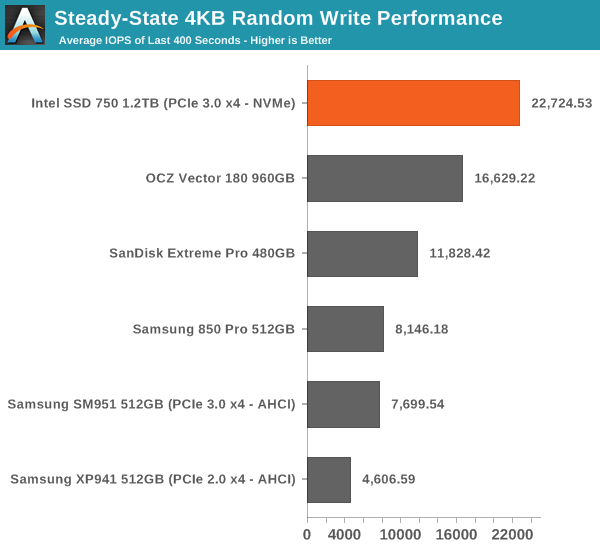
Given the higher over-provisioning and an enterprise-oriented controller, it's no surprise that the SSD 750 has excellent steady-state random write performance.
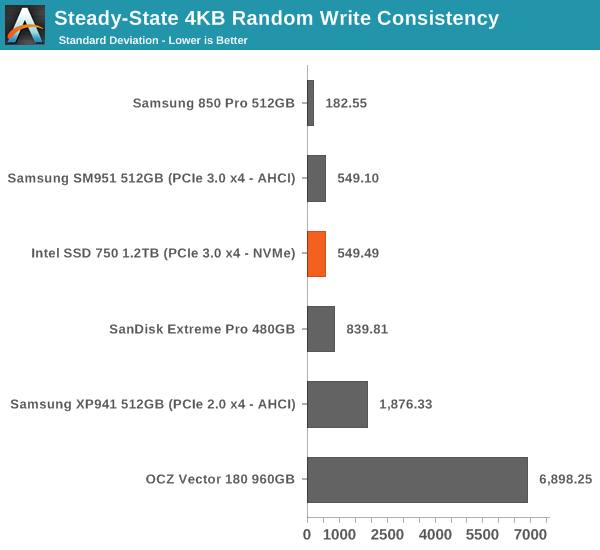
The consistency is also very good, although the SSD 750 can't beat the 850 Pro if just focusing on consistency. When considering that the SSD 750 provides nearly three times the performance, it's clear that the SSD 750 is better out of the two.
 |
|||||||||
| Default | |||||||||
At the initial cliff the performance drops to around 15K IOPS, but it quickly rises and seems to even out at about 22-23K IOPS. It actually takes nearly an hour for the SSD 750 to reach steady-state, which isn't uncommon for such a large drive but it's still notable.
I couldn't run tests with added over-provisioning because NVMe drives don't support the usual ATA commands that I use to limit the LBA of the drive. There is similar command set for NVMe as well, but I'm still trying to figure out how to use them as there's isn't too much public info about NVMe tools.
 |
|||||||||
| Default | |||||||||


132 Comments
View All Comments
kaisellgren - Friday, May 1, 2015 - link
Do not forget the Fiji 390x!dzezik - Saturday, May 7, 2016 - link
who needs chipset for PCIe if You have 40 lanes directly from CPU. it is step back in the configuration. it was big step ahead to put memory and PCIe to CPU. the chipset is useless.zrav - Thursday, April 2, 2015 - link
>It's again a bit disappointing that the SSD 750 isn't that well optimized for sequential IO because there's prcatically no scaling at allThat's a weird conclusion. I'd say it is quite impressive that the drive almost reaches peak throughput at QD 1 already. Requiring higher QD to achieve more throughput is a not a positive characteristic. But if that matters depends on the usage scenario ofc.
Kristian Vättö - Thursday, April 2, 2015 - link
It's impressive that the performance is almost the same regardless of queue depth, but I don't find 1.2GB/s to be very impressive for a 1.2TB PCIe drive.futrtrubl - Thursday, April 2, 2015 - link
Unfortunately your use of un-normalised standard deviation for performance consistency makes them a barrier to understanding. A 1000 IOPS drive with 5% variance is going to have lower standard deviation and by the way you have presented it "better consistency" than a 10000 IOPS drive with 1% variance.Kristian Vättö - Thursday, April 2, 2015 - link
Any suggestions for improving the metric? Perhaps divide by the average IOPS or its square root to take that into account as well?futrtrubl - Thursday, April 2, 2015 - link
Yes, I think dividing by the average IOPs would be perfect. You could even x100 to get it to a sort of percentage deviation.bricko - Saturday, April 4, 2015 - link
Here is test and review of the new 750, what is up with boot time...its SLOWEST of 14 drives. Everything else is great, but boot time. The Plextor M6 is 15 seconds, the 750 is 34 sec....ideashttp://techreport.com/review/28050/intel-750-serie...
Ethos Evoss - Saturday, April 4, 2015 - link
Plextor SSDs - BESTbricko - Saturday, April 4, 2015 - link
Its only slow on the boot time, otherwise it beats ALL other ssd on different loads and tests , by 2 - 3 times....odd it seems