Samsung SM951 (512GB) PCIe SSD Review
by Kristian Vättö on February 24, 2015 8:00 AM ESTRandom Read Performance
One of the major changes in our 2015 test suite is the synthetic Iometer tests we run. In the past we used to test just one or two queue depths, but real world workloads always contain a mix of different queue depths as shown by our Storage Bench traces. To get the full scope in performance, I'm now testing various queue depths starting from one and going all the way to up to 32. I'm not testing every single queue depth, but merely how the throughput scales with the queue depth. I'm using exponential scaling, meaning that the tested queue depths increase in powers of two (i.e. 1, 2, 4, 8...).
Read tests are conducted on a full drive because that is the only way to ensure that the results are valid (testing with an empty drive can substantially inflate the results and in reality the data you are reading is always valid rather than full of zeros). Each queue depth is tested for three minutes and there is no idle time between the tests.
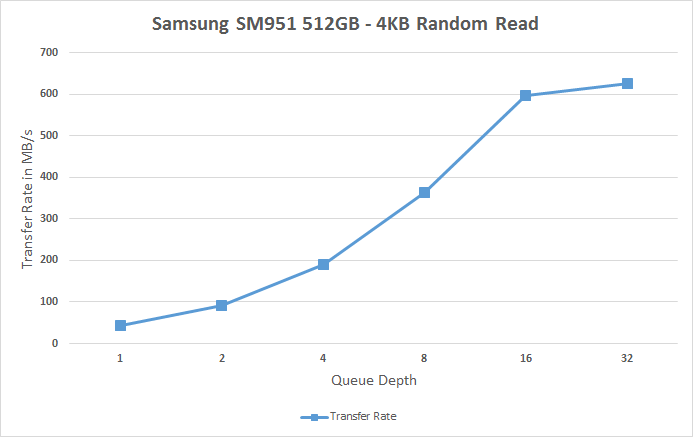
I'm also reporting two metrics now. For the bar graph, I've taken the average of QD1, QD2 and QD4 data rates, which are the most relevant queue depths for client workloads. This allows for easy and quick comparison between drives. In addition to the bar graph, I'm including a line graph, which shows the performance scaling across all queue depths. To keep the line graphs readable, each drive has its own graph, which can be selected from the drop-down menu.
I'm also plotting power for SATA drives and will be doing the same for PCIe drives as soon as I have the system set up properly. Our datalogging multimeter logs power consumption every second, so I report the average for every queue depth to see how the power scales with the queue depth and performance.
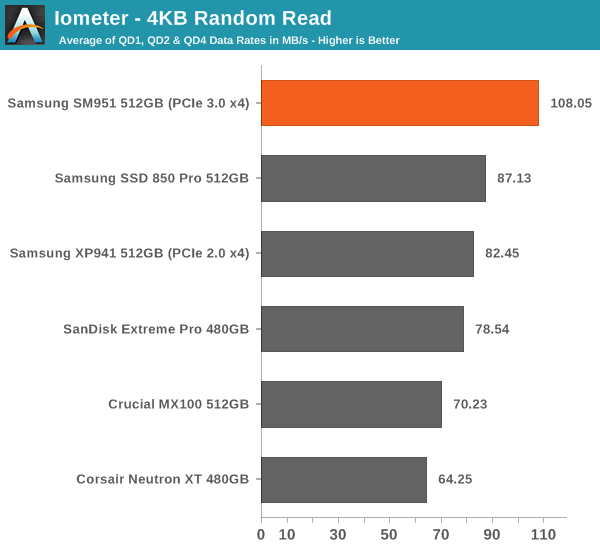
While the other SSDs hover at 60-90MB/s for random reads, the SM951 provides a rather noticeable upgrade at 108MB/s.
 |
|||||||||
Looking at the performance more closely reveals that the SM951 delivers better performance at all queue depths, although obviously the difference is at high queue depths where the SM951 can take advantage of the faster PCIe interface. The SM951 actually does over 150K IOPS when the MB/s is translated into throughput.
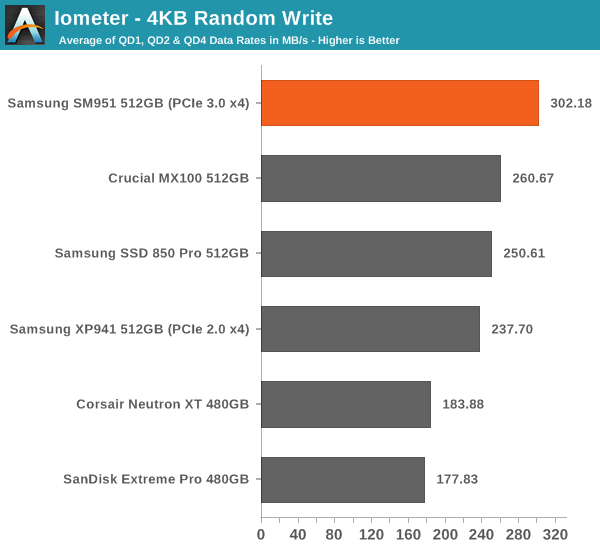
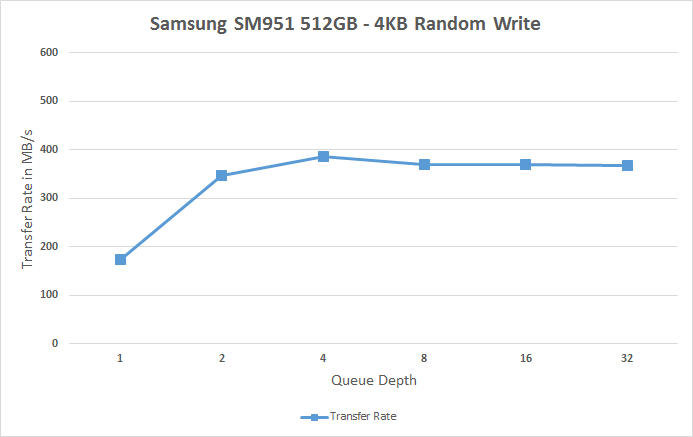
Random write performance is equally strong. The line graphs shows how the SM951 shifts the whole curve up, implying a performance increase at all queue depths. Especially the performance at queue depths of 1 and 2 are noticeably better than on other drives.
 |
|||||||||


128 Comments
View All Comments
iLovefloss - Tuesday, February 24, 2015 - link
Samsung's first two TLC drives, the 840 and 840 EVO, has some firmware issues that cause month old data to be read slowly. The severity ranges from slower than a speedy HDD to as slow as a SATA2 SSD. Samsung's first patch didn't resolve the issue for all the 840 EVO SSDs suffering from the slowdowns or only temporarily resolved, so Samsung is in the process of making another patch.kgh00007 - Wednesday, February 25, 2015 - link
I have an 840 EVO and I applied the firmware fix in October last year and the reads have dropped again to below 50MB/s on older data, ie. my OS files and stuff that was installed when I first set the drive up.I will be waiting to see how Samsung handle this before I buy another SSD from them. Benchmarks and reviews mean nothing if an SSD drops below HDD read speeds after a few months of real world use.
Cold boot now takes minutes, not seconds!!
3DoubleD - Wednesday, February 25, 2015 - link
Exactly. I have one drive that has sequential read minimums as low as 8.8MB/s and large portions averaging 50MB/s. Another drive is fine and operates at 300MB/s consistently (although I'm pretty sure that should be higher on SATA3, but day-to-day that is fast enough not to notice). They need to squash this bug if they plan on selling TLC drives in the future in any real volume. Enthusiasts will care, which is admittedly a small market, but I think some laptop vendors might begin to take notice and avoid Samsung TLC products as well, and that's a larger market.Irish_adam - Tuesday, February 24, 2015 - link
So when are they going to make a desktop version with a heatsink on it? It seems like everyone is so obsessed with portables these days that the desktop crowed is getting ignored but surely this kind of performance would mainly be used for a desktop machine than an ultra thin laptop. Its my main gripe with PCIe SSDs atmdananski - Tuesday, February 24, 2015 - link
Same occurred to me. Could probably get a substantial boost in long-running operations by attaching a heatsink. Should be easy enough to do yourself - thermal tape and some old vram heatsinks would probably do the trick without being so heavy as to break the pcie slot.I would like to see the rate of heat dissipation after heavy use (i.e. how that temperature graph looks after you stop writing to the disk). It starts throttling after roughly 180GB sequential, which is plenty for most scenarios, but how long does it take to cool back down again for your next big write? Does throttling occur under more mixed, sustained loads like a database server? Not exactly my kind of use cases, but I'd be interested to see.
DanNeely - Tuesday, February 24, 2015 - link
"However, it's nowhere near the maximum bandwidth of the PCIe 3.0 x4 bus, though, which should be about 3.2GB/s (PCIe only has ~80% efficiency with overhead after the 128b/132b scheme used by PCIe 3.0)."Where's the 20% loss coming from? 128/132 bit encoding only has a 3% overhead, is this an incompletely updated copy/paste from a description of PCIe 2.0? The 8/10bit encoding used in the older version did have a 20% penalty.
Kristian Vättö - Tuesday, February 24, 2015 - link
That's the overhead on top of the encoding scheme and is a rough figure based on our own testing with GPU memory bandwidth that will saturate the interface.It's the same in PCIe 2.0 too: the interface is good for 5GT/s per lane, which equals 500MB/s per lane once you take the 8b/10b encoding and bits to bytes translation into account. However, in real world the best bandwidths I've seen have been about 390MB/s per lane.
extide - Tuesday, February 24, 2015 - link
Protocol overhead (NOT the 120/132b part) -- the commands and stuff, interrupt latency from the cpu and other devices, DMA latencies on read/write to main system memory, etc.Hulk - Tuesday, February 24, 2015 - link
Would it be possible to display the entire AS SSD results window?Kristian Vättö - Tuesday, February 24, 2015 - link
I only run the sequential test, but I can certainly switch to running the full test and publishing the results as a screenshot if that's preferred.