Samsung SM951 (512GB) PCIe SSD Review
by Kristian Vättö on February 24, 2015 8:00 AM ESTAnandTech Storage Bench - Heavy
While The Destroyer focuses on sustained and worst-case performance by hammering the drive with nearly 1TB worth of writes, the Heavy trace provides a more typical enthusiast and power user workload. By writing less to the drive, the Heavy trace doesn't drive the SSD into steady-state and thus the trace gives us a good idea of peak performance combined with some basic garbage collection routines.
| AnandTech Storage Bench - Heavy | ||||||||||||
| Workload | Description | Applications Used | ||||||||||
| Photo Editing | Import images, edit, export | Adobe Photoshop | ||||||||||
| Gaming | Pllay games, load levels | Starcraft II, World of Warcraft | ||||||||||
| Content Creation | HTML editing | Dreamweaver | ||||||||||
| General Productivity | Browse the web, manage local email, document creation, application install, virus/malware scan | Chrome, IE10, Outlook, Windows 8, AxCrypt, uTorrent, AdAware | ||||||||||
| Application Development | Compile Chromium | Visual Studio 2008 | ||||||||||
The Heavy trace drops virtualization from the equation and goes a bit lighter on photo editing and gaming, making it more relevant to the majority of end-users.
| AnandTech Storage Bench - Heavy - Specs | ||||||||||||
| Reads | 2.17 million | |||||||||||
| Writes | 1.78 million | |||||||||||
| Total IO Operations | 3.99 million | |||||||||||
| Total GB Read | 48.63 GB | |||||||||||
| Total GB Written | 106.32 GB | |||||||||||
| Average Queue Depth | ~4.6 | |||||||||||
| Focus | Peak IO, basic GC routines | |||||||||||
The Heavy trace is actually more write-centric than The Destroyer is. A part of that is explained by the lack of virtualization because operating systems tend to be read-intensive, be that a local or virtual system. The total number of IOs is less than 10% of The Destroyer's IOs, so the Heavy trace is much easier for the drive and doesn't even overwrite the drive once.
| AnandTech Storage Bench - Heavy - IO Breakdown | |||||||||||
| IO Size | <4KB | 4KB | 8KB | 16KB | 32KB | 64KB | 128KB | ||||
| % of Total | 7.8% | 29.2% | 3.5% | 10.3% | 10.8% | 4.1% | 21.7% | ||||
The Heavy trace has more focus on 16KB and 32KB IO sizes, but more than half of the IOs are still either 4KB or 128KB. About 43% of the IOs are sequential with the rest being slightly more full random than pseudo-random.
| AnandTech Storage Bench - Heavy - QD Breakdown | ||||||||||||
| Queue Depth | 1 | 2 | 3 | 4-5 | 6-10 | 11-20 | 21-32 | >32 | ||||
| % of Total | 63.5% | 10.4% | 5.1% | 5.0% | 6.4% | 6.0% | 3.2% | 0.3% | ||||
In terms of queue depths the Heavy trace is even more focused on very low queue depths with three fourths happening at queue depth of one or two.
I'm reporting the same performance metrics as in The Destroyer benchmark, but I'm running the drive in both empty and full states. Some manufacturers tend to focus intensively on peak performance on an empty drive, but in reality the drive will always contain some data. Testing the drive in full state gives us valuable information whether the drive loses performance once it's filled with data.
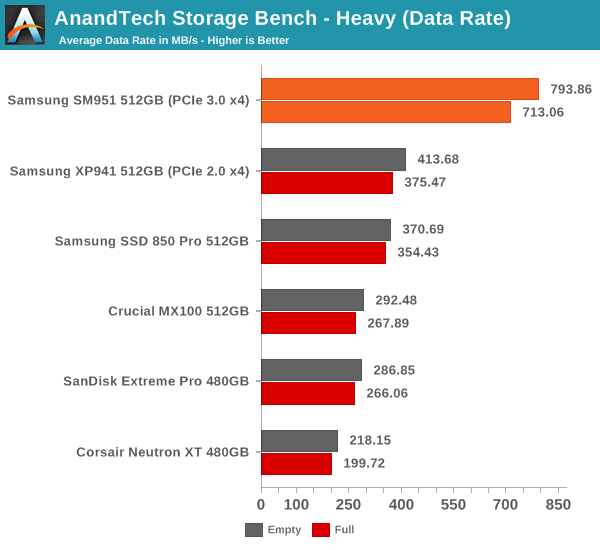
The SM951 performs even strongly in our Heavy trace and presents nearly 100% improvement in data rate over the XP941. In full state the SM951 loses a bit of its performance, but that's normal and the drop isn't any bigger than in other drives. Despite the lack of NVMe, it's starting to be clear that the SM951 is significantly faster than its predecessor and any SATA 6Gbps SSD.
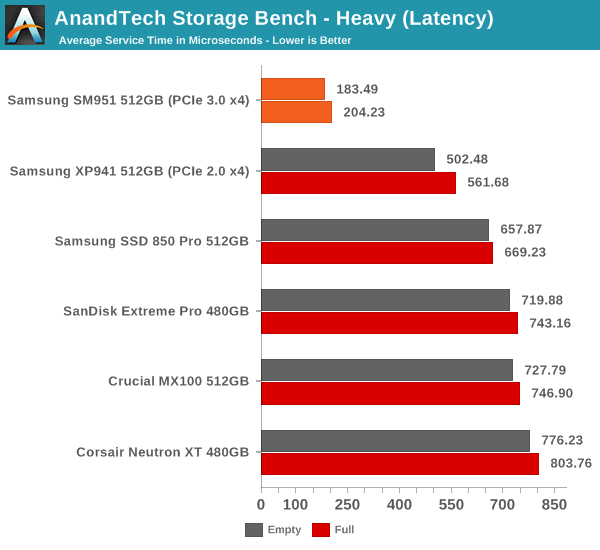
The average latency is also cut in less than half, which is actually a more substantial improvement than going from a SATA 6Gbps drive to the XP941.
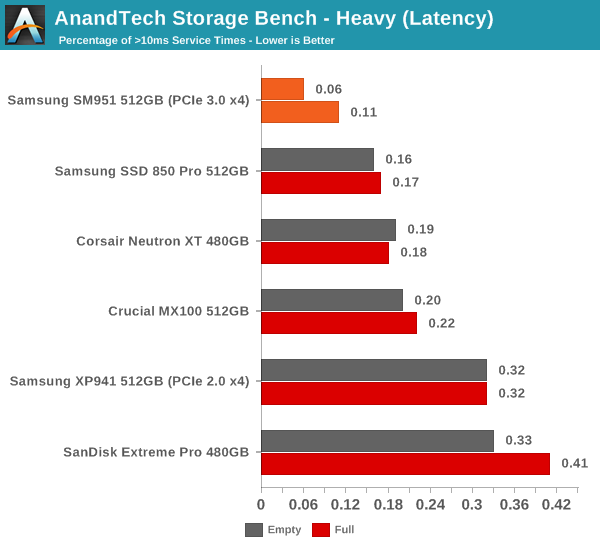
The share of high latency IOs is also the lowest with only 0.06% of the IOs having a higher than 10ms service time.


128 Comments
View All Comments
iLovefloss - Tuesday, February 24, 2015 - link
Samsung's first two TLC drives, the 840 and 840 EVO, has some firmware issues that cause month old data to be read slowly. The severity ranges from slower than a speedy HDD to as slow as a SATA2 SSD. Samsung's first patch didn't resolve the issue for all the 840 EVO SSDs suffering from the slowdowns or only temporarily resolved, so Samsung is in the process of making another patch.kgh00007 - Wednesday, February 25, 2015 - link
I have an 840 EVO and I applied the firmware fix in October last year and the reads have dropped again to below 50MB/s on older data, ie. my OS files and stuff that was installed when I first set the drive up.I will be waiting to see how Samsung handle this before I buy another SSD from them. Benchmarks and reviews mean nothing if an SSD drops below HDD read speeds after a few months of real world use.
Cold boot now takes minutes, not seconds!!
3DoubleD - Wednesday, February 25, 2015 - link
Exactly. I have one drive that has sequential read minimums as low as 8.8MB/s and large portions averaging 50MB/s. Another drive is fine and operates at 300MB/s consistently (although I'm pretty sure that should be higher on SATA3, but day-to-day that is fast enough not to notice). They need to squash this bug if they plan on selling TLC drives in the future in any real volume. Enthusiasts will care, which is admittedly a small market, but I think some laptop vendors might begin to take notice and avoid Samsung TLC products as well, and that's a larger market.Irish_adam - Tuesday, February 24, 2015 - link
So when are they going to make a desktop version with a heatsink on it? It seems like everyone is so obsessed with portables these days that the desktop crowed is getting ignored but surely this kind of performance would mainly be used for a desktop machine than an ultra thin laptop. Its my main gripe with PCIe SSDs atmdananski - Tuesday, February 24, 2015 - link
Same occurred to me. Could probably get a substantial boost in long-running operations by attaching a heatsink. Should be easy enough to do yourself - thermal tape and some old vram heatsinks would probably do the trick without being so heavy as to break the pcie slot.I would like to see the rate of heat dissipation after heavy use (i.e. how that temperature graph looks after you stop writing to the disk). It starts throttling after roughly 180GB sequential, which is plenty for most scenarios, but how long does it take to cool back down again for your next big write? Does throttling occur under more mixed, sustained loads like a database server? Not exactly my kind of use cases, but I'd be interested to see.
DanNeely - Tuesday, February 24, 2015 - link
"However, it's nowhere near the maximum bandwidth of the PCIe 3.0 x4 bus, though, which should be about 3.2GB/s (PCIe only has ~80% efficiency with overhead after the 128b/132b scheme used by PCIe 3.0)."Where's the 20% loss coming from? 128/132 bit encoding only has a 3% overhead, is this an incompletely updated copy/paste from a description of PCIe 2.0? The 8/10bit encoding used in the older version did have a 20% penalty.
Kristian Vättö - Tuesday, February 24, 2015 - link
That's the overhead on top of the encoding scheme and is a rough figure based on our own testing with GPU memory bandwidth that will saturate the interface.It's the same in PCIe 2.0 too: the interface is good for 5GT/s per lane, which equals 500MB/s per lane once you take the 8b/10b encoding and bits to bytes translation into account. However, in real world the best bandwidths I've seen have been about 390MB/s per lane.
extide - Tuesday, February 24, 2015 - link
Protocol overhead (NOT the 120/132b part) -- the commands and stuff, interrupt latency from the cpu and other devices, DMA latencies on read/write to main system memory, etc.Hulk - Tuesday, February 24, 2015 - link
Would it be possible to display the entire AS SSD results window?Kristian Vättö - Tuesday, February 24, 2015 - link
I only run the sequential test, but I can certainly switch to running the full test and publishing the results as a screenshot if that's preferred.