Samsung SM951 (512GB) PCIe SSD Review
by Kristian Vättö on February 24, 2015 8:00 AM ESTMixed Random Read/Write Performance
Mixed read/write tests are also a new addition to our test suite. In real world applications a significant portion of workloads are mixed, meaning that there are both read and write IOs. Our Storage Bench benchmarks already illustrate mixed workloads by being based on actual real world IO traces, but until now we haven't had a proper synthetic way to measure mixed performance.
The benchmark is divided into two tests. The first one tests mixed performance with 4KB random IOs at six different read/write distributions starting at 100% reads and adding 20% of writes in each phase. Because we are dealing with a mixed workload that contains reads, the drive is first filled with 128KB sequential data to ensure valid results. Similarly, because the IO pattern is random, I've limited the LBA span to 16GB to ensure that the results aren't affected by IO consistency. The queue depth of the 4KB random test is three.
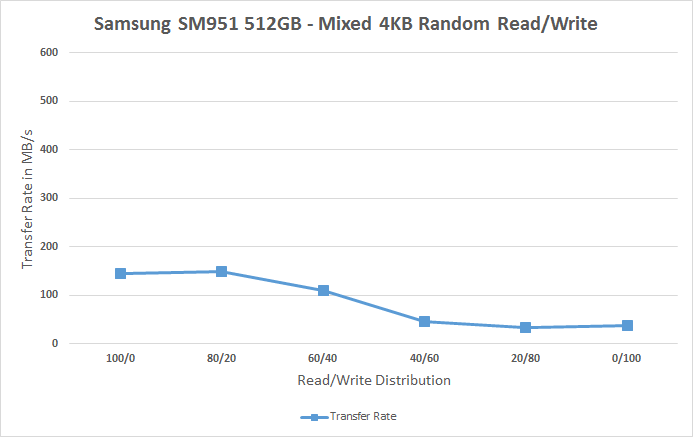
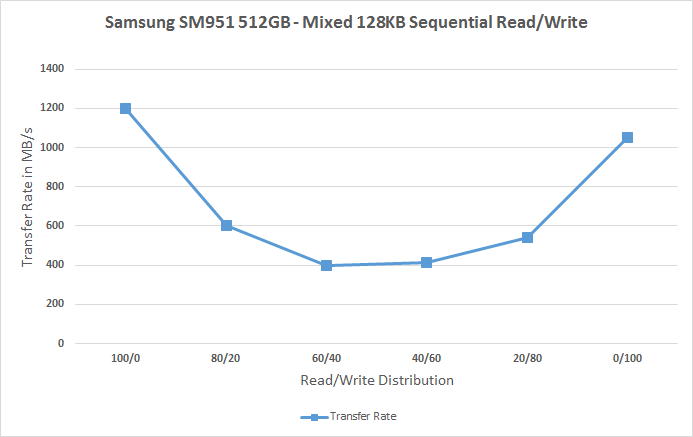
Again, for the sake of readability, I provide both an average based bar graph as well as a line graph with the full data on it. The bar graph represents an average of all six read/write distribution data rates for quick comparison, whereas the line graph includes a separate data point for each tested distribution.
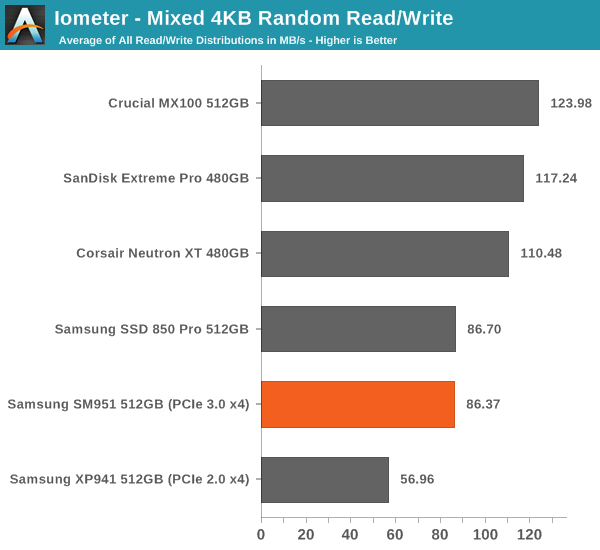
Quite surprisingly the SM951 and Samsung drives in general don't do very well with mixed data.
 |
|||||||||
The reason lies in the fact that the performance of Samsung drives plummets when the share of writes is increased. At 80/20 read/write, the Samsung drives manage to do pretty well, but after that the performance declines to about 40MB/s. What's odd is that the performance is also bad with 100% writes, whereas with other drives we usually see a spike here. I'm guessing there's some garbage collection going on here that causes the performance degradation.
Mixed Sequential Read/Write Performance
The sequential mixed workload tests are also tested with a full drive, but I've not limited the LBA range as that's not needed with sequential data patterns. The queue depth for the tests is one.
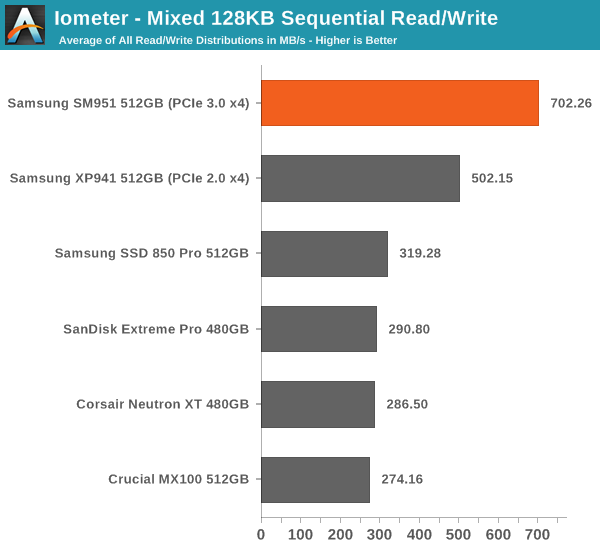
With 128KB sequential data, however, the SM951 is the king of the hill. There's a clear difference between PCIe and SATA based drives, although it's worthy to note that the difference is mostly due to PCIe drives having much higher throughput at 100% reads and writes (i.e. the infamous bathtub curve).
 |
|||||||||


128 Comments
View All Comments
Kristian Vättö - Wednesday, February 25, 2015 - link
I didn't test any OCZ drives for this review because the Vector 180 NDA is due in a couple of days, so stay tuned.IlikeSSD - Thursday, February 26, 2015 - link
Vertex 460A is good enough to show the difference (maybe even Arc))Shadowmaster625 - Wednesday, February 25, 2015 - link
You should clip on a simple heatsink and run the tests again.squatsh - Wednesday, February 25, 2015 - link
Based on the orientation of the drive in it's M2 slot. (Ie is the controller facing up or down) Can it be made clear if we could just put a small thermal pad and one of those tiny heatsinks (like you can get for VRMs) on the controller (assuming that is what is overheating) in order to stop the thermal throttling on desktops and laptops with enough space.Luke212 - Wednesday, February 25, 2015 - link
what happened to the Intel P3500? It's been a year and nothing.Mikemk - Wednesday, February 25, 2015 - link
Comment 100Sorry, couldn't resist
awall13 - Thursday, February 26, 2015 - link
Thanks for the great review. I like the changes in how the data is presented. One idea: In the performance consistency section, the steady-state performance could be presented with a single two-color bar per drive, with the full bar representing the average performance, and the shorter bar representing the average - 1 standard deviation. I'd still keep the second chart showing the standard deviation by itself, perhaps. Just a thought.gseguin - Thursday, February 26, 2015 - link
Performance performance performance. Ok, I get it, its fast and hard to find.Since we saw many issues crop up with the predecessors, with eventual fixes by Samsung, how much confidence is there in the drive itself from Anandtech... You know the controllers, you know the memory, you've covered different company's testing methodologies, how much confidence do you have in this product, and why is that absent from the introduction and final thoughts?
Kristian Vättö - Thursday, February 26, 2015 - link
All Samsung's issues have been related to SSD with planar TLC NAND (i.e. 840 & 840 EVO). There is absolutely no reason to believe that the SM951 shares the issues because it's based on MLC NAND and Samsung's MLC NAND based SSDs have been flawless (830 & 840 Pro).kgh00007 - Saturday, February 28, 2015 - link
Hey, nice article. I like the new SSD test suite. Is there any way to add a long term read consistency test, or any sort of read consistency test in light of the Samsung 840 EVO issues?I'm an 840 EVO user with drops in read speed to below 50Mb/s. In fact I have never gotten the advertised 500MB/s read speeds on any SSD I own. Is that because I am using them as the boot drive?
Do you test with the SSD as a second drive in the system? So taking out the overhead of the OS running on the drive as well as the test suite?
Cheers, keep up the good work, I've been learning from this site for a long time....