MSI 970 Gaming Motherboard Review: Undercutting AM3+ at $100
by Ian Cutress on January 22, 2015 10:00 AM EST- Posted in
- Motherboards
- AMD
- MSI
- Vishera
- AM3+
System Performance
Power Consumption
Power consumption was tested on the system while in a single MSI GTX 770 Lightning GPU configuration with a wall meter connected to the OCZ 1250W power supply. This power supply is Gold rated, and as I am in the UK on a 230-240 V supply, leads to ~75% efficiency > 50W, and 90%+ efficiency at 250W, suitable for both idle and multi-GPU loading. This method of power reading allows us to compare the power management of the UEFI and the board to supply components with power under load, and includes typical PSU losses due to efficiency. These are the real world values that consumers may expect from a typical system (minus the monitor) using this motherboard.
While this method for power measurement may not be ideal, and you feel these numbers are not representative due to the high wattage power supply being used (we use the same PSU to remain consistent over a series of reviews, and the fact that some boards on our test bed get tested with three or four high powered GPUs), the important point to take away is the relationship between the numbers. These boards are all under the same conditions, and thus the differences between them should be easy to spot.
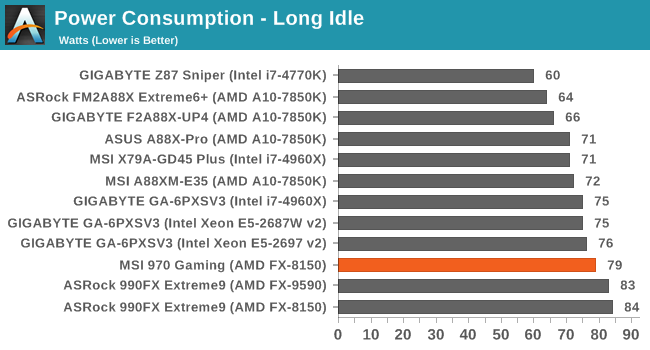
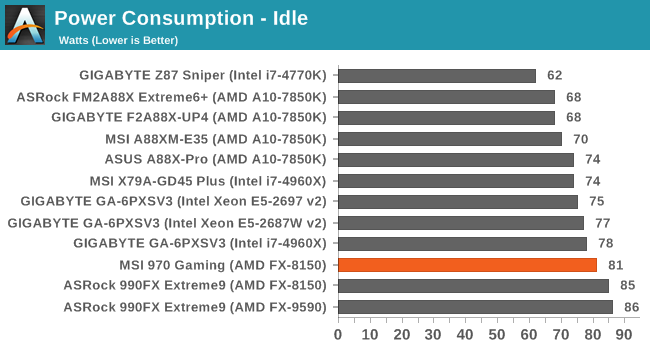
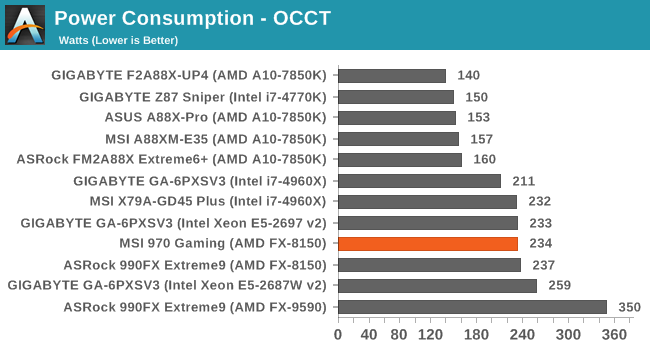
Compared to our 990FX counterpart in the similar test, the 970 Gaming does better at idle, but is relatively evenly matched at load, with the difference equating almost equally to the TDP difference of the chipsets.
Windows 7 POST Time
Different motherboards have different POST sequences before an operating system is initialized. A lot of this is dependent on the board itself, and POST boot time is determined by the controllers on board (and the sequence of how those extras are organized). As part of our testing, we look at the POST Boot Time using a stopwatch. This is the time from pressing the ON button on the computer to when Windows 7 starts loading. (We discount Windows loading as it is highly variable given Windows specific features.)
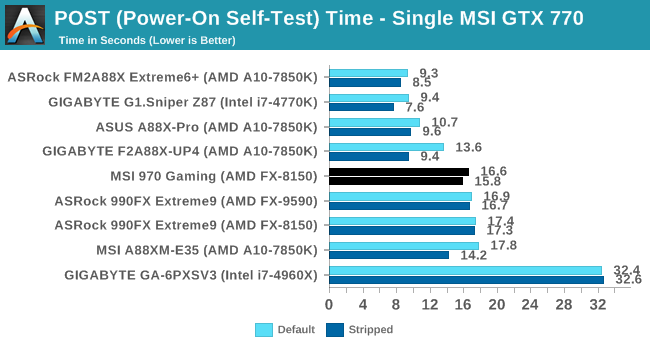
The 970 Gaming has a small leg up against the 990FX during POST.
Rightmark Audio Analyzer 6.2.5
Rightmark:AA indicates how well the sound system is built and isolated from electrical interference (either internally or externally). For this test we connect the Line Out to the Line In using a short six inch 3.5mm to 3.5mm high-quality jack, turn the OS speaker volume to 100%, and run the Rightmark default test suite at 192 kHz, 24-bit. The OS is tuned to 192 kHz/24-bit input and output, and the Line-In volume is adjusted until we have the best RMAA value in the mini-pretest. We look specifically at the Dynamic Range of the audio codec used on board, as well as the Total Harmonic Distortion + Noise.
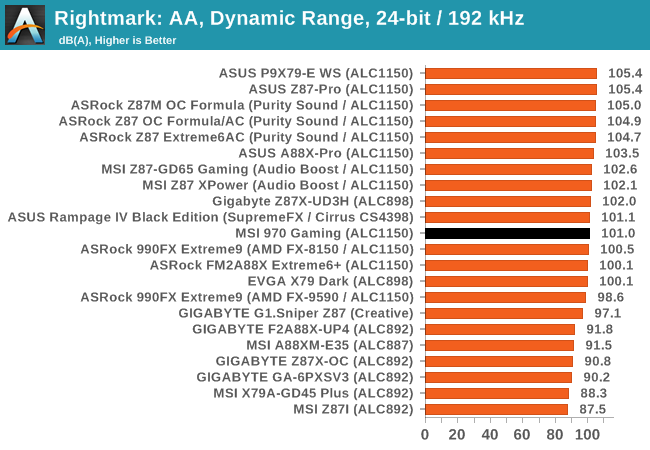
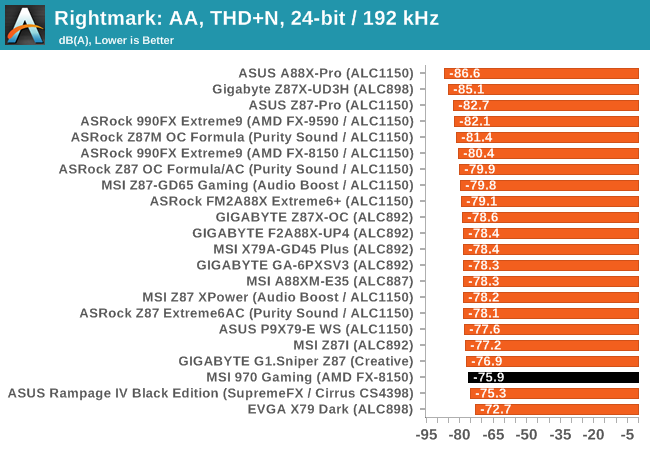
MSI’s board does slightly better in dynamic range, but falls behind a fair bit in THD+N.
USB Backup
For this benchmark, we transfer a set size of files from the SSD to the USB drive using DiskBench, which monitors the time taken to transfer. The files transferred are a 1.52 GB set of 2867 files across 320 folders – 95% of these files are small typical website files, and the rest (90% of the size) are small 30 second HD videos. In an update to pre-Z87 testing, we also run MaxCPU to load up one of the threads during the test which improves general performance up to 15% by causing all the internal pathways to run at full speed.
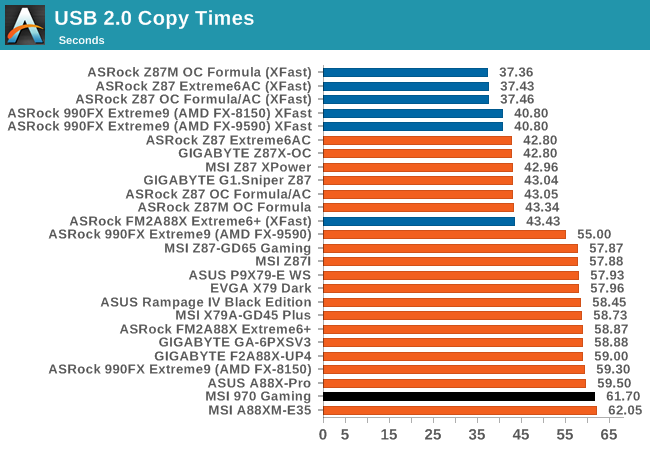
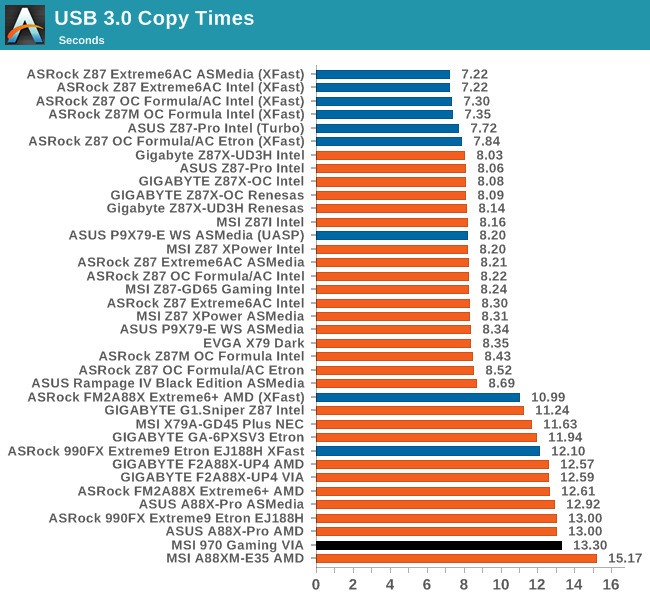
The 970 Gaming is not the best USB performer around.
DPC Latency
Deferred Procedure Call latency is a way in which Windows handles interrupt servicing. In order to wait for a processor to acknowledge the request, the system will queue all interrupt requests by priority. Critical interrupts will be handled as soon as possible, whereas lesser priority requests such as audio will be further down the line. If the audio device requires data, it will have to wait until the request is processed before the buffer is filled.
If the device drivers of higher priority components in a system are poorly implemented, this can cause delays in request scheduling and process time. This can lead to an empty audio buffer and characteristic audible pauses, pops and clicks. The DPC latency checker measures how much time is taken processing DPCs from driver invocation. The lower the value will result in better audio transfer at smaller buffer sizes. Results are measured in microseconds.
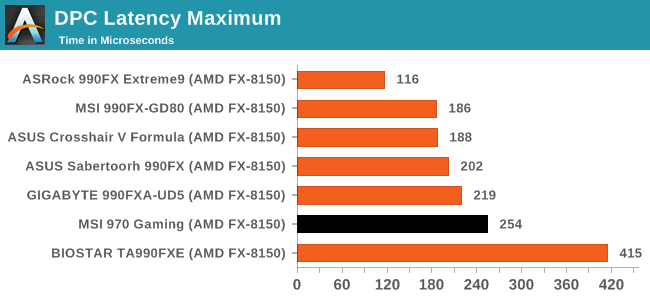
The DPC Latency is often an afterthought for cheaper motherboards, and the 254 microsecond result confirms this. This puts it in the middle of the pack for 900 series boards in general.


37 Comments
View All Comments
Gigaplex - Thursday, January 22, 2015 - link
Instead of spending that money on a new CPU and motherboard, spend it on a GPU instead to get better BF4 performance.Phartindust - Thursday, January 29, 2015 - link
Exactly, use that money towards a R9 290x, 290.tekphnx - Friday, January 23, 2015 - link
I generally agree, but I would say that the $99 FX-6300 and the $115 OEM FX-8310 would be the exceptions that actually stand out as good values from the red team right now - particularly when paired with a 970 board and boosted with a moderate overclock into the ~4.5 ghz range, these chips offer more value vs. the similarly-priced i3 series, albeit with higher power consumption and lacking an upgrade path.rafaelluik - Tuesday, February 24, 2015 - link
What more value? Haswell i3 beats even FX 8350 in 99% of games and beats the FX9590 in 90% of them!TeXWiller - Thursday, January 22, 2015 - link
I took the upgrade dive as due to a offering on 125W fx8370. As I run only at stock speeds, my experience might not be relevant to you. The single module max turbo takes little less power than the 95W thuban with turbo and is faster with modern software, marginally slower on very old test software. I sometimes still launch UT2k4 and the speed improvement is significant. A software 4k 60Hz video playback got 70% improvement. Reflecting this, I wouldn't go near anything slower than the models running at least 4GHz base speed as an upgrade.duploxxx - Thursday, January 22, 2015 - link
looking at figures and benchmarking you are right. but when you look a bit further on general platforms single gpu its not that big difference at all and some even none existing. with examples like 85-95 fps you won't even notice the difference if you would run on ore another.http://www.anandtech.com/show/8427/amd-fx-8370e-cp...
Penti - Thursday, January 22, 2015 - link
Does it matter? AMD has intentionally not released new BD-products or updated chipsets for non-APU and server products. They are not counting on selling broken Bulldozers. They have put their resources on the new architectures instead. You can continue to use an AMD-system if your demands aren't too high, new stuff will come there just isn't any sense buying one today. Buying AMD graphics might not be an easy sell these days either, but R9-290 is still decent and new stuff will come hopefully with HDMI 2.0 support and all that.piroroadkill - Friday, January 23, 2015 - link
" the IPC improvements from Phenom II to current FX chips is marginal at best."I thought it was actually the reverse. I definitely recall seeing the old high end Phenom II X6 outpeform the new Bulldozer chips when they first hit.
Yep: http://www.anandtech.com/show/4955/the-bulldozer-r...
ShieTar - Friday, January 23, 2015 - link
Sure, but there is a difference in IPC between "When Bulldozer first hit" and "current FX":http://anandtech.com/bench/product/1280?vs=700
Phartindust - Thursday, January 29, 2015 - link
The difference is larger than you think:http://anandtech.com/bench/product/102?vs=697