Corsair Neutron XT (240GB, 480GB & 960GB) SSD Review: Phison S10 Debuts
by Kristian Vättö on November 17, 2014 9:00 AM ESTRandom Read/Write Speed
The four corners of SSD performance are as follows: random read, random write, sequential read and sequential write speed. Random accesses are generally small in size, while sequential accesses tend to be larger and thus we have the four Iometer tests we use in all of our reviews.
Our first test writes 4KB in a completely random pattern over an 8GB space of the drive to simulate the sort of random access that you'd see on an OS drive (even this is more stressful than a normal desktop user would see). We perform three concurrent IOs and run the test for 3 minutes. The results reported are in average MB/s over the entire time.
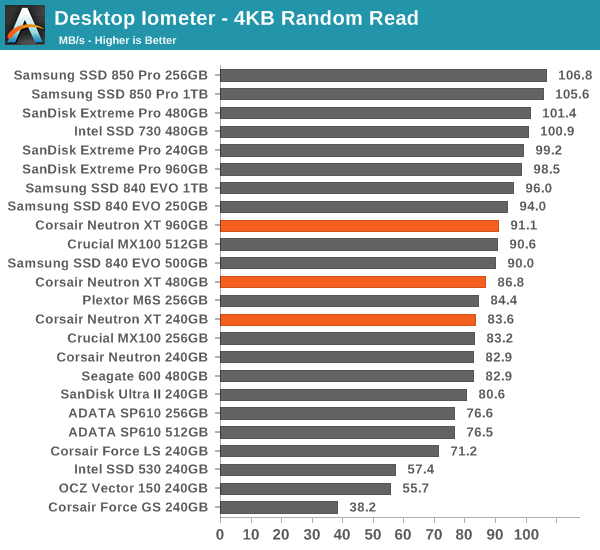
Random read speed gets a boost compared to the Force LS and the Phison finally appears to be on-par with the others.
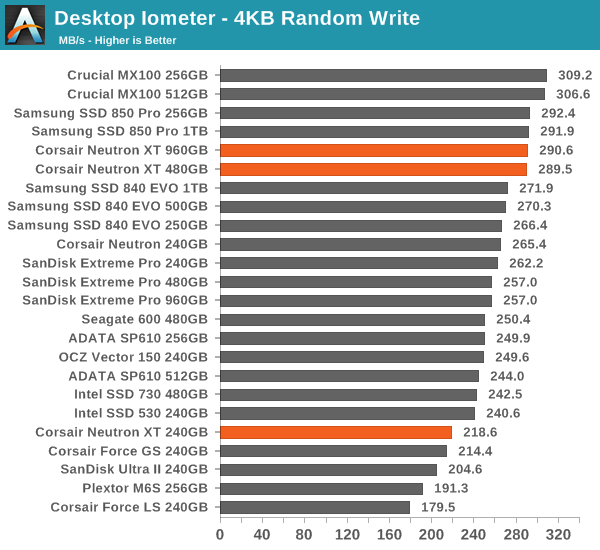
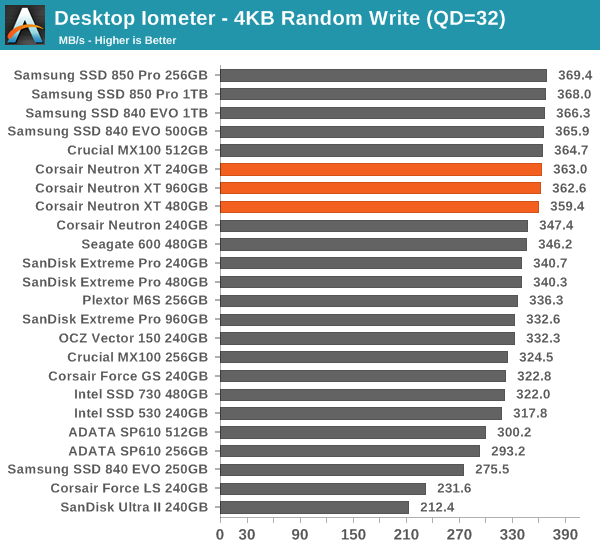
Random write speed is also good, although the 240GB model could perform better at lower queue depths.
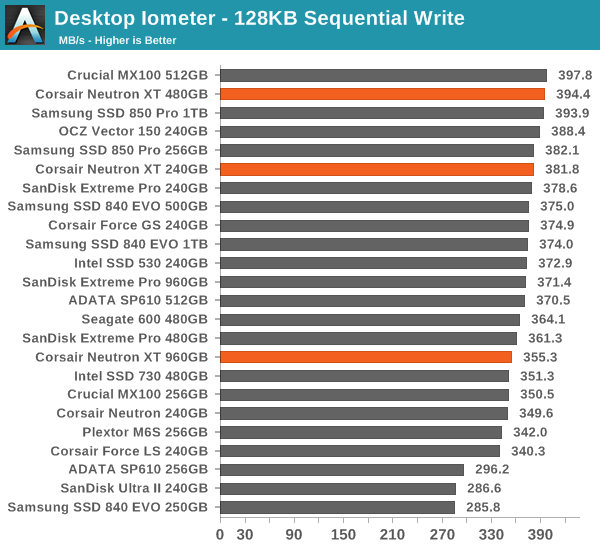
Sequential Read/Write Speed
To measure sequential performance we run a 1 minute long 128KB sequential test over the entire span of the drive at a queue depth of 1. The results reported are in average MB/s over the entire test length.
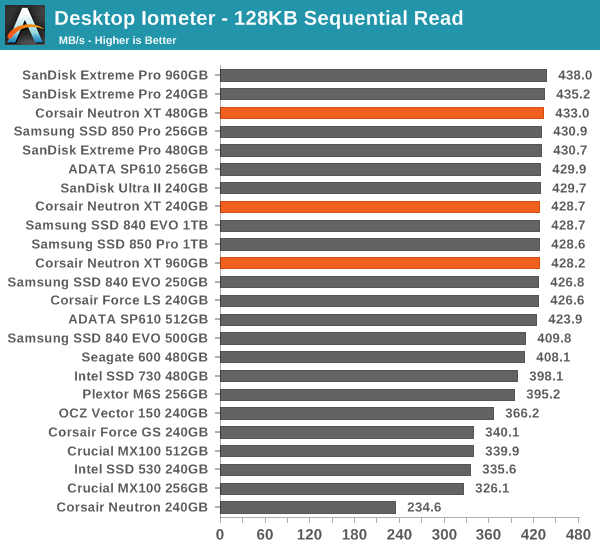
Here we see the performance drop when the capacity increases again. The 960GB model is quite noticeably slower in write speed compared to the rest of the capacities, although at 355MB/s it definitely isn't slow.
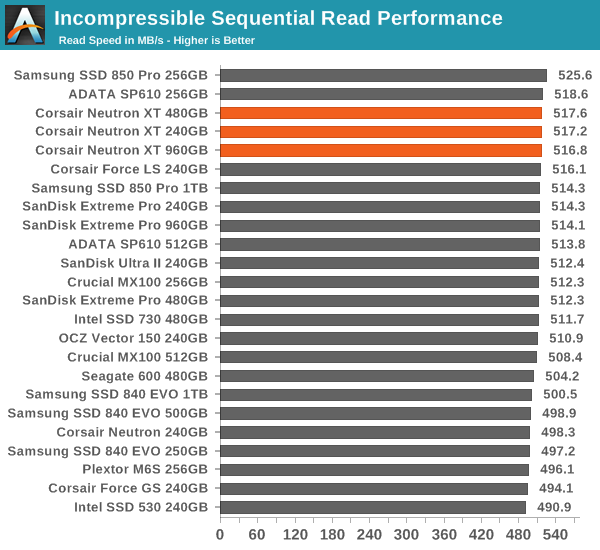
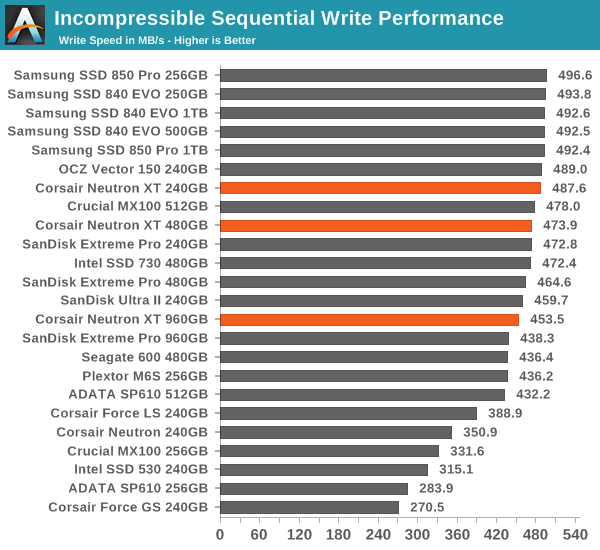
AS-SSD Incompressible Sequential Read/Write Performance
The AS-SSD sequential benchmark uses incompressible data for all of its transfers. The result is a pretty big reduction in sequential write speed on SandForce based controllers, but most other controllers are unaffected.


56 Comments
View All Comments
hojnikb - Monday, November 17, 2014 - link
At this point, we have a better chance of finding Loch Ness Monster than getting sf3700 :)eddieobscurant - Monday, November 17, 2014 - link
epic !!!glugglug - Monday, November 17, 2014 - link
Any endurance testing done?I have a Neutron 512GB (not GTX) and am pretty disppointed at what the wear leveling indicator from SMART data is telling me..... it looks like the 512GB Neutron has an expected write endurance of only 100TB?
Kristian Vättö - Monday, November 17, 2014 - link
I haven't done any endurance testing, but Corsair is rating the Neutron XT at 124TB (according to The Tech Report). Note that the SMART data isn't usually an indication of an expected failure as the threshold has been set by the manufacturer for warranty reasons, so they can determine whether you've exceeded the endurance rating. In that light 100TB is pretty good because most drives are rated at around 70TB or so.Joepublic2 - Monday, November 17, 2014 - link
I'm disappointed to see them dropping the 5 year warranty on the Neutron line. I bought a Neutron and a Neutron GTX for myself and a few dozen for various clients primarily due to the 5 year warranty. Expected endurance figures mean nothing to me as a user if the company isn't willing to back it up with a appropriate warranty.Kristian Vättö - Tuesday, November 18, 2014 - link
Actually, there was an error in the reviewer's guide, so the warranty is indeed 5 years similar to the original Neutron series. I've updated the article as well.glugglug - Sunday, November 23, 2014 - link
That is very reassuring.One other disturbing thing is the raw read error rate reported in SMART. It starts out looking good after a cold boot, then gradually drops to a value of "1" as the system gets a higher uptime. I think this is actually calculated wrong, being a direct mapping from the raw value, which is always identical to the "Soft ECC Correction Rate" raw value (sitting at ~250,000 after about a month of uptime), instead of being calculated based on the rate of change in that raw value like its supposed to be. Corsair SSD Toolbox labels that counter as "informational only", while CrystalDiskInfo, Stablebit Scanner, & other tools complain when the nominal value crosses the apparent manufacturer suggested threshold of "6" after a week or so.
Restarting Windows does NOT reset the counter -- it gets reset only by a cold boot.
extide - Monday, November 17, 2014 - link
That wear leveling indicator has very little to do with ACTUAL flash lifetime. It is mostly to do with giving the manufacturer the ability to determine when warranty has expired.sonicmerlin - Monday, November 17, 2014 - link
It's really kinda cool these things have quad core processors now.On a side note, does anyone know when someone other than Samsung is going to release 3D NAND?
Kristian Vättö - Tuesday, November 18, 2014 - link
IMFT (i.e. Micron and Intel) is next year and so is SK Hynix. Toshiba/SanDisk is H1'16.