The Intel Haswell-E X99 Motherboard Roundup with ASUS, GIGABYTE, ASRock and MSI
by Ian Cutress on September 25, 2014 11:30 AM ESTSystem Benchmarks
Power Consumption
Power consumption was tested on the system while in a single MSI GTX 770 Lightning GPU configuration with a wall meter connected to the OCZ 1250W power supply. This power supply is Gold rated, and as I am in the UK on a 230-240 V supply, leads to ~75% efficiency > 50W, and 90%+ efficiency at 250W, suitable for both idle and multi-GPU loading. This method of power reading allows us to compare the power management of the UEFI and the board to supply components with power under load, and includes typical PSU losses due to efficiency. These are the real world values that consumers may expect from a typical system (minus the monitor) using this motherboard.
While this method for power measurement may not be ideal, and you feel these numbers are not representative due to the high wattage power supply being used (we use the same PSU to remain consistent over a series of reviews, and the fact that some boards on our test bed get tested with three or four high powered GPUs), the important point to take away is the relationship between the numbers. These boards are all under the same conditions, and thus the differences between them should be easy to spot.
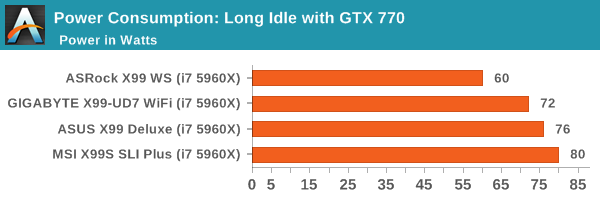
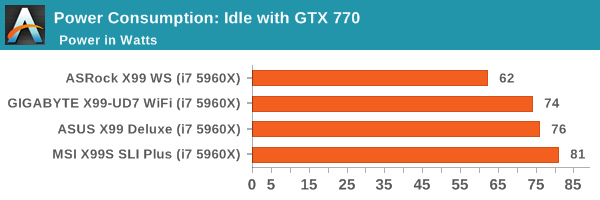
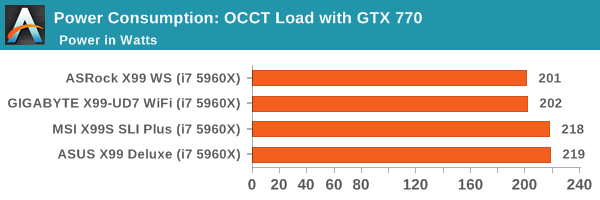
The ASRock leads the way in power consumption across the board, although the GIGABYTE has the smallest idle-to-peak delta. It will be interesting to see if this 20W window during our OCCT tests is prevalent among other X99 motherboards.
Windows 7 POST Time
Different motherboards have different POST sequences before an operating system is initialized. A lot of this is dependent on the board itself, and POST boot time is determined by the controllers on board (and the sequence of how those extras are organized). As part of our testing, we look at the POST Boot Time using a stopwatch. This is the time from pressing the ON button on the computer to when Windows 7 starts loading. (We discount Windows loading as it is highly variable given Windows specific features.)
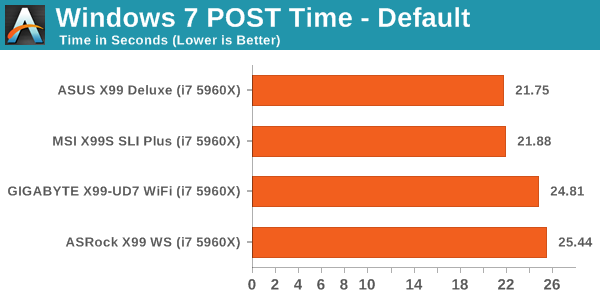
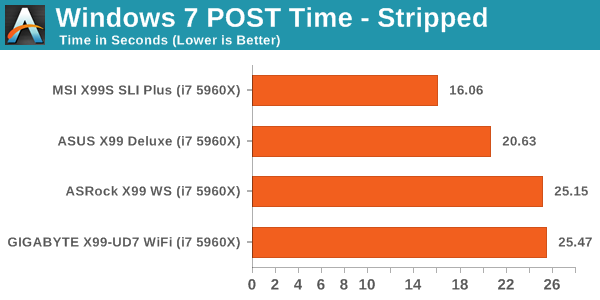
The new X99 POST sequence involves a fair amount of DRAM training (testing and verifying speeds) which adds an abnormal amount of time to the POST sequence. This is why every motherboard at default scores above 21 seconds. Not only this, but most of these BIOSes are not fully optimized in order to save time. X99 launch was rushed due to Intel, so it might be the case that we see faster times later on in the life cycle of the platform.
Rightmark Audio Analyzer 6.2.5
Rightmark:AA indicates how well the sound system is built and isolated from electrical interference (either internally or externally). For this test we connect the Line Out to the Line In using a short six inch 3.5mm to 3.5mm high-quality jack, turn the OS speaker volume to 100%, and run the Rightmark default test suite at 192 kHz, 24-bit. The OS is tuned to 192 kHz/24-bit input and output, and the Line-In volume is adjusted until we have the best RMAA value in the mini-pretest. We look specifically at the Dynamic Range of the audio codec used on board, as well as the Total Harmonic Distortion + Noise.
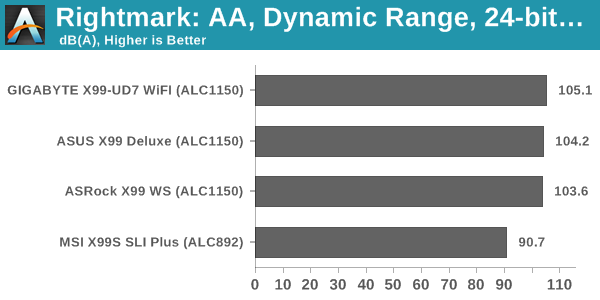
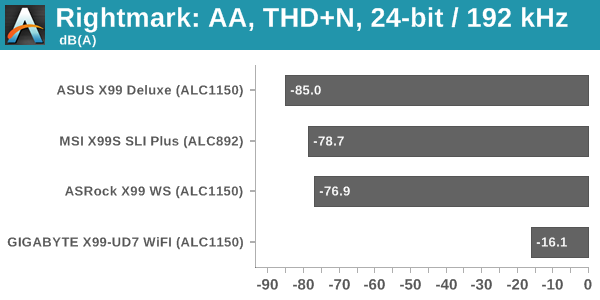
The ASUS takes the lead in THD+N by a long way, and the differences between the ALC1150s and the ALC892 in the MSI show up in the Dynamic Range tests. Unfortunately the GIGABYTE had an issue with its test, causing high levels of software-detectable distortion at high volume levels.
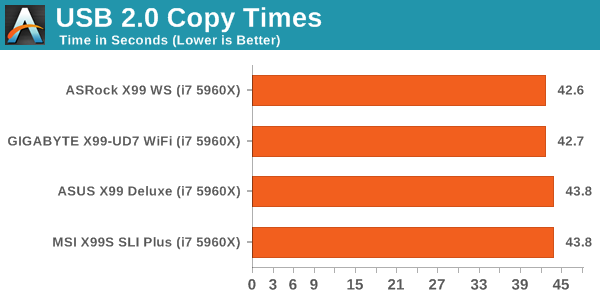
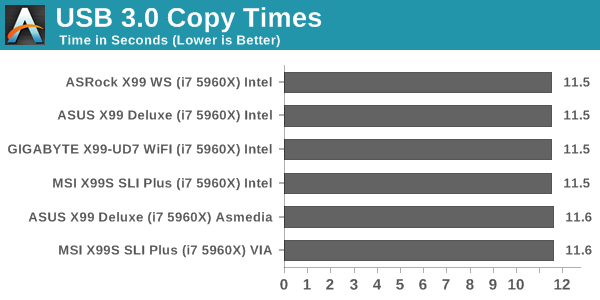
USB Backup
For this benchmark, we transfer a set size of files from the SSD to the USB drive using DiskBench, which monitors the time taken to transfer. The files transferred are a 1.52 GB set of 2867 files across 320 folders – 95% of these files are small typical website files, and the rest (90% of the size) are small 30 second HD videos. In an update to pre-Z87 testing, we also run MaxCPU to load up one of the threads during the test which improves general performance up to 15% by causing all the internal pathways to run at full speed.
DPC Latency
Deferred Procedure Call latency is a way in which Windows handles interrupt servicing. In order to wait for a processor to acknowledge the request, the system will queue all interrupt requests by priority. Critical interrupts will be handled as soon as possible, whereas lesser priority requests such as audio will be further down the line. If the audio device requires data, it will have to wait until the request is processed before the buffer is filled.
If the device drivers of higher priority components in a system are poorly implemented, this can cause delays in request scheduling and process time. This can lead to an empty audio buffer and characteristic audible pauses, pops and clicks. The DPC latency checker measures how much time is taken processing DPCs from driver invocation. The lower the value will result in better audio transfer at smaller buffer sizes. Results are measured in microseconds.
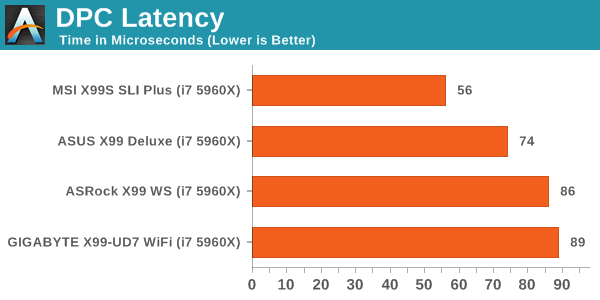
DPC for X99 is quite impressive all around, with every motherboard scoring under 100 microseconds.


62 Comments
View All Comments
hunterx2210 - Monday, August 10, 2015 - link
If you want to build the next gen PC, go for this one. => YesAnd the game later then 2015 soon will required DDR4 ?? To get better performance ? => I dunno and not so sure. These X99 already overkill
Grimmy347 - Tuesday, January 12, 2016 - link
So if I have the GA-X99-UD4 Motherboard with the I7 5820k Chip and then two way sli(2x980gtx) will the x16x8 rather then x16x16 i would get with a higher i7 core actually make any difference in performance? Also, does that extra card make any performance difference running at only x8? Thanks!!