The NVIDIA GeForce GTX 980 Review: Maxwell Mark 2
by Ryan Smith on September 18, 2014 10:30 PM ESTThief
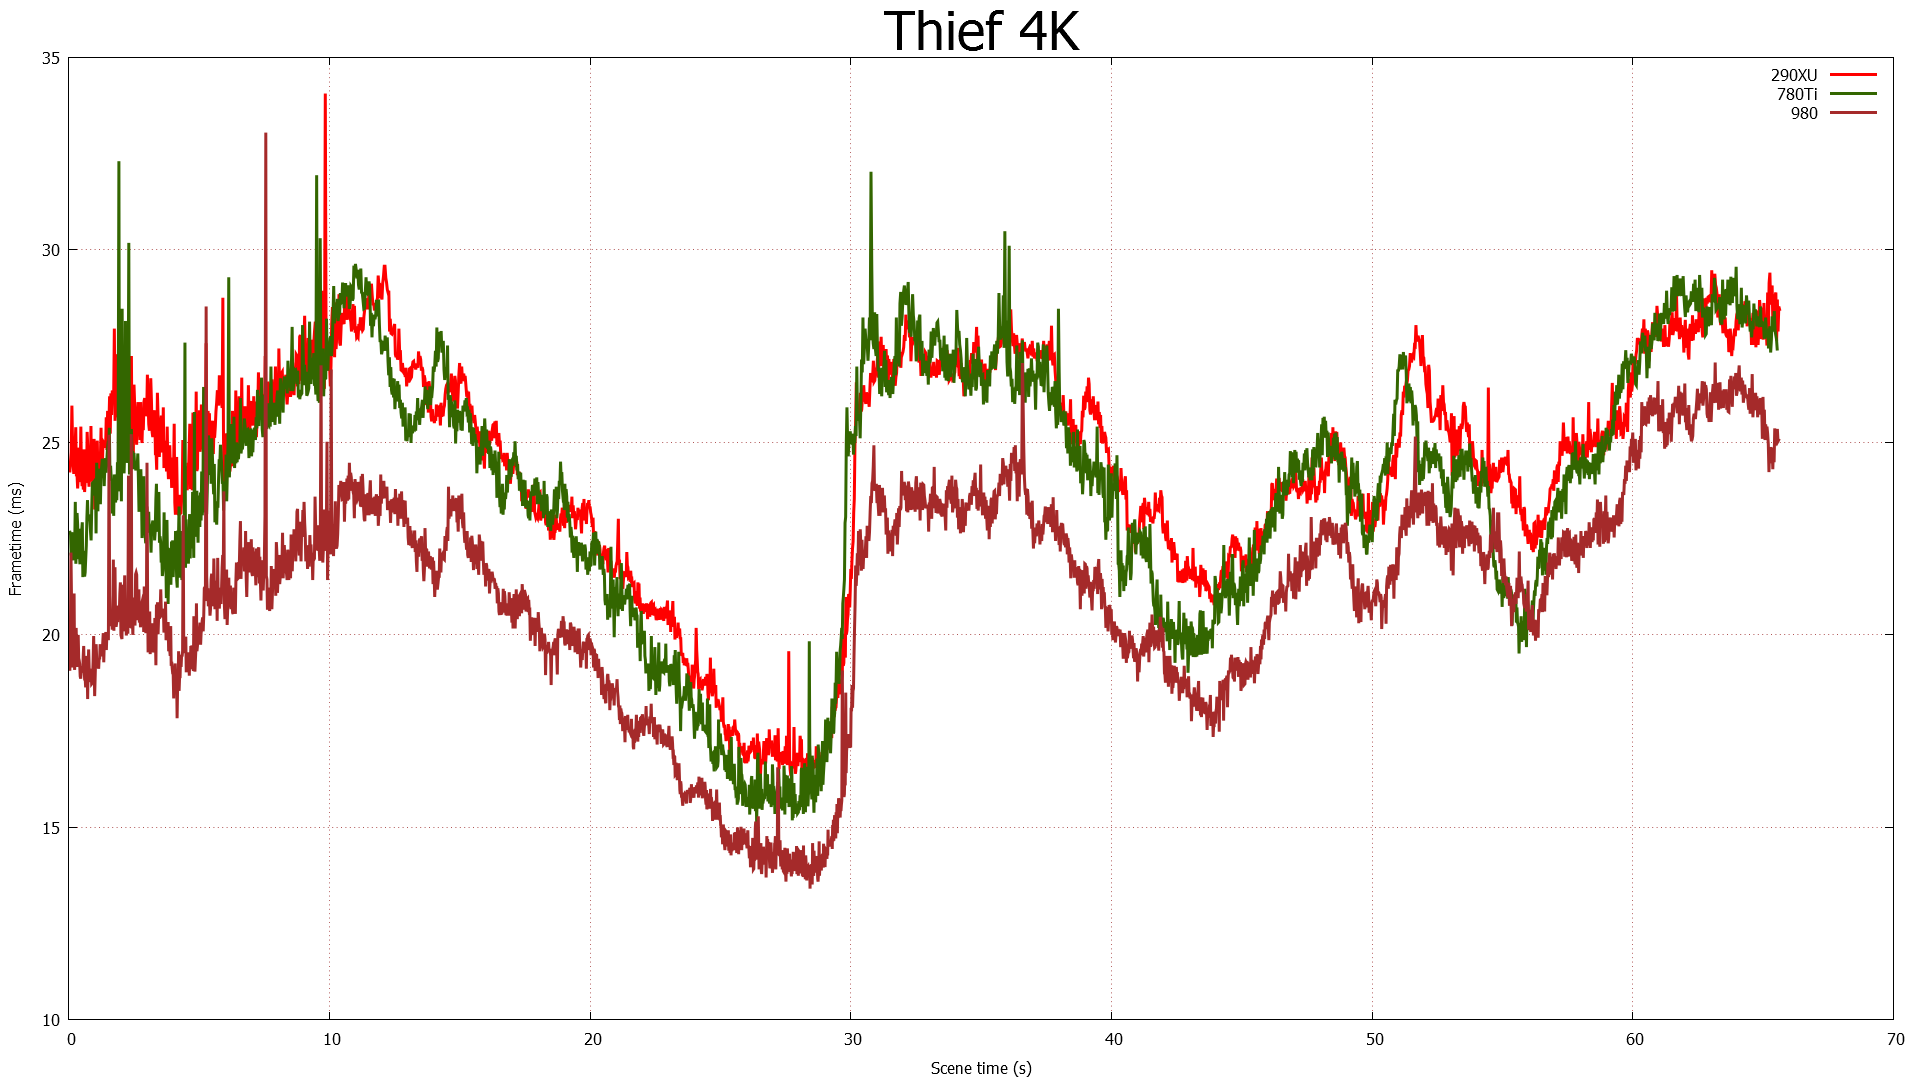
Our latest addition to our benchmark suite is Eidos Monreal’s stealth action game, Thief. Set amidst a Victorian-era fantasy environment, Thief is an Unreal Engine 3 based title which makes use of a number of supplementary Direct3D 11 effects, including tessellation and advanced lighting. Adding further quality to the game on its highest settings is support for SSAA, which can eliminate most forms of aliasing while bringing even the most powerful video cards to their knees.
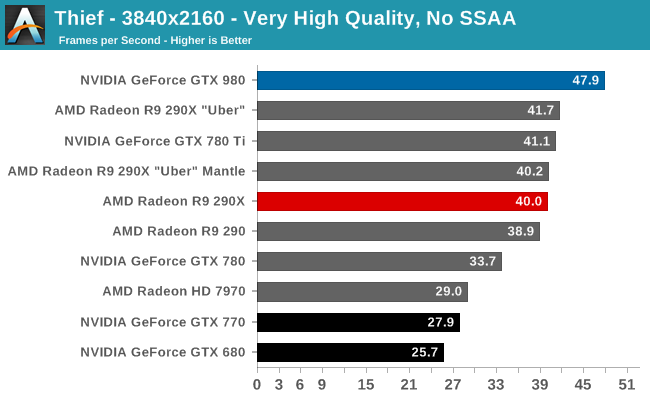
Thief is another solid win for the GTX 980. The closest anyone gets to it is within 10%, and the lead only widens from there. Against the GTX 780 Ti, this is a lead of anywhere between 10% and 16%, and against the R9 290 XU it’s 15-22%; Mantle doing the card no favors for average framerates above 1080p.
The performance advantage over the GTX 780 and GTX 680 is also above average. GTX 980 can outrun the previous x80 card by 33% or more, and the GTX 680 by at least 80%.
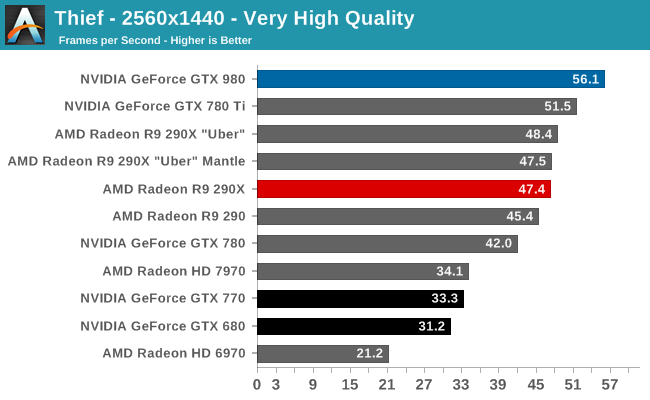
On an absolute basis the GTX 980 won’t quite crack 60fps at 1440p, but it does come very close at 56fps. And since thief is running an internal form of SSAA, turning up the resolution to 4K and dropping the SSAA still yields playable framerates, though at 48fps it’s closer to 45 than 60. 60fps is going to require a bit more horsepower than what a single GTX 980 can deliver today.
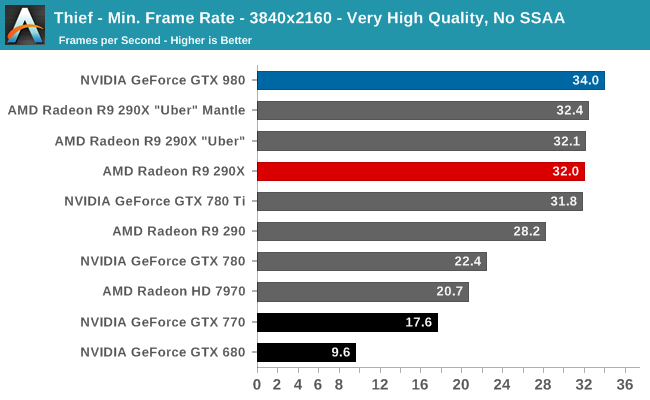
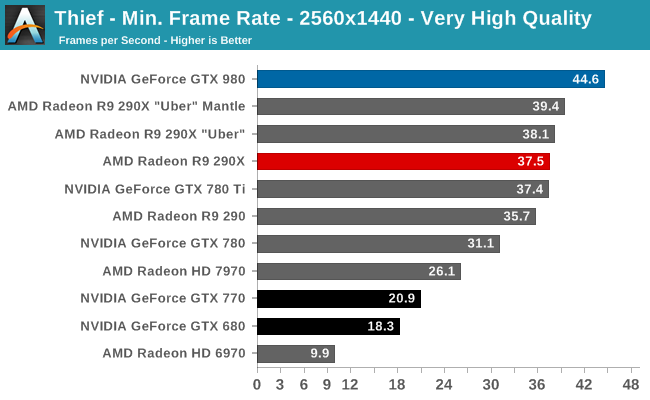
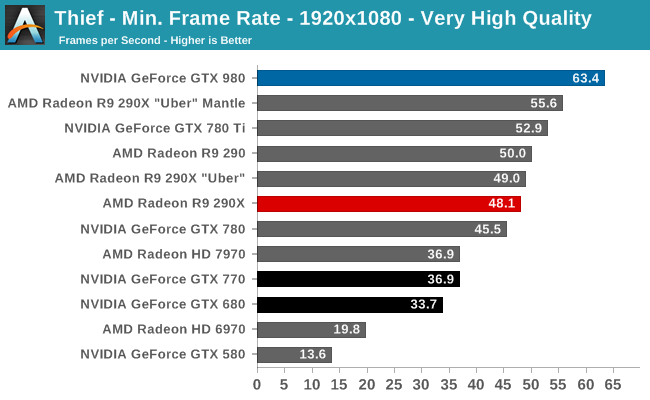
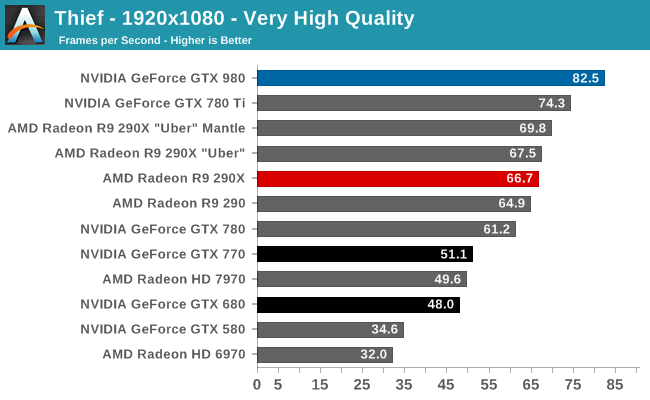
The GTX 980’s performance advantage generally holds up when it comes to minimum framerates as well. Though it is interesting to note that until we get to 4K, the GTX 980 holds a larger minimum framerate advantage over the GTX 780 Ti than it does an average framerate advantage – 20% verus about 10%. On the other hand the use of Mantle begins to close the gap for the R9 290XU a bit, but it’s still not enough to make up for the GTX 980’s strong overall performance advantage, especially at 1080p.
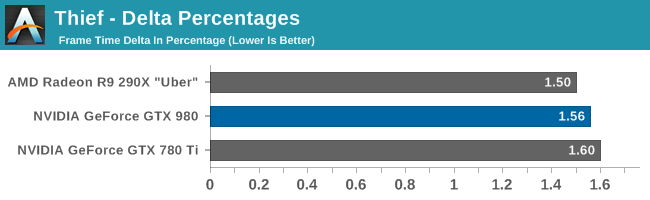
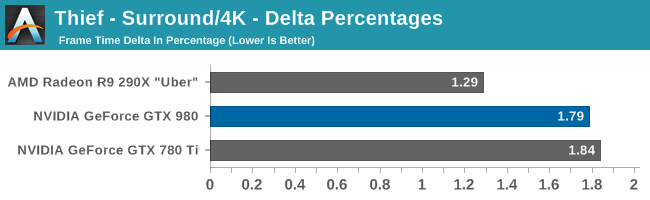
Our delta percentages are once more unremarkable. All cards are consistently below 3% here.


274 Comments
View All Comments
kron123456789 - Friday, September 19, 2014 - link
Look at "Load Power Consuption — Furmark" test. It's 80W lower with 980 than with 780Ti.Carrier - Friday, September 19, 2014 - link
Yes, but the 980's clock is significantly lowered for the FurMark test, down to 923MHz. The TDP should be fairly measured at speeds at which games actually run, 1150-1225MHz, because that is the amount of heat that we need to account for when cooling the system.Ryan Smith - Friday, September 19, 2014 - link
It doesn't really matter what the clockspeed is. The card is gated by both power and temperature. It can never draw more than its TDP.FurMark is a pure TDP test. All NVIDIA cards will reach 100% TDP, making it a good way to compare their various TDPs.
Carrier - Friday, September 19, 2014 - link
If that is the case, then the charts are misleading. GTX 680 has a 195W TDP vs. GTX 770's 230W (going by Wikipedia), but the 680 uses 10W more in the FurMark test.I eagerly await your GTX 970 report. Other sites say that it barely saves 5W compared to the GTX 980, even after they correct for factory overclock. Or maybe power measurements at the wall aren't meant to be scrutinized so closely :)
Carrier - Friday, September 19, 2014 - link
To follow up: in your GTX 770 review from May 2013, you measured the 680 at 332W in FurMark, and the 770 at 383W in FurMark. Those numbers seem more plausible.Ryan Smith - Saturday, September 20, 2014 - link
680 is a bit different because it's a GPU Boost 1.0 card. 2.0 included the hard TDP and did away with separate power targets. Actually what you'll see is that GTX 680 wants to draw 115% TDP with NVIDIA's current driver set under FurMark.Carrier - Saturday, September 20, 2014 - link
Thank you for the clarification.wanderer27 - Friday, September 19, 2014 - link
Power at the wall (AC) is going to be different than power at the GPU - which is coming from the DC PSU.There are loses and efficiency difference in converting from AC to DC (PSU), plus a little wiggle from MB and so forth.
solarscreen - Friday, September 19, 2014 - link
Here you go:http://books.google.com/books?id=v3-1hVwHnHwC&...
PhilJ - Saturday, September 20, 2014 - link
As stated in the article, the power figures are total system power draw. The GTX980 is throwing out nearly double the FPS of the GTX680, so this is causing the rest of the system (mostly the CPU) to work harder to feed the card. This in tun drives the total system power consumption up, despite the fact the GTX980 itself is drawing less power than the GTX680.