The NVIDIA GeForce GTX 980 Review: Maxwell Mark 2
by Ryan Smith on September 18, 2014 10:30 PM ESTCrysis 3
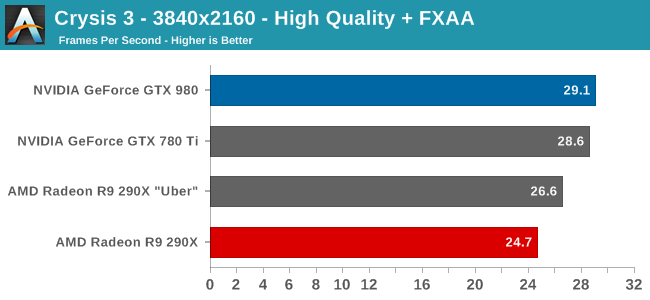
Still one of our most punishing benchmarks, Crysis 3 needs no introduction. With Crysis 3, Crytek has gone back to trying to kill computers and still holds “most punishing shooter” title in our benchmark suite. Only in a handful of setups can we even run Crysis 3 at its highest (Very High) settings, and that’s still without AA. Crysis 1 was an excellent template for the kind of performance required to drive games for the next few years, and Crysis 3 looks to be much the same for 2014.
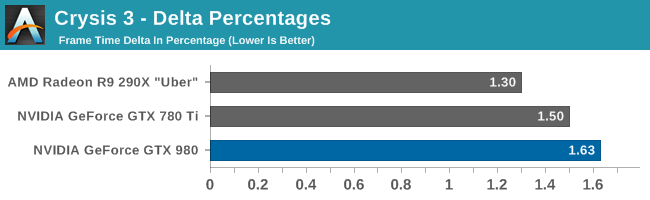
Meanwhile delta percentage performance is extremely strong here. Everyone, including the GTX 980, is well below 3%.
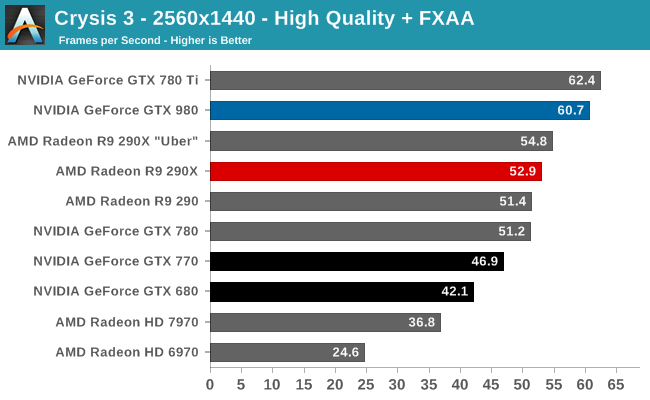
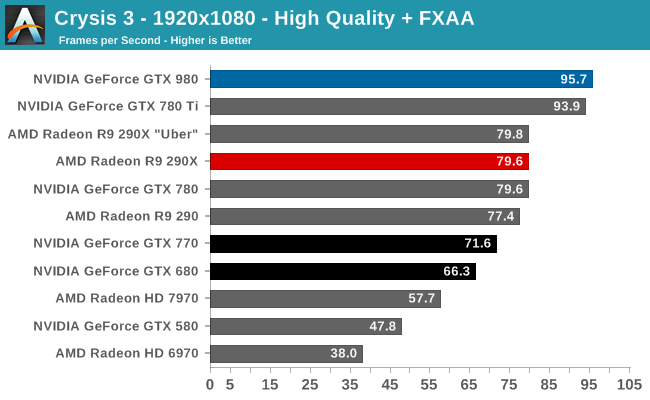
Always a punishing game, Crysis 3 ends up being one of the only games the GTX 980 doesn’t take a meaningful lead on over the GTX 780 Ti. To be clear the GTX 980 wins in most of these benchmarks, but not in all of them, and even when it does win the GTX 780 Ti is never far behind. For this reason the GTX 980’s lead over the GTX 780 Ti and the rest of our single-GPU video cards is never more than a few percent, even at 4K. Otherwise at 1440p we’re looking at the tables being turned, with the GTX 980 taking a 3% deficit. This is the only time the GTX 980 will lose to NVIDIA’s previous generation consumer flagship.
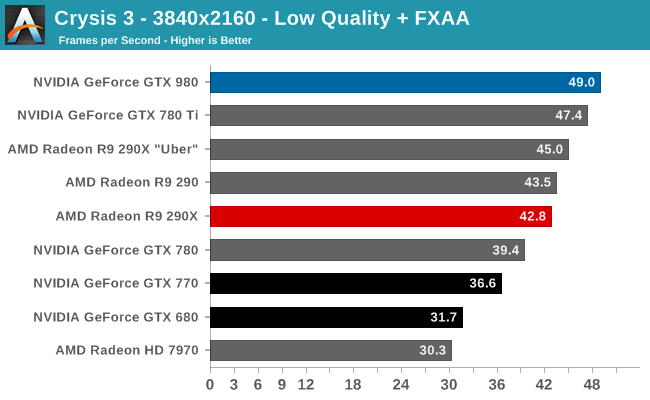
As for the comparison versus AMD’s cards, NVIDIA has been doing well in Crysis 3 and that extends to the GTX 980 as well. The GTX 980 takes a 10-20% lead over the R9 290XU depending on the resolution, with its advantage shrinking as the resolution grows. During the launch of the R9 290 series we saw that AMD tended to do better than NVIDIA at higher resolutions, and while this pattern has narrowed some, it has not gone away. AMD is still the most likely to pull even with the GTX 980 at 4K resolutions, despite the additional ROPS available to the GTX 980.
This will also be the worst showing for the GTX 980 relative to the GTX 680. GTX 980 is still well in the lead, but below 4K that lead is just 44%. NVIDIA can’t even do 50% better than the GTX 680 in this game until we finally push the GTX 680 out of its comfort zone at 4K.
All of this points to Crysis 3 being very shader limited at these settings. NVIDIA has significantly improved their CUDA core occupancy on Maxwell, but in these extreme situations GTX 980 will still struggle with the CUDA core deficit versus GK110, or the limited 33% increase in CUDA cores versus GTX 680. Which is a feather in Kepler’s cap if anything, showing that it’s not entirely outclassed if given a workload that maps well to its more ILP-sensitive shader architecture.
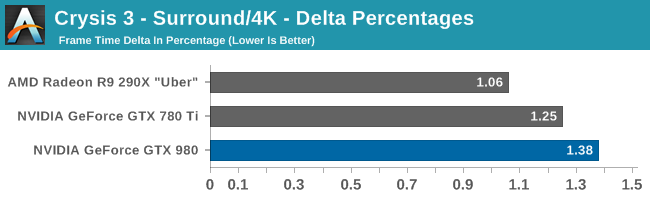
The delta percentage story continues to be unremarkable with Crysis 3. GTX 980 does technically fare a bit worse, but it’s still well under 3%. Keep in mind that delta percentages do become more sensitive at higher framerates (there is less absolute time to pace frames), so a slight increase here is not unexpected.


274 Comments
View All Comments
kron123456789 - Friday, September 19, 2014 - link
Look at "Load Power Consuption — Furmark" test. It's 80W lower with 980 than with 780Ti.Carrier - Friday, September 19, 2014 - link
Yes, but the 980's clock is significantly lowered for the FurMark test, down to 923MHz. The TDP should be fairly measured at speeds at which games actually run, 1150-1225MHz, because that is the amount of heat that we need to account for when cooling the system.Ryan Smith - Friday, September 19, 2014 - link
It doesn't really matter what the clockspeed is. The card is gated by both power and temperature. It can never draw more than its TDP.FurMark is a pure TDP test. All NVIDIA cards will reach 100% TDP, making it a good way to compare their various TDPs.
Carrier - Friday, September 19, 2014 - link
If that is the case, then the charts are misleading. GTX 680 has a 195W TDP vs. GTX 770's 230W (going by Wikipedia), but the 680 uses 10W more in the FurMark test.I eagerly await your GTX 970 report. Other sites say that it barely saves 5W compared to the GTX 980, even after they correct for factory overclock. Or maybe power measurements at the wall aren't meant to be scrutinized so closely :)
Carrier - Friday, September 19, 2014 - link
To follow up: in your GTX 770 review from May 2013, you measured the 680 at 332W in FurMark, and the 770 at 383W in FurMark. Those numbers seem more plausible.Ryan Smith - Saturday, September 20, 2014 - link
680 is a bit different because it's a GPU Boost 1.0 card. 2.0 included the hard TDP and did away with separate power targets. Actually what you'll see is that GTX 680 wants to draw 115% TDP with NVIDIA's current driver set under FurMark.Carrier - Saturday, September 20, 2014 - link
Thank you for the clarification.wanderer27 - Friday, September 19, 2014 - link
Power at the wall (AC) is going to be different than power at the GPU - which is coming from the DC PSU.There are loses and efficiency difference in converting from AC to DC (PSU), plus a little wiggle from MB and so forth.
solarscreen - Friday, September 19, 2014 - link
Here you go:http://books.google.com/books?id=v3-1hVwHnHwC&...
PhilJ - Saturday, September 20, 2014 - link
As stated in the article, the power figures are total system power draw. The GTX980 is throwing out nearly double the FPS of the GTX680, so this is causing the rest of the system (mostly the CPU) to work harder to feed the card. This in tun drives the total system power consumption up, despite the fact the GTX980 itself is drawing less power than the GTX680.