Intel Xeon E5 Version 3: Up to 18 Haswell EP Cores
by Johan De Gelas on September 8, 2014 12:30 PM ESTBenchmark Configuration and Methodology
This review - due to time constraints and a failing RAID controller inside our iSCSI storage - concentrates mostly on the performance and performance/watt of server applications running on top of Ubuntu Server 14.04 LTS. To make things more interesting, we tested 4 different SKUs and included the previous generation Xeon E5-2697v2 (high end Ivy Bridge EP), Xeon E5-2680v2 (mid range Ivy Bridge EP) and E5-2690 (high end Sandy Bridge EP). All test have been done with the help of Dieter and Wannes of the Sizing Servers Lab.
We include the Opteron "Piledriver" 6376 server (configuration here) only for nostalgia and informational purposes. It is clear that AMD does not actively competes in the high end and midrange server CPU market anno 2014.
Intel's Xeon E5 Server – "Wildcat Pass" (2U Chassis)
| CPU |
Two Intel Xeon processor E5-2699 v3 (2.3GHz, 18c, 45MB L3, 145W) |
| RAM | 128GB (8x16GB) Samsung M393A2G40DB0 (RDIMM) 256GB (8x32GB) Samsung M386A4G40DM0 (LRDIMM) |
| Internal Disks | 2x Intel MLC SSD710 200GB |
| Motherboard | Intel Server Board Wilcat pass |
| Chipset | Intel Wellsburg B0 |
| BIOS version | Beta BIOS dating August the 9th, 2014 |
| PSU | Delta Electronics 750W DPS-750XB A (80+ Platinum) |
The 32 GB LRDIMMs were added to the review thanks to the help of IDT and Samsung Semiconductor.
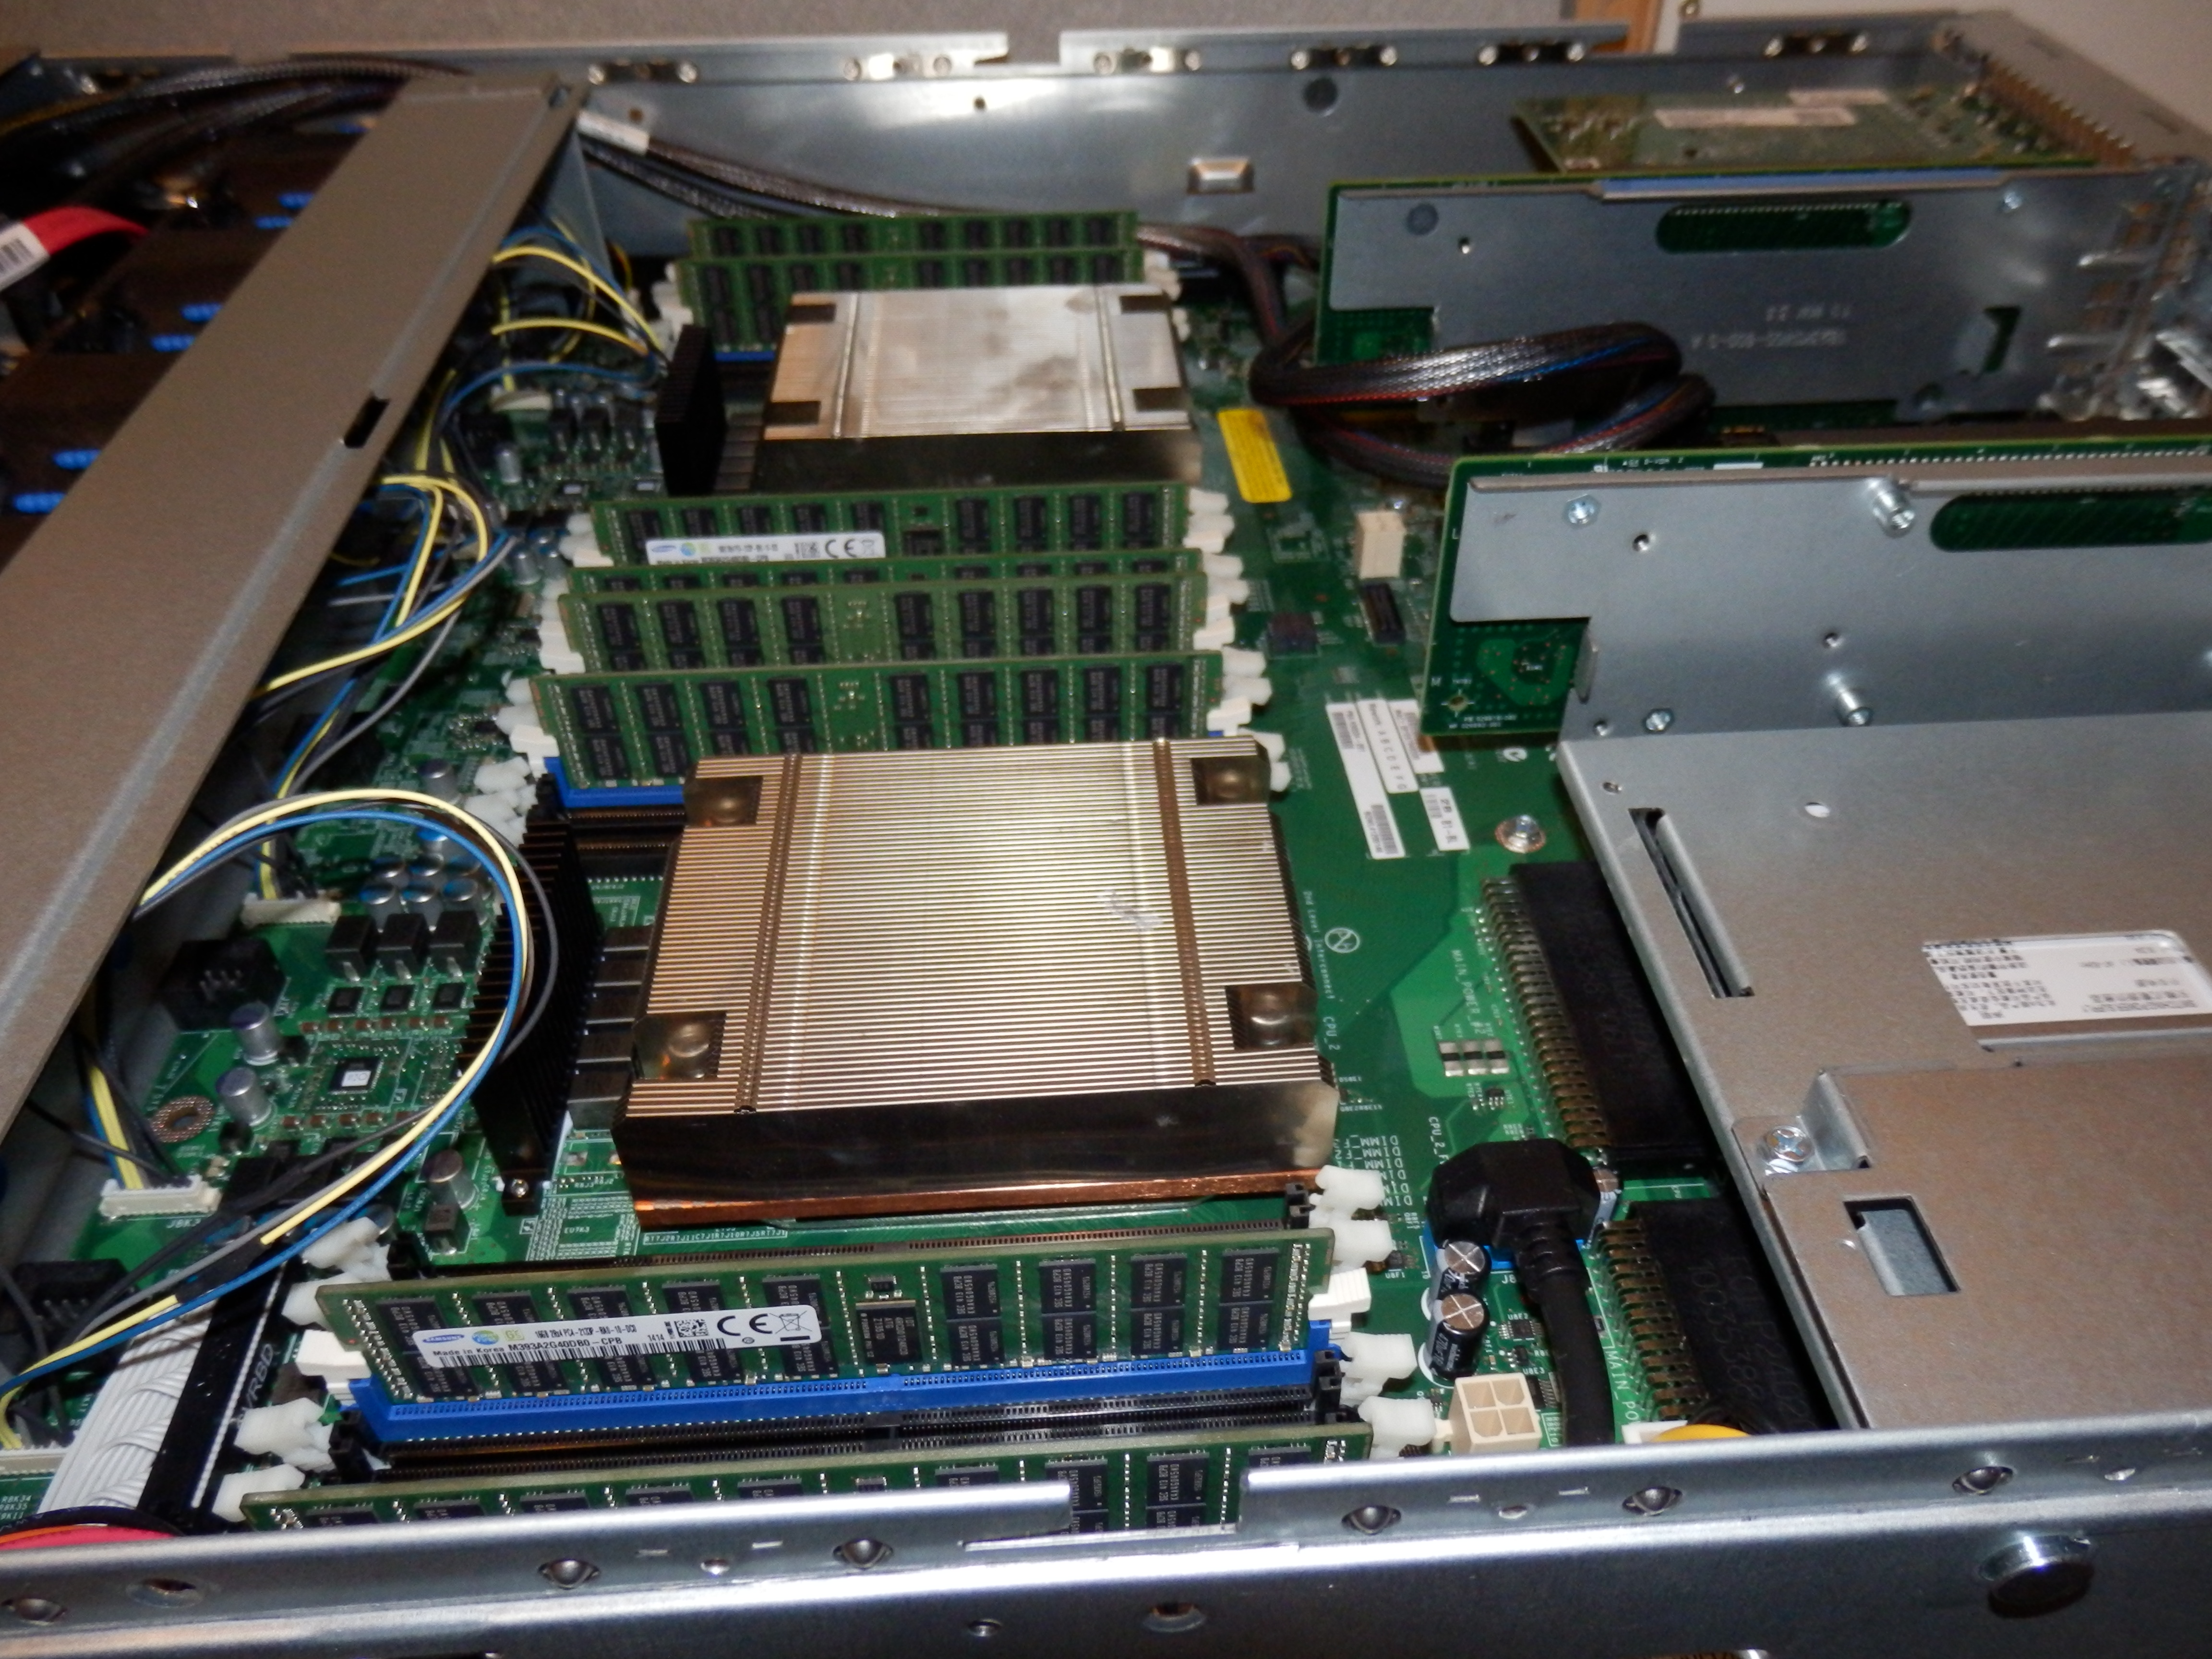
The picture above gives you a look inside the Xeon E5-2600v3 based server.
Supermicro 6027R-73DARF (2U Chassis)
| CPU | Two Intel Xeon processor E5-2697 v2 (2.7GHz, 12c, 30MB L3, 130W) Two Intel Xeon processor E5-2680 v2 (2.8GHz, 10c, 25MB L3, 115W) Two Intel Xeon processor E5-2690 (2.9GHz, 8c, 20MB L3, 135W) |
| RAM | 128GB (8x16GB) Samsung M393A2G40DB0 |
| Internal Disks | 2x Intel MLC SSD710 200GB |
| Motherboard | Supermicro X9DRD-7LN4F |
| Chipset | Intel C602J |
| BIOS version | R 3.0a (December the 6th, 2013) |
| PSU | Supermicro 740W PWS-741P-1R (80+ Platinum) |
All C-states are enabled in both the BIOS.
Other Notes
Both servers are fed by a standard European 230V (16 Amps max.) powerline. The room temperature is monitored and kept at 23°C by our Airwell CRACs. We use the Racktivity ES1008 Energy Switch PDU to measure power consumption. Using a PDU for accurate power measurements might seem pretty insane, but this is not your average PDU. Measurement circuits of most PDUs assume that the incoming AC is a perfect sine wave, but it never is. However, the Rackitivity PDU measures true RMS current and voltage at a very high sample rate: up to 20,000 measurements per second for the complete PDU.


85 Comments
View All Comments
cmikeh2 - Monday, September 8, 2014 - link
In the SKU comparison table you have the E5-2690V2 listed as a 12/24 part when it is in fact a 10/20 part. Just a tiny quibble. Overall a fantastic read.KAlmquist - Monday, September 8, 2014 - link
Also, the 2637 v2 is 4/8, not 6/12.isa - Monday, September 8, 2014 - link
Looking forward to a new supercomputer record using these behemoths.Bruce Allen - Monday, September 8, 2014 - link
Awesome article. I'd love to see Cinebench and other applications tests. We do a lot of rendering (currently with older dual Xeons) and would love to compare these new Xeons versus the new 5960X chips - software license costs per computer are so high that the 5960X setups will need much higher price/performance to be worth it. We actually use Cinema 4D in production so those scores are relevant. We use V-Ray, Mental Ray and Arnold for Maya too but in general those track with the Cinebench scores so they are a decent guide. Thank you!Ian Cutress - Monday, September 8, 2014 - link
I've got some E5 v3 Xeons in for a more workstation oriented review. Look out for that soon :)fastgeek - Monday, September 8, 2014 - link
From my notes a while back... two E5-2690 v3's (all cores + turbo enabled) under 2012 Server yielded 3,129 for multithreaded and 79 for single.While not Haswell, I can tell you that four E5-4657L V2's returned 4,722 / 94 respectively.
Hope that helps somewhat. :-)
fastgeek - Monday, September 8, 2014 - link
I don't see a way to edit my previous comment; but those scores were from Cinebench R15wireframed - Saturday, September 20, 2014 - link
You pay for licenses for render Nodes? Switch to 3DS, and you get 9999 nodes for free (unless they changed the licensing since I last checked). :)Lone Ranger - Monday, September 8, 2014 - link
You make mention that the large core count chips are pretty good about raising their clock rate when only a few cores are active. Under Linux, what is the best way to see actual turbo frequencies? cpuinfo doesn't show live/actual clock rate.JohanAnandtech - Monday, September 8, 2014 - link
The best way to do this is using Intel's PCM. However, this does not work right now (only on Sandy and Ivy, not Haswel) . I deduced it from the fact that performance was almost identical and previous profiling of some of our benchmarks.