SanDisk X300s (512GB) Review
by Kristian Vättö on August 21, 2014 2:15 PM ESTRandom Read/Write Speed
The four corners of SSD performance are as follows: random read, random write, sequential read and sequential write speed. Random accesses are generally small in size, while sequential accesses tend to be larger and thus we have the four Iometer tests we use in all of our reviews.
Our first test writes 4KB in a completely random pattern over an 8GB space of the drive to simulate the sort of random access that you'd see on an OS drive (even this is more stressful than a normal desktop user would see). We perform three concurrent IOs and run the test for 3 minutes. The results reported are in average MB/s over the entire time.
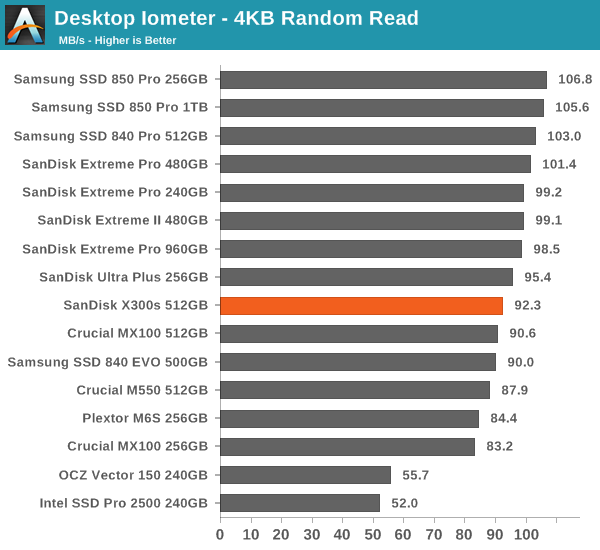
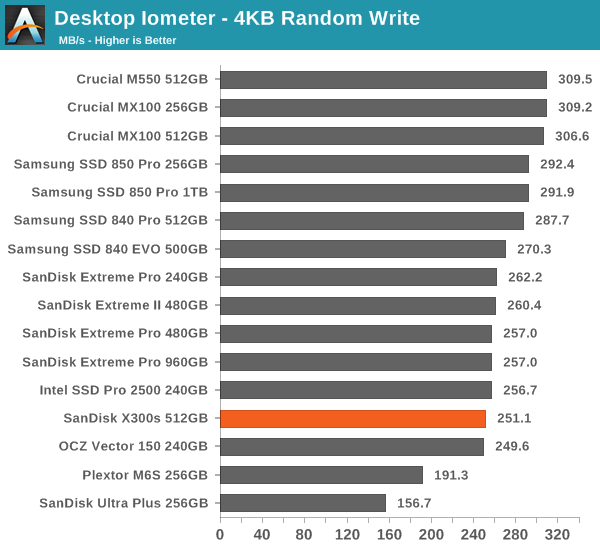
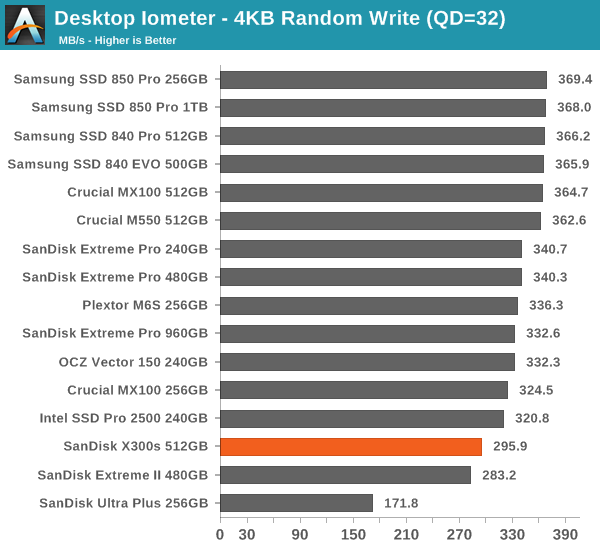
Random performance is similar to the Extreme Pro except for high queue depth write. Most client/corporate workloads do not go above queue depth of 5 anyway, so that should not be a problem.
Sequential Read/Write Speed
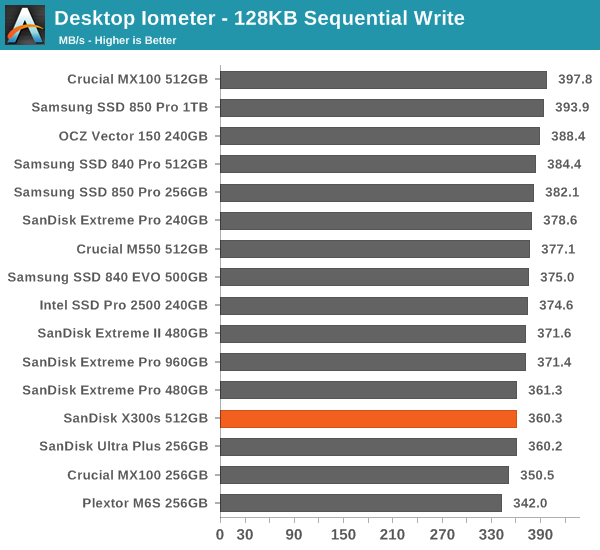
To measure sequential performance we run a 1 minute long 128KB sequential test over the entire span of the drive at a queue depth of 1. The results reported are in average MB/s over the entire test length.
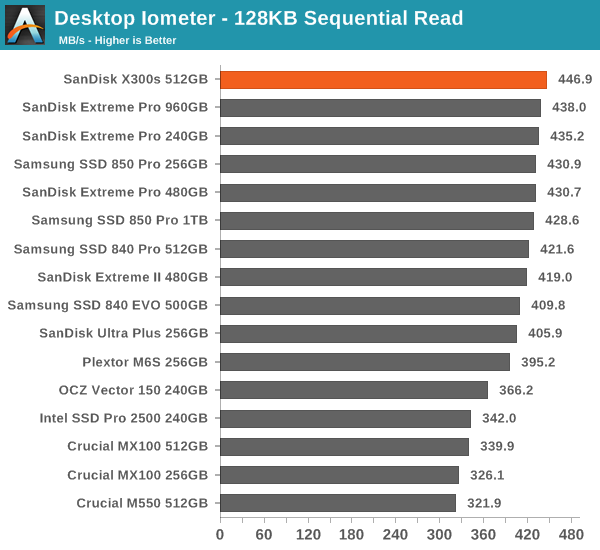
Sequential read performance is excellent and sequential write is okay too, making the X300s equivalent to the Extreme Pro.
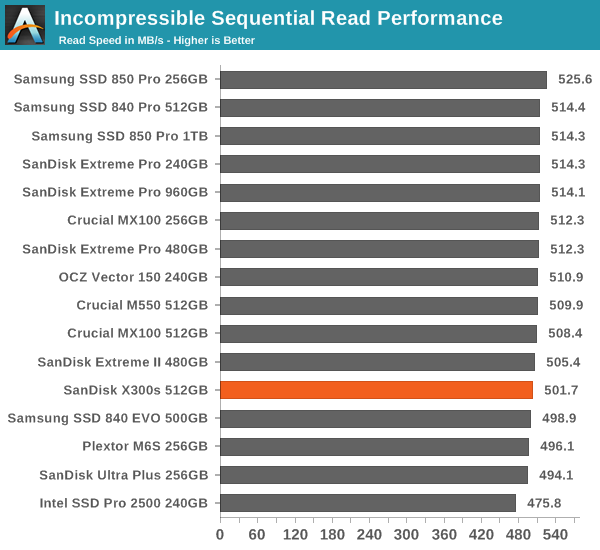
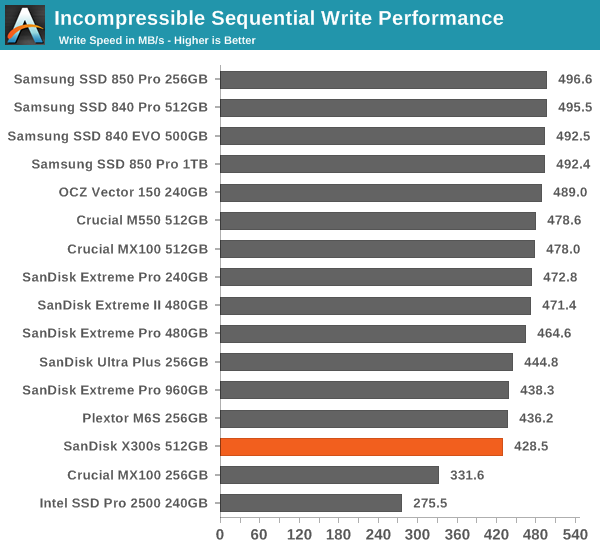
AS-SSD Incompressible Sequential Read/Write Performance
The AS-SSD sequential benchmark uses incompressible data for all of its transfers. The result is a pretty big reduction in sequential write speed on SandForce based controllers, but most other controllers are unaffected.


34 Comments
View All Comments
Death666Angel - Tuesday, August 26, 2014 - link
I'm totally not getting the new drop down menus in the consistency part of the review. I only get one set of data points in the chart even though I can select 2 (different) items. It changes whether I change the first or second part. Can someone explain what it shows me when?doylecc - Tuesday, August 26, 2014 - link
The drop down menus in the consistency part of the review are not working properly. The only way I could make the charts show the performance of the 25% over-provisioning was to choose another SSD from the menu (I chose the A-Data since it is right next to the X300) then change back to the X300. When I did that the chart would update.I had to repeat with the default over-provisioning menu to get the chart to change back. This is a pain and needs to be corrected!
Kristian Vättö - Wednesday, August 27, 2014 - link
I've noticed that too. Let me see if there is something we can do to fix it -- my HTML skills are limited to copy-pasting so I need to ask someone else to have a look at the code.Gonemad - Wednesday, August 27, 2014 - link
I wonder if encryption would affect deduplication in any kind of setup. As far as I know, repeatable patterns that can be compressed are exactly the thing that encryption prevents, and any deduplication effort must happen before the drive is encrypted. Will encryption ALWAYS be transparent?