Samsung SSD 850 Pro (128GB, 256GB & 1TB) Review: Enter the 3D Era
by Kristian Vättö on July 1, 2014 10:00 AM EST3D NAND: Hitting The Reset Button on Scaling
Now that we understand how 3D NAND works, it is time to see what it is all about. As we now know, the problem with 2D NAND is the shrinking cell size and the proximity of the cells, which results in degraded reliability and endurance. Basically, 3D NAND must solve these two issues but it must also remain scalable to be economical. So how does it do that? This is where the third dimension comes into play.
The cost of a semiconductor is proportional to the die size. If you shrink the die, you effectively get more dies from a single wafer, resulting in a lower cost per die. Alternatively you can add more functionality (i.e. transistors) to each die. In the case of NAND, that means you can build a higher capacity die while keeping the die size the same, which gives more gigabits per wafer and thus reducing cost. If you cannot shrink the die, then you have just hit a dead-end because the cost will not scale. That is what has happened with 2D NAND because the shrinks on X and Y axes have run out of gas.
What 3D NAND does is add a Z-axis to the game. Because it stacks cells vertically, it is no longer as dependent on the X and Y axes since the die size can be reduced by adding more layers. As a result, Samsung's V-NAND takes a more relaxed position on the X and Y axes by going back to a 40nm process node, which increases the cell size and leaves more room between individual cells, eliminating the major issues 2D NAND has. The high amount of layers compensates for the much larger process node, resulting in a die that is the same size and capacity as the state of the art 2D NAND dies but without the caveats.
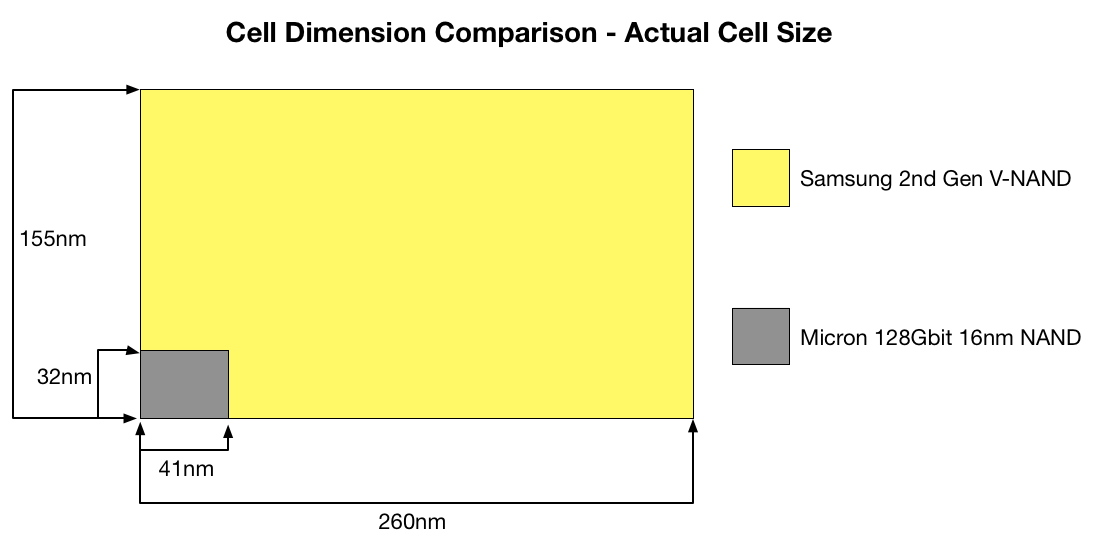
The above graph gives some guidance as to how big each cell in V-NAND really is. On the next page, I will go through the method of how cell size is really calculated and how V-NAND compares with Micron’s 16nm NAND but the above gives a good picture of the benefit that 3D NAND has. Obviously, when each cell is larger and the distance between individual cells is higher, there are more electrons to play with (i.e. more room for voltage state changes) and the cell to cell interference decreases substantially. Those two are the main reasons why V-NAND is capable of achieving up to ten times the endurance of 2D NAND.
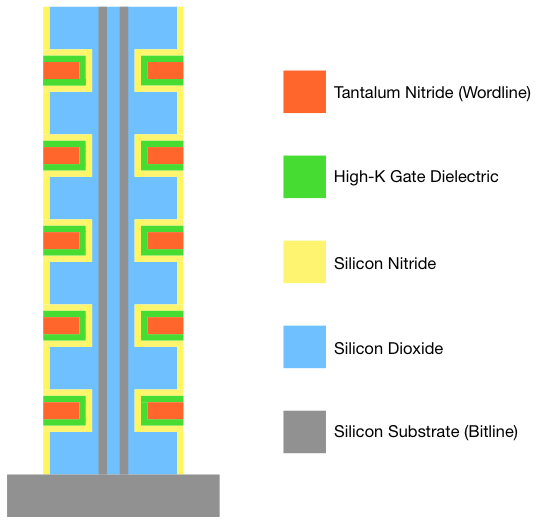
Moreover, scaling in vertical dimension does not have the same limitations as scaling in the X and Y axes do. Because the cost of a semiconductor is still mostly determined by the die area and not by the height, there is no need to cram cells very close to each other. As a result, there is very little interference between the cells even in the vertical direction. Also, the usage of high-K dielectrics means that the control gate does not have to wrap around the charge trap. The result is that there is a hefty barrier of silicon dioxide (which is an insulator) between each cell, which is far more insulating than the rather thin ONO layer in 2D NAND. Unfortunately, I do not know what is the exact distance between each cell in the vertical dimension but I think it is safe to assume that it is noticeably more than the ~20nm in 2D NAND since there is no need for aggressive vertical scaling.
As for how far Samsung believes their V-NAND can scale, their roadmap shows a 1Tbit die planned for 2017. That is very aggressive because it essentially implies that the die capacity will double every year (256Gbit next year, 512Gbit in 2016 and finally 1Tbit in 2017). The most interesting part is that Samsung is confident that they can do this simply by increasing the layer count, meaning that the process node will stay at 40nm.


160 Comments
View All Comments
Cerb - Tuesday, July 1, 2014 - link
The SSD just quitting could brick the drive, and could hose up the FS. Like ECC RAM, if you need power loss protection, you need it regardless of file system. IMO, they should all at least be equipped with enough to gracefully finish in-progress writes and shut down (not necessarily empty buffers, but set up a state that they can be guaranteed to be able to roll back from).sonicology - Tuesday, July 1, 2014 - link
Typo?"Scaling below 20nm was seemed as a major obstacle but the industry was able to cross that..."
seemed a major obstacle or seen as a major obstacle, but not seemed as a major obstacle
Bladen - Tuesday, July 1, 2014 - link
Is it just me, or does the "Performance Consistency" page have interactive charts, all of which are entitled "(SSD name and capacity) - 4KB Random Write (QD32) Performance", but with different results in each of the graphs for the same SSDs and capacities? Also, descriptive text is missing below the last two.I'm presuming they are supposed to be a read and another read or write one, presumably at a lower queue depth.
MrSpadge - Tuesday, July 1, 2014 - link
They're the same data in different scales.paesan - Tuesday, July 1, 2014 - link
I purchased a 512GB MX100 when they first came out for $199. No way the extra speed from the 850 pro is worth over twice the price as the MX100. Nobody is going to keep that drive for 10 years anyway. In 10 years the drive will be obsolete. Most users won't even notice the difference in speed in their every day usage.MrSpadge - Tuesday, July 1, 2014 - link
BTW: that image is surely not an X-Ray but "just" an ordinary SEM image (scanning electron microscope).Spatty - Tuesday, July 1, 2014 - link
This is correct. SEM image after a FIB.drwho9437 - Wednesday, July 2, 2014 - link
As I mentioned elsewhere, it is probably a STEM bright field image after a FIB liftout of the gate stack. Certainly not an X-ray; he should be correct the article...Cerb - Tuesday, July 1, 2014 - link
"The wear out causes the insulators to lose their insulating characters" - shouldn't that be characteristic(s)?jann5s - Tuesday, July 1, 2014 - link
I'm wondering If this technology will also end up in SD (XD) memory cards?