Samsung SSD 850 Pro (128GB, 256GB & 1TB) Review: Enter the 3D Era
by Kristian Vättö on July 1, 2014 10:00 AM ESTRAPID 2.0: Support For More RAM & Updated Caching Algorithm
When the 840 EVO launched a year ago, Samsung introduced a new feature called RAPID (Real-time Accelerated Processing of I/O Data). The idea behind RAPID is very simple: it uses the excess DRAM in your system to cache IOs, thus accelerating storage performance. Modern computers tend to have quite a bit of DRAM that is not always used by the system, so RAPID turns a portion of that into a DRAM cache.
With the 850 Pro, Samsung is introducing Magician 4.4 along with an updated version of RAPID. The 1.0 version of RAPID supported up to 1GB of DRAM (or up to 25% if you had less than 4GB of RAM) but the 2.0 version increases the RAM allocation to up to 4GB if you have 16GB of RAM or more. There is still the same 25% limit, meaning that RAPID will not use 4GB of your RAM if you only have 8GB installed in your system.
I highly recommend that you read the RAPID page of our 840 EVO review because Anand explained the architecture and behavior of RAPID in detail, so I will keep the fundamentals short and focus on what has changed.
In addition to increasing the RAM allocation, Samsung has also improved the caching algorithms. Unfortunately, I was not able to get any details before the launch but I am guessing that the new version includes better optimization for file types and IO sizes that get the biggest benefit from caching. Remember, while RAPID works at the block level, the software also looks at the file types to determine what files and IO blocks should be prioritized. The increased RAM allocation also needs an optimized set of caching algorithms because with a 4GB cache RAPID is able to cache more data at a time, which means it can relax the filetype and block size restrictions (i.e. it can also cache larger files/IOs).
To test how the new version of RAPID performs, I put it through our Storage Benches as well as PCMark 8’s storage test. Our testbed is equipped with 32GB of RAM, so we should be able to get the full benefit of RAPID 2.0.
| Samsung SSD 850 Pro 256GB | ||||
| ATSB - Heavy 2011 Workload (Avg Data Rate) | ATSB - Heavy 2011 Workload (Avg Service Time) | ATSB - Light 2011 Workload (Avg Data Rate) | ATSB - Light 2011 Workload (Avg Service Time) | |
| RAPID Disabled | 310.8MB/s | 676.7ms | 366.6MB/s | 302.5ms |
| RAPID Enabled | 549.1MB/s | 143.4ms | 664.4MB/s | 134.6ms |
The performance increase in our Storage Benches is pretty outstanding. In both the Heavy and Light suites the increase in throughput is around 80%, making the 850 Pro even faster than the Samsung XP941 PCIe SSD.
| Samsung SSD 850 Pro 1TB | ||||
| PCMark 8 - Storage Score | PCMark 8 - Storage Bandwidth | |||
| RAPID Disabled | 4998 | 298.6MB/s | ||
| RAPID Enabled | 5046 | 472.8MB/s | ||
PCMark 8, on the other hand, tells a different story. As you can see, the bandwidth is again much faster, about 60%, but the storage score is only a mere 1% higher.
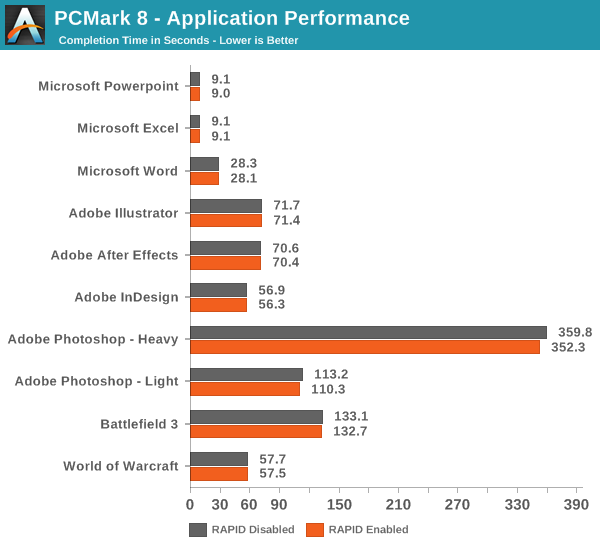
PCMark 8 also records the completion time of each task in the storage suite, which gives us an explanation as to why the storage scores are about equal. The fundamental issue is that today’s applications are still designed with hard drives in mind, meaning that they cannot utilize the full potential of SSDs. Even though the throughput is much higher with RAPID, the application performance is not because the software has been designed to wait several milliseconds for each IO to complete, so it does not know what to do when the response time is suddenly in the magnitude of a millisecond or two. That is why most applications load the necessary data to RAM when launched and only access storage when it is a must as back in the hard drive days, you wanted to avoid touching the hard drive as much as possible.
It will be interesting to see what the industry does with the software stack over the next few years. In the enterprise, we have seen several OEMs release their own APIs (like SanDisk’s ZetaScale) so companies can optimise their server software infrastructure for SSDs and take the full advantage of NAND. I do not believe that a similar approach works for the client market as ultimately everything is on the hands of Microsoft.
I also tried running the 2013 suite, a.k.a. The Destroyer, but for some reason RAPID did not like that and the system BSODed midway through the test. I am thinking that this is because our Storage Benches are ran without a partition, whereas RAPID also works at the file system level in the sense that it takes hints of what files should be cached. Due to that, it may be as simple as that under a high queue depth workload (like the ATSB2013), RAPID does not know what IOs to cache because there is no filesystem to guide it. I faced the same BSOD issue immediately when I fired up our IO consistency test (also ran without a partition), but when I tested with a similar 4KB random write workload using the new Iometer (which supports filesystem testing), there was absolutely no issue. This further suggests that the issue lies in our tests instead of the RAPID software itself as end-users will always run the drive with a partition anyway.
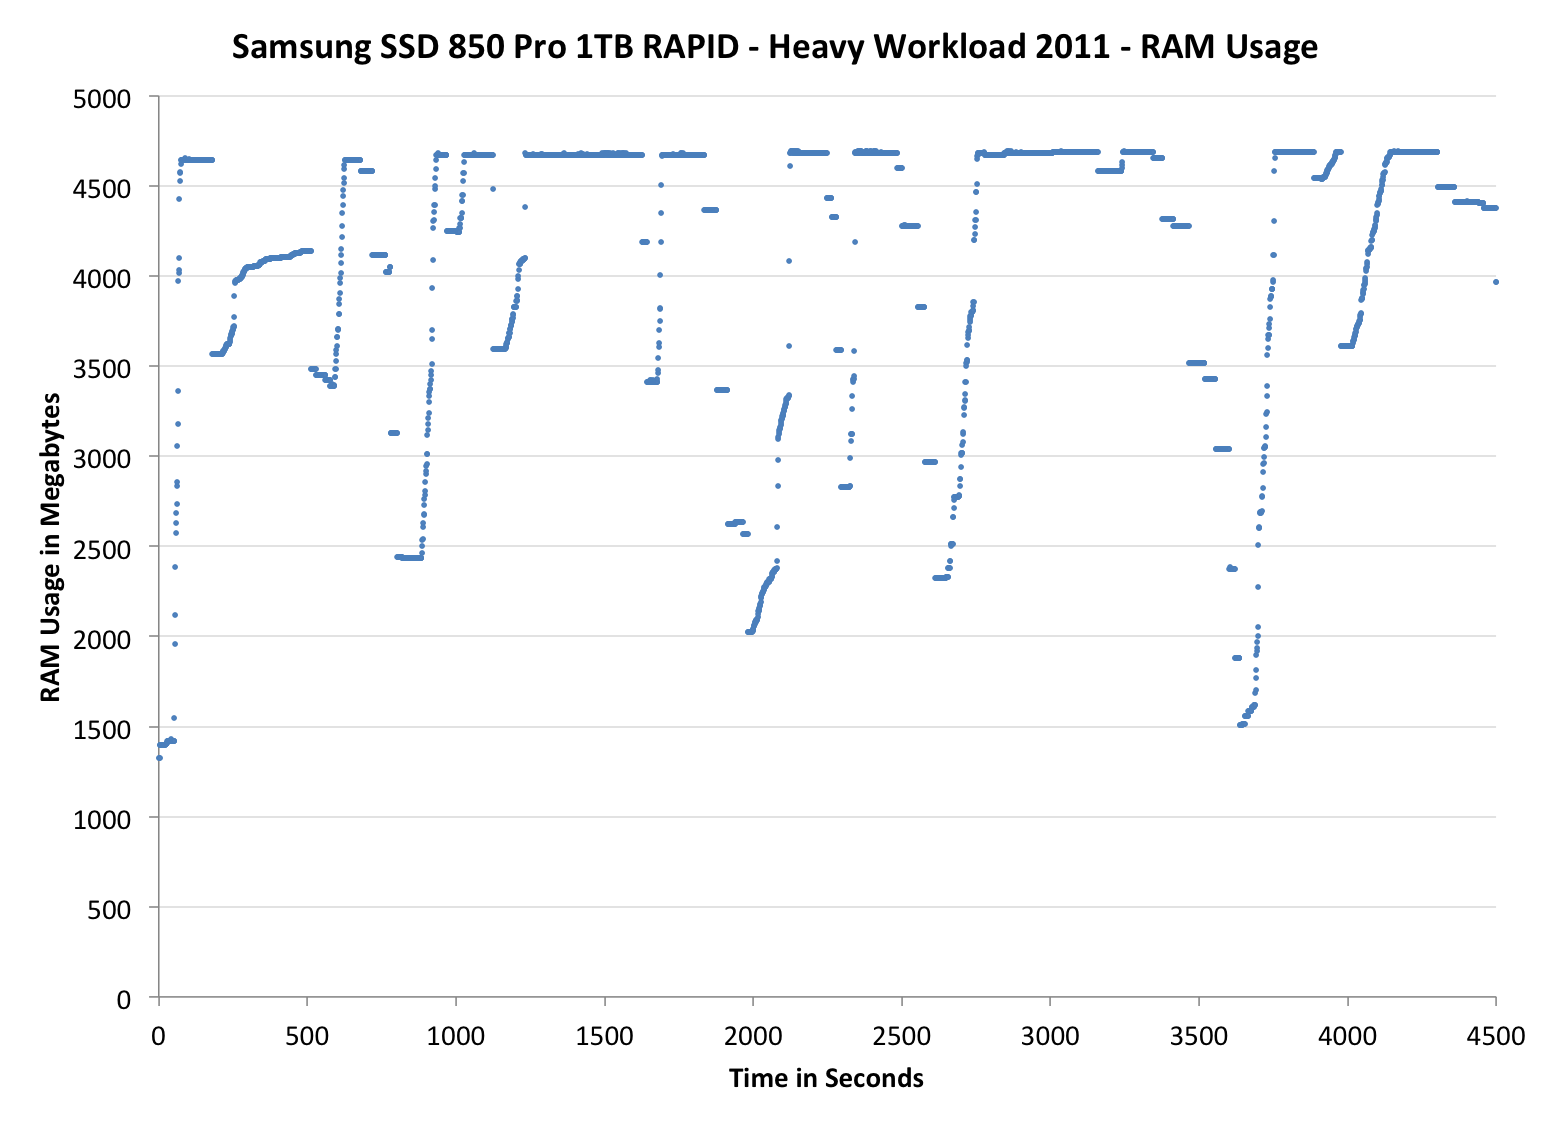
As Anand mentioned in the 840 EVO review, it is possible to monitor RAPID’s RAM usage by looking at the non-paged RAM pool. Instead of just looking at the resource monitor, I decided to take the monitoring one step further by recording the RAM usage over time with Windows’ Performance Monitor while running the 2011 Heavy workload. RAPID seems to behave fairly aggressively when it comes to RAM caching as the RAM usage increases to ~4.7GB almost immediately after firing up the test and stays there almost throughout the test. There are some drops, although I am not sure what is causing them. The idle times are limited to a maximum of 25 seconds when running the trace, so some drops could be caused by that. I need to do run some additional test and monitor the IOs to see if it is just the idle times of whether RAPID is excluding certain types of IOs.

I also ran ATTO to see how the updated RAPID responses to different transfer sizes. It looks like read performance scales quite linearly until hitting the IO size of 256KB. ATTO stores its performance values in 32-bit integers and with RAPID enabled performance exceeds the size of the result variable, thus wrapping around back to 0.
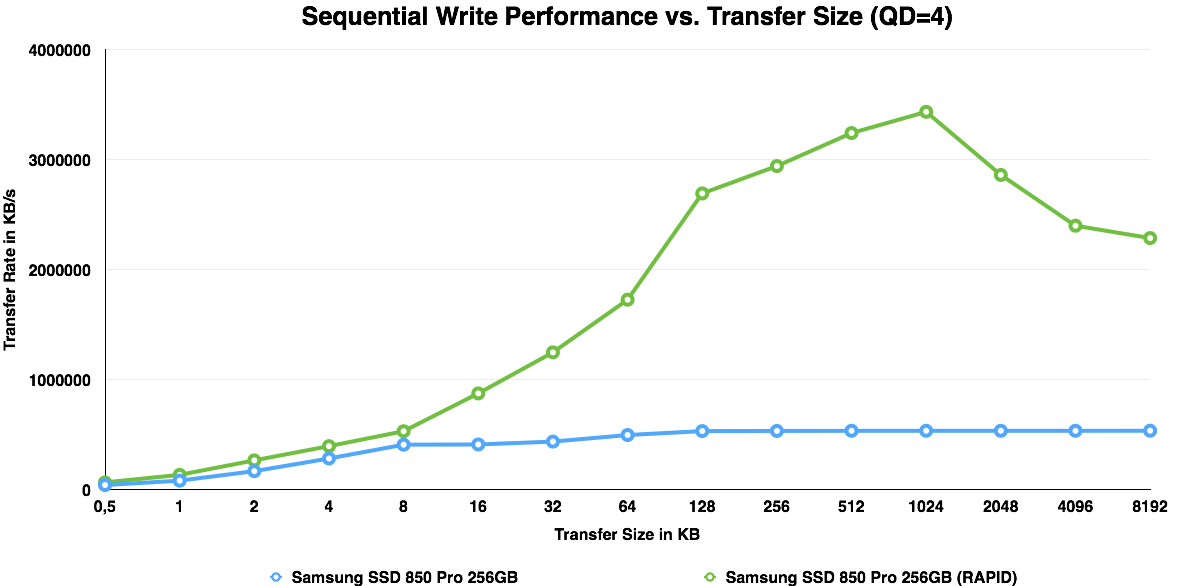
With writes, RAPID continues to cache fluently until hitting 1MB, which is when it starts to cache less aggressively.


160 Comments
View All Comments
TrackSmart - Tuesday, July 1, 2014 - link
I second this. The Anandtech SSD tests were designed so that we could tell the difference between drives that are all so fast - that there is no way to tell them apart in ordinary usage scenarios. I see the value of testing the theoretical performance of drives as manufacturers push the technological limits.That said, at the end of the day user-experience is what matters. I agree with emn13 that the "light workload" test is already more strenuous than anything the average user is likely to do, and looking at the chart, we see that almost every drive is within a range of ~280 to ~380 MB/s. I'm guessing that the range in performance gets even narrower for "real world" workloads.
So keep up the innovative SSD testing, but be sure to put these theoretical performance gains into a real-world context when you get to the Conclusions section of these articles. Not everyone will benefit from these theoretical increases in performance.
hojnikb - Tuesday, July 1, 2014 - link
Is Samsung planning on doing TLC based V-NAND anytime soon ?It would be great for a mainstream drive, since endurance would be higher (due to older node), speeds would probobly also went up (so no need for gimicks like turbowrite).
Or is it not mature enough to scale down to TLC ?
artifex - Tuesday, July 1, 2014 - link
You had me at 10 years warranty. I don't mind the slight premium if I'm not buying another one midway through the cycle. Sure, it will be obsolete well before it dies, but that term signals Samsung is really confident about their reliability.Gigaplex - Tuesday, July 1, 2014 - link
Since it's twice the price of competition like the MX100, you're better off replacing mid way through the cycle.Arnulf - Tuesday, July 1, 2014 - link
I must have missed this in the article - are these V.NAND cells as used in 850 Pro drives 2 or 3 bits per cell ? I got the "larger lithography improves endurance" part, I'm just wondering whether they opted for more conservative option (MLC) there as well.extide - Tuesday, July 1, 2014 - link
These are MLC, or 2 bit per cell.It would be interesting if the non pro 850 comes out with TLC V-NAND!
himem.sys - Tuesday, July 1, 2014 - link
Heh, we are waiting for tests 850pro vs 840pro, because there are no bigger differences "on paper".sirvival - Tuesday, July 1, 2014 - link
Hi,one question:
In the review the idle power consumption for e.g. the 850 128gig is 35 mw.
I wanted to compare that to my Samsung 470 so I went to Bench and selected the drives for comparison.
There it says that the 850 uses 0.29 Watt.
So how comes there is a difference?
KAlmquist - Tuesday, July 1, 2014 - link
Anandtech Bench has four SSD power numbers:SSD Slumber Power (HIPM+DIPM)
Drive Power Consumption - Idle
Drive Power Consumption - Sequential Write
Drive Power Consumption - Random Write
The confusing things are that (1) the review only listed slumber power, not idle power, and (2) Bench lists both numbers but doesn't place the slumber power next to the other power values.
mutantmagnet - Tuesday, July 1, 2014 - link
I also find the lack of powerloss protection being a big negative over this hard drive. Until REFS has all the features it needs in Windows that you would get in Linux this is going to be an important feature for anyone who values data integrity. Even after that happens it still might be very important.