SanDisk Extreme Pro SSD (240GB, 480GB & 960GB) Review: The Fastest Just Got Faster
by Kristian Vättö on June 16, 2014 4:00 PM EST- Posted in
- Storage
- SSDs
- SanDisk
- Extreme Pro
AnandTech Storage Bench 2013
Our Storage Bench 2013 focuses on worst-case multitasking and IO consistency. Similar to our earlier Storage Benches, the test is still application trace based - we record all IO requests made to a test system and play them back on the drive we are testing and run statistical analysis on the drive's responses. There are 49.8 million IO operations in total with 1583.0GB of reads and 875.6GB of writes. I'm not including the full description of the test for better readability, so make sure to read our Storage Bench 2013 introduction for the full details.
| AnandTech Storage Bench 2013 - The Destroyer | ||
| Workload | Description | Applications Used |
| Photo Sync/Editing | Import images, edit, export | Adobe Photoshop CS6, Adobe Lightroom 4, Dropbox |
| Gaming | Download/install games, play games | Steam, Deus Ex, Skyrim, Starcraft 2, BioShock Infinite |
| Virtualization | Run/manage VM, use general apps inside VM | VirtualBox |
| General Productivity | Browse the web, manage local email, copy files, encrypt/decrypt files, backup system, download content, virus/malware scan | Chrome, IE10, Outlook, Windows 8, AxCrypt, uTorrent, AdAware |
| Video Playback | Copy and watch movies | Windows 8 |
| Application Development | Compile projects, check out code, download code samples | Visual Studio 2012 |
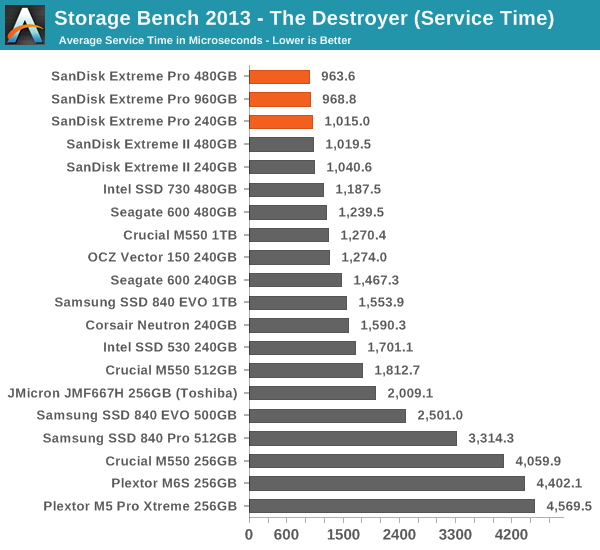
We are reporting two primary metrics with the Destroyer: average data rate in MB/s and average service time in microseconds. The former gives you an idea of the throughput of the drive during the time that it was running the test workload. This can be a very good indication of overall performance. What average data rate doesn't do a good job of is taking into account response time of very bursty (read: high queue depth) IO. By reporting average service time we heavily weigh latency for queued IOs. You'll note that this is a metric we have been reporting in our enterprise benchmarks for a while now. With the client tests maturing, the time was right for a little convergence.
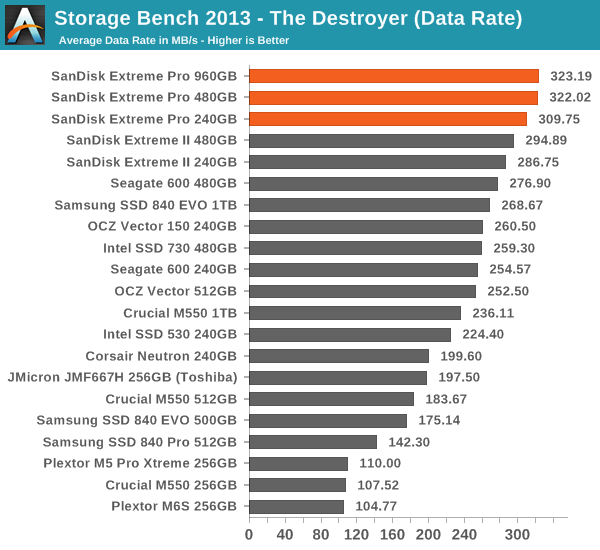
Given that the Extreme II was already dominating the Storage Bench 2013, it doesn't come as a surprise that the Extreme Pro is the new crownholder. Even the SSD 730 and Vector 150 can't challenge the Extreme Pro despite the fact that in terms of pure random write performance they are better. I think SanDisk's strength lies in mixed read/write performance because write performance alone does not yield good results in real world workloads, which tend to be a mix of reads and writes.
In fact, client workloads (like our Storage Benches) are usually more read-centric anyway and in the case of the Extreme Pro, the drive spent over three times longer processing read IOs than write IOs, which makes sense because there are nearly four times more read IOs than there are write IOs in the trace (even though in terms of gigabytes the difference is only twofold).


85 Comments
View All Comments
Solid State Brain - Tuesday, June 17, 2014 - link
@Kristian VättöIf you still can, could you please post somewhere some screenshots (preferably) or write down the description/name for all SMART attributes for this drive from the SanDisk SSD Dashboard under the SMART tab?
SanDisk doesn't readily provide this information to the public, and if you could fulfill this request, it would get easier to make sense of those attributes with other popular third party drive SMART information tools such as CrystalDiskInfo.
This is what I got on my Extreme II SSD from that SanDisk SSD Dashboard. As far as I know the Extreme PRO has more/different SMART parameters, which is interesting since the controller should be the same:
5 / 05 - Retired Block Count
9 / 09 - Power On Hours
12 / 0C - Device Power Cycle Count
166 / A6 - Min W/E Cycle
167 / A7 - Min Bad Block/Die
168 / A8 - Maximum Erase Cycle
169 / A9 - Total Bad Block
171 / AB - Program Fail Count
172 / AC - Erase Fail Count
173 / AD - Average Erase Cycle
174 / AE - Unexpected Power Loss Count
187 / BB - Reported Uncorrectable Errors
194 / C2 - Current Temperature
212 / D4 - SATA PHY Error
230 / E6 - Percentage Total P/E Count XX.YY
232 / E8 - Spare Blocks Remaining
233 / E9 - Total GB Written to NAND
241 / F1 - Total GB Written
242 / F2 - Total GB Read
243 / F3 - [?]
Kristian Vättö - Tuesday, June 17, 2014 - link
My drives are currently at my friend's place as he does the photography for me (I don't have a DSLR), so I can't do this right now. However, I'll swing by his place next week at the latest, so feel free to remind me via email (kristian@anandtech.com) in a week or so if I forget :)Solid State Brain - Tuesday, June 17, 2014 - link
Ok, I will. FYI, I plan to submit that information to the CrystalDiskInfo author. After I sent him SMART attribute information for the Extreme II he promised to implement it in the next program version (so that they will not appear as "vendor specific" anymore).Seville Orange - Tuesday, June 17, 2014 - link
What happens to performance consistency if the drive has a few partitions?Say you have 50GB for Windows, 30GB for Linux, 10GB for Swap - if you use the remaining space as a partition will you then get max performance? or will the performance be reduced regardless because partitioning has the same effect as leaving spare area?
josquin - Thursday, July 10, 2014 - link
I also would like to get the answer to this question.croc123 - Tuesday, June 17, 2014 - link
Not to pick nits, but "SanDisk Extreme Pro SSD (240GB, 480GB & 960GB) Review: The Fastest Just Got Faster" seems to me to be a bit of hyperbole unsupported by the facts... A paid review, perhaps?Kristian Vättö - Tuesday, June 17, 2014 - link
The Extreme II was already the fastest SATA SSD, so in that sense "the fastest just got faster" because the Extreme Pro is essentially a tweaked Extreme II. I know we don't often use such headlines but I think in this case it's justified. Of course, feedback is always welcome -- do you prefer the general headlines instead?MrX8503 - Tuesday, June 17, 2014 - link
The tests show that it is the fastest. What kind of facts are you looking for?junky77 - Tuesday, June 17, 2014 - link
That's what I wanna get 4 years from now, with M.2 interfacejuhatus - Thursday, June 19, 2014 - link
That´s sarcasm right? M.2 PCI-E ssd are already 3x faster and with nvme, alot more.Comment on:
"All in all, the Extreme Pro is the only no compromise high-end SSD in the market." I would say high-end SATA SSD, this extreme pro is going to look like slow drive in 2015 with all the M.2 craze. So price is all that much more important factor, your going to pay hefty premium when there are multitudes faster products coming(and existing) and SATA/ACHI is capping your performance. Sata is dead, long live the new Sata :)
Im hoping my Z97 built this summer boots from M.2(or heck even pcie), any chance of getting article about that?